
Abstract
Background
Graphene and its derivative graphene oxide (GO) have been implicated in a wide range of anticancer effects.
Purpose
The objective of this study was to systematically evaluate the toxicity and underlying mechanisms of GO on two osteosarcoma (OSA) cancer cell lines, MG-63 and K7M2 cells.
Methods
MG-63 and K7M2 cells were treated by GO (0–50 µg/mL) for various time periods. Cell viability was tested by MTT and Live/Dead assays. A ROS Detection Kit based on DHE oxidative reaction was used for ROS detection. An Annexin V-FITC Apoptosis Kit was used for apoptosis detection. Dansylcadaverine (MDC) dyeing was applied for seeking unspecific autophagosomes. Western blot and Immunofluorescence analysis were used for related protein expression and location.
Results
K7M2 cells were more sensitive to GO compared with MG-63 cells. The mechanism was attributed to the different extent of the generation of reactive oxygen species (ROS). In K7M2 cells, ROS was easily stimulated and the apoptosis pathway was subsequently activated, accompanied by elevated expression of proapoptosis proteins (such as caspase-3) and decreased expression levels of antiapoptosis proteins (such as Bcl-2). A ROS inhibitor (N-acetylcysteine) could alleviate the cytotoxic effects of GO in K7M2 cells. However, the production of ROS in MG-63 cells was probably inhibited by the activation of an antioxidative factor, nuclear factor-E2-related factor-2, which translocated from the cytoplasm to the nucleus after GO treatment, while a nuclear factor-E2-related factor-2 inhibitor (ML385) significantly increased ROS production in MG-63 cells when combined with GO treatment. In addition, autophagy was simultaneously stimulated by characteristic autophagosome formation, autophagy flux, and increased the expression level of autophagy-related proteins (such as LC3I to LC3II conversion, ATG5, and ATG7).
Conclusion
This paper proposes various underlying mechanisms of the anticancer effect of GO. The novel synthetic use of GO with an oxidizing agent is the key step for further potential applications in clinical OSA cancer therapy.
Introduction
Osteosarcoma (OSA) is one of the most common malignant tumors that easily occur predominantly in children, adolescents, and young adults.Citation1 Although its incidence is lower than that of other malignant tumors, its characteristics, including high mortality rate, early distant metastasis, and confusion with trauma, make OSA a challenge for clinical diagnosis and therapy.Citation2 In practice, the combination of aggressive surgical resection, chemotherapy, and radiotherapy offers a certain extent of improvement for OSA patients. However, the rapid proliferation rate and the invasive potential of OSA cancer cells remain the major cause of death.Citation3 Thus, development of new agents is urgently needed for clinical OSA therapy.
Recently, nanomaterials have been widely studied for biomedical applications due to their congruent combination of chemical, physical, and biologic properties. Given the carbon-based chemistry and outstanding biocompatible properties, graphene oxide (GO) has attracted considerable interest among nanomaterials such as silver, zinc oxide, and magnesium oxide.Citation4 GO has been explored in a wide range of diagnostic and therapeutic fields, showing potential in areas such as engineered tissues,Citation5 drug delivery carriers,Citation6 biomedical imaging,Citation7 antibacterial materials,Citation8 Alzheimer’s disease diagnosis,Citation9 and anticancerCitation10 therapies.
The underlying mechanisms of GO or characterized GO anticancer effects were extensively studied previously. The toxic effect of GO was primarily attributed to the generation of reactive oxygen species (ROS). For example, GO can induce cytotoxicity against human breast cancer MDA-MB-231 cells probably due to cellular ROS generation.Citation11 Increased ROS, lactate dehydrogenase release, activation of caspase-3, and DNA fragmentation were also claimed to be involved in acid-reduced, GO-induced anti-human ovarian cancer effects.Citation12 In addition, GO nanosheets exert significant toxicity to human liver cancer HepG2 cells, which is related to the activation of intrinsic apoptotic caspase-independent pathway and S phase cell cycle arrest.Citation13 Notably, autophagy maintains cellular homeostasis by clearing damaged protein or organelles as a recycling process, but excessive autophagy is closely related to the induction of autophagic cell death.Citation14 Reportedly, increased ROS production and autophagy are simultaneously induced by GO at low concentrations in neuroblastoma cell lines without cell growth arrest or death.Citation15 Thus, the underlying mechanisms accompanied by ROS remain controversial in GO-induced anticancer effects, which have not been well investigated.
In this study, we aim to evaluate the cytotoxic effects of GO on human OSA MG-63 cells and murine OSA K7M2 cells and explore the mechanisms related to the cell death pathways stimulated by GO.
Materials and methods
Materials
GO (50–200 nm) was purchased from Chengdu Organic Chemical Co., Chinese Academy of Sciences (Chengdu, China). MTT, 4,6-diamidino-2-phenyl-indole, dihydroethidium (DHE), N-acetylcysteine (NAC), and Bafilomycin A1 (Baf) were supplied by Sigma-Aldrich Co. (St Louis, MO, USA). Nuclear factor-E2-related factor-2 (Nrf-2) inhibitor (ML385) was bought from MedChem Express Co. (Shanghai, China). The Live/Dead viability kit was purchased from Thermo Fisher Scientific (Waltham, MA, USA). The antibodies including Nrf-2, ATG3, ATG5, ATG7, caspase-3, cleaved-caspase-3, and lamin B1 were provided by Cell Signaling Technology (Beverly, MA, USA). Antibodies of LC3, Bcl-2, and β-actin were provided by Santa Cruz Biotechnology Inc. (Santa Cruz, CA, USA).
Cell cultures
MG-63 and K7M2 cells were obtained from the American Type Culture Collection (ATCC, Rockville, MD, USA). They were maintained in DMEM (Thermo Fisher Scientific) with 10% fetal calf serum. Nonessential amino acids (5 mmol/L), L-glutamine (5 mmol/L), penicillin (100 U/mL), and streptomycin (100 U/mL; Thermo Fisher Scientific) were added to the culture medium, and the cells were kept in a humidified 5% CO2 atmosphere at 37°C.
Cell viability assay
MTT assay was used for cell viability. Briefly, 6,000 cells/well (MG-63 and K7M2 cells) were seeded into 96-well cell culture plates. They were treated with GO of different concentrations (0–50 µg/mL) for 0.5, 2, 4, 6, and 8 h. Besides, for evaluation of NAC’s (a ROS scavenger) influence on GO’s cytotoxic effect, MG-63 and K7M2 cells were also treated with GO with or without NAC (10 mmol/L) and then incubated for the next 8 h. Then, 20 µL MTT and 150 µL dimethyl sulfoxide were added for the MTT assay as previously described.Citation16
Observation of morphology
MG-63 and K7M2 cells were incubated in 0, 25, and 50 µg/mL GO for 2, 4, and 8 h. Subsequently, the cells were observed after washing with PBS by using an ordinary digital camera (Olympus, Tokyo, Japan).
Live/Dead assay
At the same time, cell viability was also tested using a Live/Dead assay. MG-63 and K7M2 cells were incubated in the absence or presence of 25 and 50 µg/mL GO for 2, 4, and 8 h. Briefly, 1 mL of PBS containing 4 µL of 2 mM ethidium homodimer-1 (EthD-1) assay solution and 2 µL of 50 µM calcein AM assay solution was prepared. Then, 200 µL of the Live/Dead solution was added to each well for 15 min in an incubator at 37°C. The staining solution was removed and the samples were then imaged under a fluorescence microscope (Olympics IX73) with 494 nm (green, calcein) and 528 nm (red, EthD-1) excitation filters.
Intracellular ROS assay
A ROS Detection Kit (Sigma Co., St Louis, MO, USA) was used for ROS detection, based on DHE oxidative reaction. MG-63 and K7M2 cells were treated in the absence or presence of 25 and 50 µg/mL GO for 0.5, 2, 4, and 8 h. To explore Nrf-2’s effect on ROS generation, MG-63 cells were also incubated with GO (25 and 50 µg/mL) with or without Nrf-2 inhibitor (ML385, 2 µM) for 2 and 4 h. Then, 5 µM DHE assay reagent was added and the cells were incubated at 37°C for 30 min. Finally, the cells were washed and maintained in PBS. Their images were captured using a fluorescence microscope (Carl Zeiss Microimaging, NY, USA), and the fluorescence intensity was determined by FACS Calibur (Becton Dickinson, San Jose, CA, USA).
Detection of cell apoptosis
An Annexin V-FITC Apoptosis Kit (BD Biosciences, CA, USA) was used for apoptosis detection according to the manufacturer’s instructions. At 4 and 8 h after incubation with 25 and 50 µg/mL GO, K7M2 cells were harvested and washed with PBS. Apoptosis of cells was tested and analyzed as previously described.Citation16
Visualization of autophagosomes
Dansylcadaverine (MDC) dyeing method was also applied to seek unspecific autophagosomes. MG-63 and K7M2 cells were treated with 0, 25, and 50 µg/mL GO for 2 h, respectively. Afterwards, the cells were washed with PBS and dyed with MDC working solution (50 µM) for 30 min at room temperature. The images were captured by a fluorescence microscope.
Western blot
MG-63 and K7M2 cells were incubated with or without 25 and 50 µg/mL GO for 2, 4, and 8 h. For the combined treatment with 50 µg/mL GO and autophagy inhibitor (Baf, 100 nmol/L), Baf was added 4 h before the cells were harvested. Cellular total protein, cytoplasmic and nuclear proteins were extracted as previously described.Citation16 Notably, NE-PER Nuclear and Cytoplasmic Extraction Reagent Kit (Thermo Fisher Scientific) was used for the isolation of cytoplasmic and nuclear proteins. The blots were carried out as previously reported.Citation16 The antibodies of β-actin, Nrf-2, caspase-3, cleaved-caspase-3, Bcl-2, ATG5, ATG3, ATG7, and LC3 proteins were diluted at a concentration 1:1,000 with 5% fresh non-fat milk.
Immunofluorescence analysis
MG-63 and K7M2 cells were plated onto circular glass coverslips and were stimulated with GO (25 µg/mL) for 2 h. Subsequently, the cells were fixed and permeabilized with 2% formalin and 0.1% Triton X-100 (10 min, room temperature). Nrf-2 primary antibody (1:100) and a rabbit IgG-CY3 secondary antibody (1:500) were added and incubated overnight at 4°C. The nucleus was stained with 5 µg/mL 4,6-diamidino-2-phenyl-indole (30 min, room temperature).
Statistical analysis
Data are expressed as mean±SD for at least two to three independent experiments. Two-tailed Student’s t-test was used for making comparisons between the treated group and the control group. All statistical tests used SPSS version 17.0. P-value of 0.05 or less between the groups was considered significant.
Results
GO inhibits the growth of MG-63 and K7M2 cells
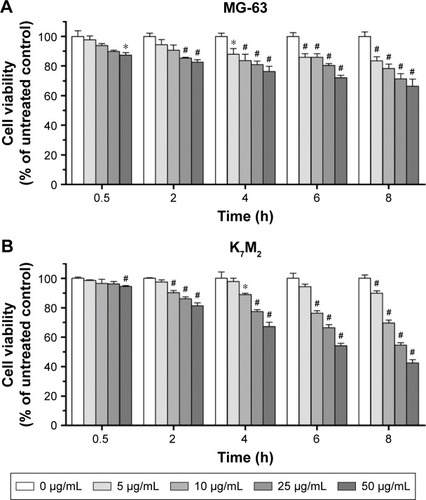
The cytotoxic effects of GO on MG-63 and K7M2 cells were tested by MTT assay. After GO treatment at 0–50 µg/mL (without fetal bovine serum [FBS]), the viabilities of both MG-63 and K7M2 cells were decreased in a dose- and time-dependent manner (). In general, K7M2 cells are more sensitive to GO compared with MG-63 cells. For example, the survival rate of K7M2 cells was 54.23%±3.97% after treatment with 50 µg/mL GO for 6 h, whereas the survival rate of MG-63 cells was 72.04%±4.22%.
Figure 1 The cytotoxic effect of GO on MG-63 and K7M2 cells. (A) MG-63 and (B) K7M2 cells were exposed to varying concentrations of GO for different treatment periods (without FBS).
Notes: The effects on cell viability were determined using an MTT assay with GO (0–50 µg/mL) treatment for 0.5–8 h. Cell viability was calculated as a percentage of untreated cells (100%) and compared with untreated control. Values are presented as mean±SD (*P<0.05, #P<0.01).
Abbreviations: FBS, fetal bovine serum; GO, graphene oxide.
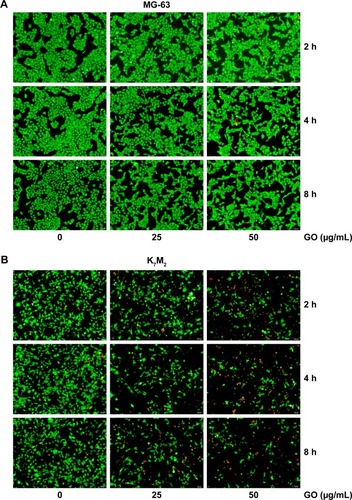
To further quantify the survival rates of GO-treated OSA cells, we applied fluorescence probes to track live and dead cells in solution. EthD-1 enters the damaged/dead cells and produces a bright-red fluorescence signal, whereas calcein AM is retained by live cells and produces green light. In , decreased green light intensities are observed in GO (25 and 50 µg/mL)-treated MG-63 cells compared with the untreated control and the gap between cells has become widened. However, marked changes were not detected in red light intensities, indicating that GO induces inhibition of cell proliferation instead of cell death at the given concentrations. By contrast, the number of cells emitting green light diminished in GO-treated K7M2 cells, whereas the number of cells emitting red light increased, confirming strong cytotoxic effects ().
Figure 2 Live/Dead assay of GO on (A) MG-63 and (B) K7M2 cells.
Note: A live (cells illuminated by green light)/dead (cells illuminated by red light) assay after treatment with 0, 25, 50 µg/mL GO (without FBS) for 2, 4, and 8 h.
Abbreviations: FBS, fetal bovine serum; GO, graphene oxide.
GO induces morphologic changes in MG-63 and K7M2 cells
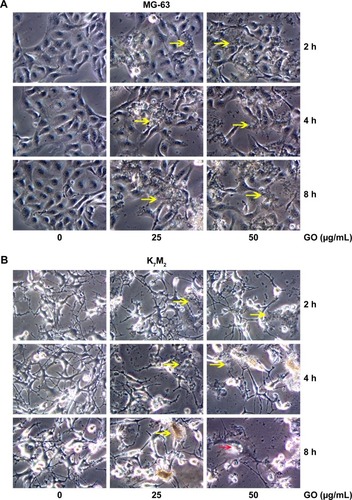
For further detecting the effect of GO on the morphologic changes in OSA cells, the MG-63 and K7M2 cells were examined through a microscope after they were exposed to GO nanomaterials and incubated in 25 and 50 µg/mL GO solutions without FBS for 2, 4, and 8 h. In the treated groups, aggregated GO nanomaterials were visible and adherent on the surface of both types of cells, indicating their interaction with the cell membrane (, yellow arrows). Compared with the untreated control, MG-63 cells in the GO-treated group appeared slightly vimineous and polygonal, possibly indicating internal damage. However, K7M2 cells were observed to be more seriously damaged after an equivalent treatment. Most cells became inflated and riddled with large cytoplasmic vacuoles, as highlighted by the red arrows in . We also found that a number of cells exhibited changes in orientation. Groups of cells became disordered and only loosely adhered to their substrates; finally, numerous cells floated in isolation in the medium (indicating that such cells were dead).
Figure 3 Morphology detection of GO in MG-63 and K7M2 cells.
Notes: (A) MG-63 and (B) K7M2 cells were treated with 0, 25, 50 µg/mL GO (without FBS) for 2, 4, and 8 h. Yellow arrows: GO material. Red arrows: K7M2 cells with large vacuoles.
Abbreviations: FBS, fetal bovine serum; GO, graphene oxide.
GO induces ROSgeneration in MG-63 and K7M2 cells
As the product of oxidative stress reaction, ROS generated from the nanomaterials and by cell interaction were recognized as one of the most significant causes of cell damage.Citation11,Citation12 To further detect whether GO induced ROS generation in the two OSA cancer cells, we applied DHE dyeing method. As shows, 25 and 50 µg/mL GO treatment for 2 h slightly induced ROS generation in MG-63 cells, whereas similar treatments of K7M2 cells rapidly stimulated the fluorescent compound ethidium. For example, compared with the untreated control, treatment of K7M2 cells with GO (25 µg/mL) for 0.5 h markedly increased the ROS content 3-fold (), indicating increased sensitivity of K7M2 cells relative to MG-63 cells.
Figure 4 GO induces ROS generation in MG-63 and K7M2 cells.
Notes: (A) MG-63 and K7M2 cells were treated with 0, 25, and 50 µg/mL GO for 2 h. Then, DHE analyses were applied to detect ROS generation. (B) Fluorescence analysis of ROS content. MG-63 and K7M2 cells were treated with 0, 25, and 50 µg/mL GO for 0.5, 2, 4, and 8 h. Fluorescence intensity was calculated compared to untreated control cells. Values are presented as mean±SD and compared with untreated control (*P<0.05, #P<0.01). (C) Cell viability assay was conducted by MTT. MG-63 and K7M2 cells were treated with 0, 25, and 50 µg/mL GO with or without NAC (10 mmol/L) for 8 h. #P<0.01 (compared with GO treatment alone).
Abbreviations: DHE, dihydroethidium; GO, graphene oxide; NAC, N-acetylcysteine; ROS, reactive oxygen species.
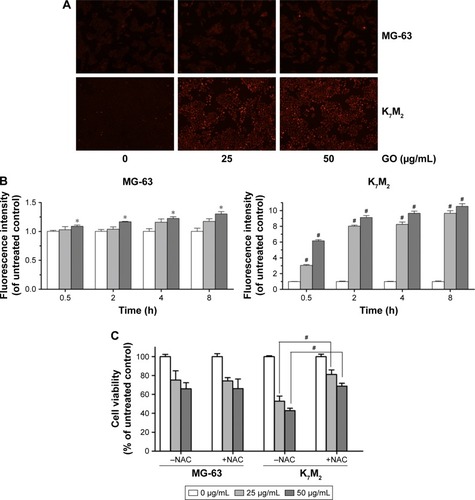
To explore whether ROS production was one of the reasons for GO inducing cell growth inhibition in both cells, a ROS scavenger, NAC, was applied with and without GO treatment. In MG-63 cells, compared to GO treatment alone, NAC (10 mmol/L) had no obvious effect on cell growth when it was combined with 25 and 50 µg/mL GO treatment for 8 h (P>0.05, ). In contrast, NAC (10 mmol/L) significantly increased the cell viability from 52.89%±5.34% (25 µg/mL GO) to 81.07%±4.83% (25 µg/mL GO with NAC; #P>0.01), and from 42.88%±2.50% (50 µg/mL GO) to 68.83%±2.97% (50 µg/mL GO with NAC; #P<0.01) in K7M2 cells. All these results revealed that ROS generation was important for its great contribution to cell death in K7M2 cells. However, in MG-63 cells, the cell growth inhibition seemed to have no relationship with ROS production.
GO induces Nrf-2 translocation from the cytoplasm to the nucleus in MG-63 cells
Nrf-2 was previously reported as a basic leucine zipper protein that regulates the expression of antioxidant proteins and protects against oxidative damage triggered by injury and inflammation. Given that GO induced ROS production in both OSA cancer cells, Nrf-2 location () and expression () were examined through immunofluorescence and Western blot assays. On treatment with 25 µg/mL GO for 2 h, the Nrf-2 cytoplasm emitting red fluorescence was transferred to MG-63 cell nucleus (). However, the location and expression of Nrf-2 in K7M2 cells were not markedly affected under the same condition. These findings indicated that GO induced Nrf-2 activation in MG-63 cells.
Figure 5 GO induces Nrf-2 transport from the cytoplasm to the nucleus in MG-63 cells.
Notes: (A) MG-63 and K7M2 cells were treated with or without GO (25 µg/mL) for 2 h. Nrf-2 primary antibody and a rabbit IgG-CY3 secondary antibody were added for immunofluorescence assay (×40). (B) Cytoplasmic and nuclear Nrf-2 were determined by Western blot analysis with reference to β-actin and lamin B1. MG-63 and K7M2 cells were stimulated with or without GO (25 µg/mL) for 2 h. Cytoplasmic and nuclear cells were isolated by ER Nuclear and Cytoplasmic Extraction Reagents. (C) Fluorescence analysis of ROS content by DHE. Cells were treated with 0, 25, and 50 µg/mL GO with or without ML385 (2 µmol/L) for 2 and 4 h. #P<0.01 (compared with GO treatment alone).
Abbreviations: DHE, dihydroethidium; DAPI, 4,6-diamidino-2-phenyl-indole; GO, graphene oxide; ROS, reactive oxygen species.
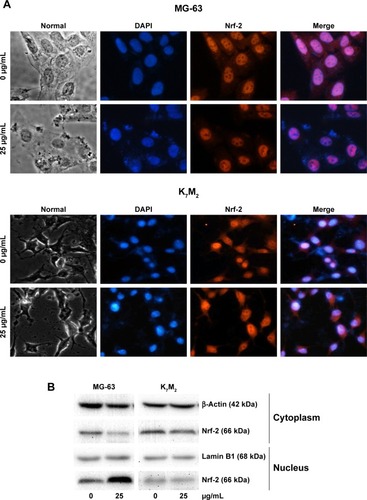
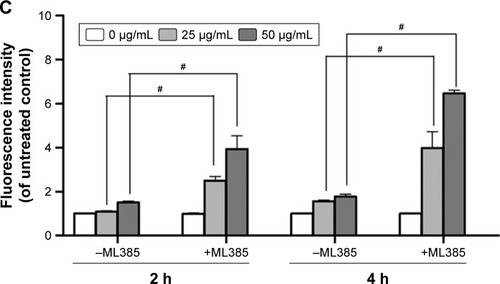
To further prove that Nrf-2 translocation and activation played an important role in diminishing ROS production in MG-63 cells, an Nrf-2 inhibitor, ML385,Citation17 was used in the absence or presence of GO for 2 and 4 h. As shown in , compared to GO treatment alone, ML385 (2 µmol/L) could significantly increase cellular ROS level by ~2–4-fold in MG-63 cells after co-incubation (#P<0.01). The results indicated that Nrf-2 activation was closely connected with and negatively regulated ROS generation.
GO induces apoptosis in K7M2 cancer cells
To further understand the mechanism of GO-induced K7M2 cell death, we determined whether apoptosis was enhanced by GO. The results showed that the application of GO for 4 and 8 h significantly induced viable (VA%) and nonviable apoptosis cell (NVA%) percentages in a dose-dependent manner (). GO treatment at 25 and 50 µg/mL for 4 h upregulated VA% and NVA% (P<0.01). However, when the treatment was extended for as long as 8 h at the concentration of 25 µg/mL, NVA% markedly increased (P<0.01) compared with VA% (P>0.05), indicating that the apoptosis event occurred in K7M2 cells on GO treatment.
Figure 6 GO induces apoptosis in K7M2 cancer cells.
Notes: (A) K7M2 cells were exposed to 0, 25, and 50 µg/mL GO for 4 and 8 h. Annexin V-FITC Apoptosis Detection Kit was used to determine the percent of early apoptosis (VA%) and late apoptosis cells (NVA%). The experiment was repeated three times and one representative experiment is shown, and each value represents the mean±SD of three in dependent experiments and compared with untreated control (#P<0.01). (B) GO induces apoptosis in K7M2 cancer cells, which were treated with 25 and 50 µg/mL GO for 2, 4, and 8 h. Bcl-2, caspase-3, and cleaved-caspase-3 were processed at all concentration points studied.
Abbreviations: GO, graphene oxide; NVA, nonviable apoptosis cell; PI, propidium iodide; VA, viable apoptosis cell.
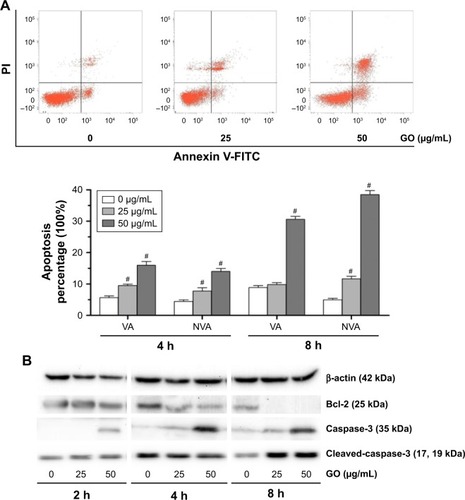
To address the molecular basis of GO-induced apoptosis in K7M2 cells, we determined the apoptosis-related protein expression by Western blot assay (). GO inhibited Bcl-2 protein expression levels, and the reduction was dose and time dependent. In addition, caspase-3 significantly increased under treatment with GO at the concentrations of 25 and 50 µg/mL for 2, 4, and 8 h. Besides, cleaved-caspase-3 was also activated after treatment with 25 and 50 µg/mL GO for 8 h. Overall, the results showed that the apoptosis induced by GO was related to the caspase-dependent signal pathway.
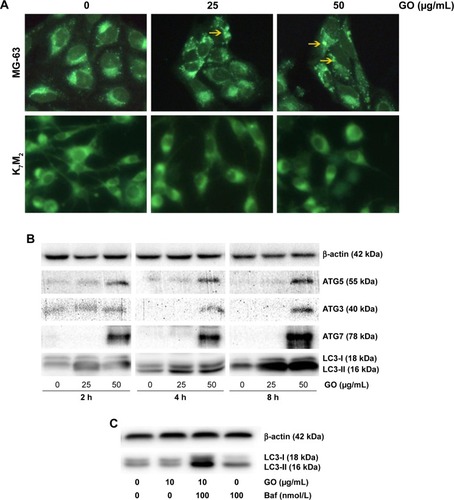
GO stimulates autophagy in MG-63 cancer cells
To gain insight into the mechanism of GO-enhanced growth inhibition of MG-63 cells, we determined the intracellular autophagy level by fluorescence microscopy and Western blot analysis. As shown in , 25 and 50 µg/mL GO induced the formation of autophagic cytoplasmic vesicles in MG-63 cells (autophagosomes). However, significant vesicle formation was not detected in K7M2 cells, suggesting the occurrence of a state of increased intracellular autophagy in MG-63 cells and not in K7M2 cells. Moreover, in the presence of 25 and 50 µg/mL GO for 2, 4, and 8 h, the intensity of LC3-II and autophagy-related ATG5, ATG3, and ATG7 proteins was markedly promoted, indicating that GO facilitated the autophagy level in MG-63 cells (). Furthermore, the accumulation of LC3-II means increased LC3-II production or decreased LC3-II degradation. To test autophagy flux, the proton pump inhibitor Baf was applied at a saturating concentration (100 nmol/L), indicating LC3-II accumulation. Compared with 100 nmol/L Baf treatment alone, the combination of GO (10 µg/mL) and Baf significantly increased LC3-II levels. Thus, these results showed that GO increased autophagosome synthesis, rather than inhibiting LC3-II degradation ().
Figure 7 GO stimulates autophagy in MG-63 cancer cells.
Notes: (A) MG-63 and K7M2 cells were exposed to 0, 25, 50 µg/mL GO for 2 h, respectively. Autophagy-related punctate structures in the cells were dyed by MDC solution and examined under a fluorescence microscope at ×40 magnification. Yellow arrows: autophagosomes. (B) MG-63 cells were stimulated with 25 and 50 µg/mL GO for 2, 4, and 8 h. The ratios of cytosolic LC3-I and lipidated autophagosome-bound LC3-II, ATG5, ATG3, and ATG7 were determined by Western blot. (C) To test the autophagic flux, MG-63 cells were stimulated with 25 µg/mL GO for 8 h and 100 nmol/L Baf was added 4 h before the cells were harvested.
Abbreviations: Baf, bafilomycin A1; GO, graphene oxide; MDC, dansylcadaverine.
Discussion
Several studies have demonstrated the cytotoxic effects of GO on normal, cancer, or bacterial cells.Citation13,Citation18,Citation19 However, some data suggested that GO is a safe biologic material that can even enhance the viabilities of certain human cancer cells without any toxicity.Citation20 These controversial effects were influenced by various factors, especially blood proteins. Zhou et alCitation21 have demonstrated that the formation of blood protein–graphene corona can effectively reduce GO cytotoxicity. Molecular simulations revealed that aromatic and basic residues, such as arginine, contributed significantly during the adsorption process due to the strong π–π stacking interactions between their aromatic rings and the graphene sp2-carbons. Furthermore, they studied the decreased cytotoxic effects of protein-coated GO by experimental method and concluded that blood protein weakened the interaction between phospholipids and graphene surface owing to a reduction of the available surface area and the presence of unfavorable steric effect, which significantly reduced graphene penetration and lipid bilayer damage.Citation22,Citation23 In this study, the incubation process of GO without FBS, which excluded the formation of the blood protein–graphene corona and enabled the direct interaction of GO with the cell membrane, finally resulted in toxicity (). Compared with the results of other studies,Citation13 ~400 µg/mL GO treatment for 24 h can induce cytotoxic effects on human hepatocellular cancer HepG2 cells. Reduction of doses by ~40 µg/mL GO was observed in our study for inducing the similar effects on the two types of OSA cells, indicating the important function of blood protein in affecting the cytotoxicity and biologic applications of GO.
In addition to its cytotoxic effects, GO was found to induce morphologic changes in MG-63 and K7M2 cells ( and ). Considerable evidence suggests that GO selectively targets microtubules of the cytoskeleton, thereby enabling its application in cytoskeleton imaging and mitosis tracking in live cells.Citation24 The cytoskeleton is a structure that helps the cells to maintain shape and internal organization. Thus, the changes in cell morphology (vimineous and polygonal changes) can be attributed to cytoskeleton damage by GO. In addition, large cytoplasmic vacuoles were detected in MG-63 and K7M2 cells after the incubation of GO at different concentrations (25 and 50 µg/mL). Through the combined experiments and computational molecular simulations in our previous study, strong dispersion interactions between graphene and lipid-tail carbons were suggested to result in depleted lipid density in the cell membrane, ultimately leading to the formation of water-permeable pores.Citation25 Although other studies noted that GO can activate autophagous pathways that induce cell deathCitation26 and that the large vacuoles may be related to the formation of autolysosomes, we still considered that physical damage may be caused by the interaction between GO and cell membrane owing to the occurrence not only in MG-63 cells but also in K7M2 cells without autophagy ().
As an activator of cell apoptosis, ROS can damage the mitochondria by inducing disruption of swelling and decreasing the mitochondrial transmembrane potential and finally activating the apoptosis-related signaling pathway.Citation11,Citation12 In K7M2 cells, GO easily stimulated ROS production after treatment for only 0.5 h () and effectively induced apoptosis (). Elevated free ROS radicals may cause oxidative damage to mitochondrial DNA, proteins, and lipids with the release of cytochrome c; finally, mitochondrial apoptosis pathways are activated.Citation27 Subsequently, apoptosis-related proteins, such as Bcl-2 and caspase-3, are affected (), inducing characteristic apoptotic progress (). Cleavage of procaspase-3 to caspase-3 is the key step in apoptosis induction.Citation16 GO treatment for 8 h significantly increased the expression of cleaved-caspase-3 (), finally resulting in characteristic apoptotic progress, such as DNA fragmentation and chromatin condensation. Consistent with a previous study, graphene/single-walled carbon nanotube hybrids proved to be toxic to two types of OSA cells (HOS and U2OS). It was also found that increased ROS level, decreased mitochondrial membrane potential, and elevated apoptosis were related to its cytotoxic effects.Citation28 Regarding the differences between the materials, graphene/single-walled carbon nanotube hybrids have a three-dimensional structure and graphene has a two-dimensional structure, and the hybrids are less cytotoxic than graphene.Citation28 Another study which combined GO with anti-HER2 antibody trastuzumab confirmed that the complex could simultaneously induce necroptosis in OSA cells by activating oxidative stress and HER2 signaling.Citation29 All these studies reveal that GO has great potential in OSA therapy due to its diverse structures and capacity as a carrier.
However, we found that the ROS level was not significantly elevated by GO in MG-63 cells (). To further understand the underlying mechanism, we determined the expression and location of the oxidative stress-responding transcription factor, Nrf-2. Under normal or unstressed conditions, Nrf-2 is immobilized in the cytoplasm by a cluster of proteins that degrade it quickly. However, oxidative stress causes the Nrf-2 to translocate to the nucleus, where the factor binds to a DNA promoter and initiates the transcription of antioxidative genes and their proteins, such as superoxide dismutase and heme oxygenase-1 antioxidant enzymes.Citation30 Here, on one hand, we found that GO at the indicated concentrations induced Nrf-2 translocation from the cytoplasm to the nuclei in MG-63 cells, but not in K7M2 cells (), indicating the activation of Nrf-2. On the other hand, Nrf-2 inhibitor, ML385, could significantly increase ROS generation in MG-63 cells. This finding suggests that antioxidant enzymes were probably activated in MG-63 cells, thereby eliminating ROS and maintaining a stable oxidative level. Consistent with our results, silica nanoparticles activated Nrf-2-ERK MAP kinase signaling pathway and exerted toxicity via oxidative stress.Citation30
As an evolutionary catabolic process, autophagy is recognized as self-eating or type II-programmed cell death that is crucial for the development and homeostasis of cells.Citation31 Under stressful conditions, autophagy allows the degradation of extra proteins and recycling of amino acids for the synthesis of proteins essential for survival.Citation32 In our study, GO stimulated autophagy in MG-63 cells through the formation of non-characteristic autophagosomes () and increase in the expression of autophagy-related proteins (). Notably, type I (cytosolic) LC3 protein could be converted into type II (membrane-bound) LC3 protein, and other autophagy-related ATG5, ATG3, and ATG7 proteins were markedly promoted by GO. In addition, autophagy flux was promoted by GO with combined treatment of autophagy inhibitor Baf at a saturating concentration, indicating GO could increase autophagosome synthesis, rather than inhibit LC3-II degradation (). During autophagy, ATG-5 is necessary for the formation of the ATG12 conjugation system (ATG12, ATG5, and ATG16) and ATG7 is necessary for the ATG8 lipidation system (ATG8, ATG3, and ATG7). Both systems mediate vesicle expansion and completion.Citation33
In conclusion, we found that different mechanisms including oxidative stress, apoptosis, and autophagy were involved in GO-induced anti-OSA effect. The results presented provide the novel mechanisms underlying GO-modulated anticancer effect, which may pave the road for development of nanomaterials for clinical applications in cancer treatment. Further investigation on the improvement of cancer cells’ cytotoxic effects and reduction of adverse effects to normal tissue could provide sufficient basis to pursue GO as a novel anticancer agent strategy against human OSA cancer.
Author contributions
ZT and LZ contributed equally. ZT, LZ, and HY conceived and designed the research. ZL, JG, BB, JL, and LZ performed the experiments and analyzed the data. ZT, LZ, JX, and ZY co-wrote the manuscript. All authors contributed toward data analysis, drafting and revising the paper and agree to be accountable for all aspects of the work. All authors discussed the results and commented on the manuscript.
Acknowledgments
This work was supported by the National Natural Science Foundation of China (Grants Nos 81673101 and 81703159), postdoctoral research funding plan in Jiangsu province (1601121C), and the Program of Suzhou Scientific and Technology (SYS201511). This work was also supported by Jiangsu Provincial Key Laboratory of Radiation Medicine and Protection and State Key Laboratory of Radiation Medicine and Protection.
Disclosure
The authors report no conflicts of interest in this work.
References
- MirabelloLTroisiRJSavageSAOsteosarcoma incidence and survival rates from 1973 to 2004: data from the Surveillance, Epidemiology, and End Results ProgramCancer200911571531154319197972
- IsakoffMSBielackSSMeltzerPGorlickROsteosarcoma: current treatment and a collaborative pathway to successJ Clin Oncol201533273029303526304877
- LearySEWozniakAWBillupsCASurvival of pediatric patients after relapsed osteosarcoma: the St. Jude Children’s Research Hospital experienceCancer2013119142645265323625626
- GurunathanSKimJHSynthesis, toxicity, biocompatibility, and biomedical applications of graphene and graphene-related materialsInt J Nanomedicine2016111927194527226713
- PengSFengPWuPGraphene oxide as an interface phase between polyetheretherketone and hydroxyapatite for tissue engineering scaffoldsSci Rep201774660428425470
- NejabatMCharbgooFRamezaniMGraphene as multifunctional delivery platform in cancer therapyJ Biomed Mater Res A201710582355236728371194
- SuXChanCShiJA graphene quantum dot@Fe3O4@SiO2 based nanoprobe for drug delivery sensing and dual-modal fluorescence and MRI imaging in cancer cellsBiosens Bioelectron20169248949527839733
- Rojas-AndradeMDChataGRouholimanDLiuJSaltikovCChenSAntibacterial mechanisms of graphene-based composite nanomaterialsNanoscale201793994100628054094
- ChaeMSKimJJeongDEnhancing surface functionality of reduced graphene oxide biosensors by oxygen plasma treatment for Alzheimer’s disease diagnosisBiosens Bioelectron20179261061727829557
- ChenYWSuYLHuSHChenSYFunctionalized graphene nanocomposites for enhancing photothermal therapy in tumor treatmentAdv Drug Deliv Rev2016105Pt B19020427262922
- WuJYangRZhangLFanZLiuSCytotoxicity effect of graphene oxide on human MDA-MB-231 cellsToxicol Mech Methods201525431231925996036
- ChoiYJKimEHanJKimJHGurunathanSA novel biomolecule-mediated reduction of graphene oxide: a multifunctional anti-cancer agentMolecules201621337526999102
- LoutfySASalaheldinTARamadanMAFarrohKHYAbdallahZFYoussefTSynthesis, characterization and cytotoxic evaluation of graphene oxide nanosheets: in vitro liver cancer modelAsian Pac J Cancer Prev201718495596128545193
- ZhaoLXuJJiaoYWangHFanSNovel mechanisms involving chemically modified tetracycline 3 cytotoxicityAnticancer Drugs201425101165117427163120
- MariEMardenteSMorganteEGraphene oxide nanoribbons induce autophagic vacuoles in neuroblastoma cell linesInt J Mol Sci20161712E199527916824
- ZhaoLXuJYangYInhibitory impacts of chemically modified tetracycline-3 and underlying mechanism in human cervical cancer cellsAnticancer Drugs201324879980923722439
- SinghAVenkannagariSOhKHSmall molecule inhibitor of NRF2 selectively intervenes therapeutic resistance in KEAP1-deficient NSCLC tumorsAcs Chem Biol201611113214322527552339
- WangYWuSZhaoXSuZDuLSuiAIn vitro toxicity evaluation of graphene oxide on human RPMI 8226 cellsBiomed Mater Eng20142462007201325226897
- RicciRLeiteNCSda-SilvaNSGraphene oxide nanoribbons as nanomaterial for bone regeneration: effects on cytotoxicity, gene expression and bactericidal effectMater Sci Eng C Mater Biol App201778341348
- De MarziLOttavianoLPerrozziFFlake size-dependent cyto and genotoxic evaluation of graphene oxide on in vitro A549, CaCo2 and vero cell linesJ Biol Regul Homeost Agents201428228128925001660
- GuZYangZWangLZhouHJimenez-CruzCAZhouRThe role of basic residues in the adsorption of blood proteins onto the graphene surfaceSci Rep201551087326034971
- ChongYGeCYangZReduced cytotoxicity of graphene nanosheets mediated by blood-protein coatingAcs Nano2015965713572426040772
- DuanGKangSGTianXProtein corona mitigates the cytotoxicity of graphene oxide by reducing its physical interaction with cell membraneNanoscale2015737152141522426315610
- LiQRJiaoJBLiLLGraphene oxide-enhanced cytoskeleton imaging and mitosis trackingChem Commun (Camb)201753233373337628265597
- DuanGZhangYLuanBGraphene-induced pore formation on cell membranesSci Rep201774276728218295
- WanBWangZXLvQYSingle-walled carbon nanotubes and graphene oxides induce autophagosome accumulation and lysosome impairment in primarily cultured murine peritoneal macrophagesToxicol Lett2013221211812723769962
- LiPNijhawanDWangXMitochondrial activation of apoptosisCell20041162 SupplS57S6115055583
- YanXYangWShaoZYangSLiuXTriggering of apoptosis in osteosarcoma cells by graphene/single-walled carbon nanotube hybrids via the ROS-mediated mitochondrial pathwayJ Biomed Mater Res A2016105244345327684494
- LiLLuoCSongZAssociation of anti-HER2 antibody with graphene oxide for curative treatment of osteosarcomaNanomedicine201814258159329170110
- EomHJChoiJOxidative stress of silica nanoparticles in human bronchial epithelial cell, Beas-2BToxicol In Vitro20092371326133219602432
- RautouPEMansouriALebrecDDurandFVallaDMoreauRAutophagy in liver diseasesJ Hepatol20105361123113420810185
- KlionskyDJEmrSDAutophagy as a regulated pathway of cellular degradationScience200029054971717172111099404
- KondoYKondoSAutophagy and cancer therapyAutophagy200622859016874083