
Abstract
Purpose
Taxanes are highly effective cytotoxic drugs for progressing breast cancer treatment. However, their poor solubility and high toxicity urge the development of innovative formulations of potential clinical relevance.
Materials and methods
By using a simple and straightforward aggregation method, we have generated paclitaxel (PTX) loaded in keratin nanoparticles (KER-NPs-PTX). Their activities were tested against human breast cancer MCF-7 and MDA MB 231 cell lines in conventional two-dimensional (2D) cultures and in a dynamic three-dimensional (3D) model with perfused bioreactor (p3D). Moreover, KER-NPs-PTX activity was compared to free PTX and to PTX loaded in albumin nanoparticles (HSA-NPs-PTX). Cell viability, induction of apoptosis, and gene expression analysis were used as readouts.
Results
In 2D cultures, KER-NPs-PTX was able to inhibit tumor cell viability and to induce apoptosis similarly to PTX and HSA-NPs-PTX. In the p3D model, a lower sensitivity of tumor cells to treatments was observed. Importantly, only KER-NPs-PTX was able to induce a statistically significant increase in apoptotic cell percentages following 24 h treatment for MCF-7 (16.7±4.0 early and 11.3±4.9 late apoptotic cells) and 48 h treatment for MDA MB 231 (21.3±11.2 early and 10.5±1.8 late apoptotic cells) cells. These effects were supported, at least for MCF-7 cells, by significant increases in the expression of proapoptotic BAX gene (5.8±0.5) 24 h after treatment and of cleaved caspase 3 (CC3) protein.
Conclusion
KER-NPs-PTX, generated by a simple procedure, is characterized by high water solubility and enhanced PTX-loading ability, as compared to HSA-NPs-PTX. Most importantly, it appears to be able to exert effective anticancer activities on breast cancer cells cultured in 2D or in p3D models.
Introduction
Although improvements in early diagnosis and adjuvant therapy have reduced mortality, breast cancer is still the main cause of cancer-related death in women.Citation1 Taxanes, such as Taxol® (paclitaxel, PTX), are among the most effective cytotoxic drugs for progressing breast cancer treatment.Citation2 However, their use is limited by toxicity, including hypersensitivity reactions and peripheral neuropathy,Citation3 their extremely poor water solubility (0.3 µg/mL) that requires the use of toxic solvents, eg, Cremophor EL/ethanol®, and the need of relatively high doses to provide therapeutic effects.Citation3,Citation4
Advanced drug delivery systems (DDSs), such as nanoparticles (NPs), may help overcoming pharmacokinetic and pharmacodynamic limitations of anticancer drugs.Citation4 Nanotechnology relates to the manipulation of materials at scale ranging from 1 to 100 nm and allows to obtain nanocar-riers with several specific features in terms of size, shape, and surface modifications, with great potential in many technological fields including cancer therapy.Citation5 NPs made of different materials, such as natural and synthetic polymers,Citation6,Citation7 silica, and gold,Citation8 have been extensively studied for improving cancer therapy in terms of selective accumulation and release of pharmacologically active agents at the pathological site, increasing therapeutic efficacy, and reducing the incidence and intensity of side effects in healthy tissues.Citation9 Among natural polymers, proteins have been proposed as nanocarriers to improve PTX therapeutic effectiveness and water solubility,Citation10,Citation11 due to their low toxicity, abundant availability, and biodegradability. Moreover, the ability of proteins to bind and coordinate water molecules could, in principle, prevent opsonization by the reticulo-endothelial system (RES), thus limiting undesired quick clearance of NPs loaded drugs. The high number of functional groups in protein constituent amino acids may also allow tailoring of their physicochemical properties and interaction with active substances and receptors expressed on cell membranes.Citation11 Importantly, biopolymers, such as albumin, globulins, and synthetic polymers, have been shown to markedly accumulate in tumor tissues because of enhanced vascular permeability and prolonged retention in tumor interstitium, due to the obstruction of lymphatic drainage.Citation12
Different formulations, including liposomes, NPs, emulsions, microspheres, micelles, and nanoshells, have been proposed to reduce PTX systemic toxicity and improve its selectivity. Human serum albumin (HSA) is especially attractive as it is highly water soluble, well distributed in the organism, and concentrating in tumor tissues.Citation12,Citation13 Indeed, Abraxane® is a novel PTX–albumin nanoformulation, the US Food and Drug Administration (FDA) approved for the treatment of metastatic breast cancer.Citation14 However, development of more effective techniques to improve PTX protein-based NPs, in terms of loading ratio, stability, and treatment selectivity, while avoiding the use of toxic components, is still urgently required.
Keratin is a most abundant nonfood protein and a major component of wool, feathers, hairs, horns, and nails.Citation15 As a cysteine-rich structural protein, with excellent biocompatibility and low toxicity to cells, it represents a promising material for NPs mediated drug delivery.Citation16 Importantly, specific tripeptidic sequences present on keratin backbone, such as “Arg–Gly–Asp” (RGD) and the “Leu–Asp–Val” (LDV) sequences, specifically bind integrin receptors overexpressed by several cancer cells.Citation17
Different preparation procedures have been proposed for keratin NPs (KER-NPs) synthesis.Citation18 For instance, doxorubicin KER-NPs have been prepared by grafting the protein with polyethylene glycol chains to improve its amphiphilic propertiesCitation19 or by desolvation from ethanol (EtOH).Citation20
Rutin-quercetin dual-loaded KER-NPs were synthesized starting from a poorly water-soluble protein, requiring high amounts of emulsifying agents, eg, sodium dodecyl sulfate (SDS) and Twin-80.Citation21
Most of the preparation procedures of KER-NPs reported so far require tedious purification steps, eg, dialysis and ultrafiltration, to obtain pure and mono-disperse NPs loaded with lipophilic drugs.
Here, we have addressed the synthesis of PTX loaded in KER-NPs (KER-NPs-PTX) from a highly hydro-soluble protein powder, through a drug-mediated in-water aggregation process, allowing quantitative formation of stable NPs with PTX loading ratios up to sevenfold higher, as compared to those obtained with albumin, eg, 42.3 vs 6.5%, respectively.Citation22
Screening of novel antitumor compounds is currently based on the assessment of their cytotoxic potential on human cancer cell lines cultured in high-throughput formats. However, tissue-specific architectures, mechanical and biochemical cues, and cell–cell interaction are lost in conventional two-dimensional (2D) cultures.Citation23 While complexity of living tissue is impractical or impossible to fully recreate in vitro, relatively simple three-dimensional (3D) tumor platforms may provide significant advantages over 2D modelsCitation24 and culture in 2D or 3D systems differentially affects the sensitivity of tumor cells to anticancer compounds.Citation25 Limitations of 3D techniques include uncontrolled diffusion of oxygen and nutrients inside newly formed structures and inefficient delivery of chemical compounds in innermost cells, potentially affecting drug response.Citation25–Citation27 3D structures are typically generated by the association of cells with porous scaffolds, in static models. Recently, however, bioreactors, applying direct perfusion to control flow-induced shear stress and local oxygen distributions within 3D constructs, were shown to provide uniform cell distribution,Citation28 allowing the development and maintenance of viable relatively large tissue-like structures for prolonged culture times.Citation28,Citation29 These systems have widely been utilized for tissue engineering,Citation29 but their potential for in vitro tumor tissue formation and drug screening has not been thoroughly explored.
We have investigated the anticancer activity of KER-NPs-PTX on established human breast cancer cell lines in conventional 2D cultures and in a 3D model with perfused bioreactor (p3D), using free PTX and PTX loaded in albumin NPs (HSA-NPs-PTX) as controls.
Materials and methods
Materials
All chemicals were obtained from Sigma-Aldrich, Co. (St Louis, MO, USA) unless otherwise stated. PTX was purchased from TCI Chemicals Europe (Zwijndrecht, Belgium). Recombinant HSA was purchased from Sigma-Aldrich, Co., and HSA-NPs-PTX were prepared as previously described by Chen et al.Citation22 A detailed description of HSA-NPs-PTX synthesis and characterization procedures used in the present work is provided in the Supplementary materials ( and and ).
Preparation of (KER-NPs-PTX)
Keratin was extracted from Australian Merino wool (21 µm fineness) (Cariaggi Fine Yarns, Spa, Smirra di Cagli, Italy) by sulphitolysis reaction, as previously reported.Citation15 Keratin powder was then dissolved in phosphate buffered saline (PBS) at different concentrations ranging from 1 to 3 mg/mL (). Keratin solution was sonicated and filtered (0.45 µm cutoff) to remove possible aggregates. Different amounts of PTX in EtOH (10 mg/mL) were then slowly added to the keratin solution under vigorous magnetic stirring (700 rpm). summarizes percentages of PTX in weight added to keratin solutions. Forty-five minutes after PTX addition, NPs were formed and analyzed by dynamic light scattering (DLS), using a NanoBrook Omni Particle Size Analyzer (Brookhaven Instruments Corporation, Holtsville, USA), equipped with a 35 mW red diode laser (nominal 640 nm wavelength), and lyophilized to provide pure NPs’ powder.
Table 1 Keratin–PTX ratio for nanoparticles’ synthesis
The stability of KER-NPs-PTX in physiological conditions was determined by dissolving 500 µg of KER-NPs loaded with 16.6% (wt) of PTX in 2 mL of PBS and maintaining them at 37°C. NPs’ size during time was controlled by DLS measurements (see later).
NPs’ characterization
NPs’ hydrodynamic diameter in aqueous solutions (0.2 mg/mL) was determined by DLS. Electrophoretic mobility zeta-potential was similarly measured at 25°C. Samples at 1 mg/mL concentration were negatively stained with 1% uranyl acetate and lead citrate. Electron micrographs were taken using the JEOL JEM-1011 transmission electron microscope (TEM) (JEOL, Tokyo, Japan) at 80 kV accelerating voltage, and micrographs were scanned at 600 dpi.
NPs’ stability was measured under different physiological conditions. In particular, 500 µg of KER-NPs loaded with 16.6% (wt) of PTX was dissolved in 2 mL of a fetal bovine serum (FBS)/H2O mixed solution (1/1) or in PBS and maintained at 37°C. NPs’ size during time was controlled by DLS measurements.
Effective PTX loading on KER-NPs was determined through fluorescence experiments. Briefly, KER-NPs-PXT fluorescence emission spectra were recorded at room temperature (RT) on a LS50 spectrometer, using a square quartz cuvette of 10 mm path length. All measurements were performed at the excitation wavelength of 277 nm and the spectral band widths of 10 nm. Fluorescence spectra were determined in phosphate buffer (pH 7.2) at fixed protein concentration (2 mg/mL) and varying PTX loading ratios, eg, 0, 5, 10, and 20% (w/w).
PTX release from NPs
To determine PTX release profiles, 1 mL of aliquots of KER-NPs-PTX suspension (1 mg/mL) containing 20% PTX were placed into dialysis bags (cutoff 12–14 kDa) and immersed, under shaking, in 6 mL of a PBS solution (pH 7.4) containing 10% EtOH at 37°C. Outer solution was periodically sampled and replaced with fresh medium, and drug concentration was determined by UV–Vis spectrophotometry (λ=240 nm) (Cary 100; Agilent Technologies, Santa Clara, CA, USA).
Cell cultures
Human breast cancer MCF-7 and MDA MB 231 cell lines were purchased from American Type Culture Collection (ATCC, Manassas, VA, USA). MCF-7 cells were cultured in RPMI-1640 medium, and MDA MB 231 cells were cultured in Mc Coy 5A medium. Media were supplemented with 10% FBS, 1% GlutaMAX-I, 1% 4-(2-hydroxyethyl)-1-piperazineethanesulfonic acid (HEPES), and 100 µg/mL of streptomycin (Thermo Fisher Scientific, Waltham, MA, USA). All cell lines were maintained in humidified 5% CO2 atmosphere at 37°C.
For standard 2D cell cultures, we used 75 cm2 culture flasks or six-well tissue chamber slides (TPP, Trasadingen, Switzerland). For p3D cultures, we used a commercially available (CELLEC Biotek AG, Basel, Switzerland) perfused bioreactor system, as previously described.Citation26 Briefly, the collagen scaffolds (Ultrafoam, Avitene; Davol Inc., Warwick, RI, USA) of 8 mm diameter and 2 mm thickness were coated overnight at 37°C in rotation with a PBS solution containing 10 µg/mL fibronectin from bovine plasma. Each scaffold was installed in a bioreactor, and 2×10⁶ MCF-7 or MDA MB 231 cells were then seeded and perfused overnight at 400 µm/s superficial velocity. After a 24 h cell seeding phase, superficial velocity was reduced to 100 µm/s.Citation26
In vitro activity of PTX delivery
Effects of PTX, HSA-NPs-PTX, or KER-NPs-PTX on MCF-7 and MDA MB 231 cells’ growth in the 2D model were evaluated by acid phosphatase assay (APH) kit. Briefly, 4.0×10³ MCF-7 and 5.0×10³ MDA MB 231 cells were seeded in 200 µL of medium in replicates (n=4) in 48-well culture plates (TPP). After 48 h culture, media were removed and cells were incubated with experimental media containing PTX at different concentrations (0.00002, 0.02, and 5 µg/mL) in a free form or loaded on HSA-NPs or KER-NPs. Seventy-two hours later, APH assays were performed according to manufacturer’s instructions. Well absorbance was measured at 405 nm using a Synergy H1 Multi-Mode Reader (BioTek Instruments, Luzern, Switzerland).
Flow cytometry
Cell death was evaluated using the allophycocyanin (APC)-Annexin V and propidium iodide (PI) Apoptosis Detection Kit (BD, Eysins, Switzerland). Briefly, 1.0×10⁵ MCF-7 and MDA MB 231 cells cultured in 2D were treated with PTX in a free form (5 µg/mL) or HSA-NPs-PTX or KER-NPs-PTX concentrations equivalent to a PTX concentration of 5 µg/mL (55 µg/mL for HSA-NPs and 10 µg/mL for KER-NPs) for 24 and 48 h. Cells were then washed twice with 1× Annexin-binding buffer and stained with APC-Annexin V and PI. Samples were acquired by using a C6 flow cytometer (Accuri Cytometers, Milan, Italy), and the analysis was performed using the FlowJo software (Tree Star, Ashland, OR, USA). Cell debris was excluded from analysis based on forward scatter (FSC) and side scatter (SSC) parameters.
For p3D experiments, 2×10⁶ MCF-7 and MDA MB 231 cells were precultured for 7 and 4 days, respectively, and then treated with PTX in a free form, HSA-NPs-PTX, or KER-NPs-PTX ([PTX] at the same drug concentration [5 µg/mL] used for 2D cultures) for 48 h. Entire scaffolds then underwent collagenase IV (Worthington Biochemical Corporation, Lakewood, NJ, USA) treatment at 37°C for 40 min, and apoptosis in the cell suspensions was evaluated by APC-Annexin V and PI Apoptosis Detection Kit.
Histological and immunofluorescence analyses
Cell line-derived tissue-like constructs were generated using 2×10⁶ MCF-7 and MDA MB 231 cells precultured for 7 and 4 days, respectively, in p3D conditions and then treated with PTX in a free form, HSA-NPs-PTX, or KER-NPs-PTX ([PTX] at the same drug concentration [5 µg/mL]) for 48 h. At the end of treatment, tissue constructs were washed in PBS, embedded in Tissue-Tek® OCT Compound (Sakura Finetek, Staufen, Germany) and preserved at −20°C prior to cryosection. OCT scaffold cryosections (10 µm) were stained with hematoxylin and eosin (H&E) (JT Baker, Center Valley, PA, USA), according to standard protocols, and analyzed by light microscopy. For immunofluorescence staining, cryosections (10 µm) were fixed with formalin 4% for 15 min at RT, blocked with 2% goat serum diluted in PBS containing 0.3% Triton X-100 for 1 h at RT, and incubated with rabbit monoclonal anti-cleaved caspase 3 (CC3) primary antibody (1:200; Cell Signaling Technology, Danvers, MA, USA) for 1 h at RT. Slides were then washed with PBS and incubated 1 h at RT with goat antirabbit Alexa Fluor 546-conjugated secondary antibody (1:800; Thermo Fisher Scientific). During the last 10 min of incubation 4′,6-diamidino-2-phenylindole (DAPI; 1:100; Thermo Fisher Scientific) was added. Sections were analyzed by fluorescence microscopy (BX63; Olympus Schweiz AG, Volketswil, Switzerland), and images were captured with 10× magnification using a F-VIEW II camera (Olympus Corporation) and the AnalySIS software (Soft Imaging System GmbH, Olympus Schweiz AG).
Quantitative real-time polymerase chain reaction (qRT-PCR)
Total RNA was extracted from cultured MCF-7 and MDA MB 231 cells at 6 and 12 h in 2D and at 24 h and 48 h in p3D cultures following PTX, HSA-NPS-PTX, or KER-NPs-PTX ([PTX] treatment at the same drug concentration [5 µg/mL]), by using NucleoSpin RNA II kit (Macherey-Nagel, Oensingen, Switzerland). qRT-PCR analyses were carried out using 300 ng of total RNA, which was reverse transcribed in 20 µL of cDNA reactions using the M-MLV reverse transcriptase (Thermo Fisher Scientific), following manufacturer’s protocol. qRT-PCR was performed using the ABI Prism 7300 (Thermo Fisher Scientific) equipment and commercially available primers and probes specific for human BAX (Hs00180269_m1) and human BCL-2 (Hs00608023_m1) from Thermo Fisher Scientific. Gene expression was normalized by using human glyceraldehyde-3-phosphate dehydrogenase (GAPDH) house-keeping gene as reference.Citation30 All runs were performed with at least three independent cDNA preparations per sample and all samples were run in duplicate. At least two nontemplate controls were included in all PCR runs.
Statistical analysis
Data are presented as mean ± SD. Statistical comparisons between groups were performed by one or two-way analysis of variance (ANOVA) followed by Bonferroni multiple comparisons, using the GraphPad Prism software Version 6.00 (GraphPad Software, Inc., La Jolla, CA, USA; www.graphpad.com). In all cases, P-values <0.05 were considered statistically significant.
Results
Synthesis, characterization, and drug release of KER-NPs-PTX
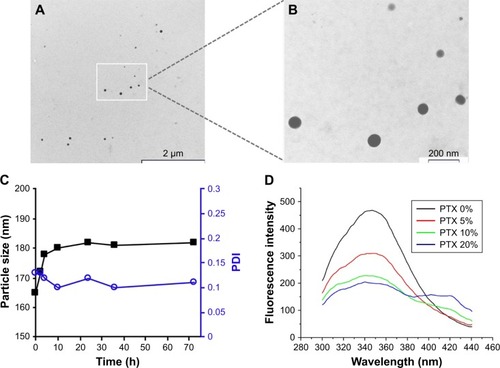
Pure keratin powder, extracted from Merino wool, was used for the synthesis of KER-NPs-PTX through aggregation (). This preparation method exploits the ability of PTX to induce the aggregation of keratin into NPs, whose dimensions and polydispersity index depend on PTX loading. In particular, with PTX final concentrations into NPs ranging from 5% to 23% (wt), NPs’ hydrodynamic diameter rapidly increased from 109 to 136 nm (); meanwhile the solution changed from clear to whitish (box in ). A further, slower, diameter increase up to 165 nm was observed when PTX concentration reached 43% (). Additional data on hydrodynamic diameters and zeta potential are reported in and . Instead, polydispersity index was almost stable at 0.11, with increasing PTX loading. Notably, due to specific protein features and aggregating properties of PTX, NPs did not require any chemical stabilization or additional purification processes, eg, centrifugation, ultrafiltration, and dialysis. Thus, it may be assumed that both NPs’ yield and loading are quantitative. TEM analysis of KER-NPs-PTX shows that particles are spherical in shape and possess a smooth surface morphology ( and ). Stability studies performed in FBS/H2O () and in PBS () at 37°C indicated that while a slight increase in NPs diameter occurred within the first 10 h, no significant changes in polydispersity index were detectable, consistent with a satisfactory stability index of KER-NPs in simulated physiological conditions. Moreover, fluorescence experiments confirmed that PTX was successfully loaded onto particles (); indeed, by increasing the PTX amount, a constant decrease in the keratin tryptophan signal was observed (354 nm) due to the hydrophobic interaction with PTX.Citation31 At the same time, an increase in the shoulder ~420 nm with increasing drug concentrations could be attributed to higher PTX fluorescence emission.Citation32
Figure 1 KER-NPs-PTX preparation.
Notes: (A) KER-NPs-PTX preparation by aggregation method, starting from a solution of pure keratin powder. (B) Correlation between PTX loading and KER-NPs-PTX size.
Abbreviations: KER-NPs-PTX, PTX loaded in keratin nanoparticles; PDI, polydispersity index; PTX, paclitaxel; RT, room temperature.
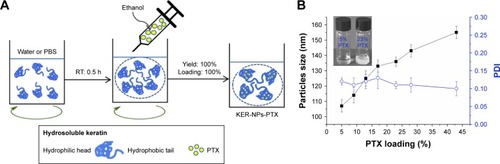
Figure 2 KER-NPs-PTX analysis.
Notes: Transmission electron microscopy images of fixed KER-NPs-PTX at two magnifications: scale bar 2 µm (A) and scale bar 200 nm (B). Morphological analysis showed particles spherical in shape, smooth surface, and an average dry diameter of ~80 nm. Stability of KER-NPs-PTX in physiological conditions (C). Fluorescence spectra of KER-NPs-PTX at different PTX loading percentages (D).
Abbreviations: KER-NPs-PTX, PTX loaded in keratin nanoparticles; PDI, polydispersity index; PTX, paclitaxel.
PTX release from KER-NPs
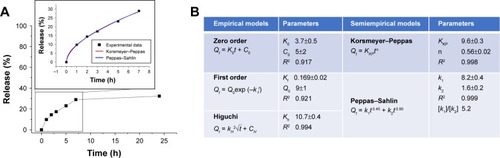
Profiles of PTX release from NPs in vitro are shown in . KER-NPs-PTX displayed a biphasic release trend, including an initial burst during the first 3 h, followed by a more sustained release in the following 24 h. Cumulative release during the first 24 h was ~32%, suggesting that KER-NPs-PTX could warrant prolonged effectiveness under physiological conditions. To clarify mechanisms of PTX release from NPs, data were fitted using zero-order, first-order, and Higuchi kinetic models. Correlation coefficient values (R2) were used to determine best fitting model (). A high R2 value (0.994) was obtained for the Higuchi model, thereby indicating that PTX release is controlled by diffusion mechanisms. Korsmeyer–Peppas and Peppas–Sahlin, semiempirical models, used to determine the diffusion type, also showed () excellent fitting (R2>0.998) with experimental data. Moreover, n value from the Korsmeyer–Peppas model fell between 0.45 and 1, indicating that PTX release mechanism may be considered as an anomalous diffusion resulting from a combination of diffusion and matrix swelling. The Peppas–Sahlin model allows determining k1 and k2, which are the Fickian kinetic constant and the matrix swelling kinetic constant, respectively. If the ratio of k1/k2 is >1, the drug release is determined mainly by diffusion; while if the ratio of k1/k2 is <1, the drug release is determined mainly by the matrix swelling. In particular, KER-NPs-PTX showed a k1/k2 of >1 (), indicating that the release mechanism was mainly controlled by Fickian diffusion.
Figure 3 Profiles and mechanisms of PTX release from KER-NPs in vitro.
Notes: Profile of PTX release from KER-NPs (A). Correlation coefficient values (R2) used to determine the best fitting model among zero-order, first-order, and Higuchi modes (B).
Abbreviations: KER-NPs, keratin nanoparticles; PTX, paclitaxel.
Effect of PTX delivery on cell viability in 2D model
Initial studies showed that nude KER-NPs did not induce per se any cytotoxicity in the cell lines under investigation, thereby qualifying as safe drug carriers for therapeutic applications (). We then evaluated anticancer activity of PTX loaded on KER-NPs and compared it with that of PTX in a free form or loaded on HSA-NPs. Our data show that KER-NPs-PTX was able to efficiently deliver PTX to MCF-7 and MDA MB 231 cells, as indicated by the inhibition of their proliferative potential ().
Figure 4 Antiproliferative activity of PTX in a free form, HSA-NPs-PTX, and KER-NPs-PTX on MCF-7 and MDA MB 231 cell lines in 2D model.
Notes: Cell viability was evaluated 72 h after exposure to increasing concentrations of PTX (0.00002, 0.02, and 5 µg/mL) by APH assay. Statistical significance versus untreated cells (100%, represented by a dotted line): **P<0.01 and ***P<0.001. Statistical significance of data related to cells treated with KER-NPs-PTX versus cells treated with HSA-NPs-PTX: °P<0.05 and °°P<0.01.
Abbreviations: APH, acid phosphatase; 2D, two-dimensional; HSA-NPs-PTX, PTX loaded in albumin nanoparticles; KER-NPs-PTX, PTX loaded in keratin nanoparticles; PTX, paclitaxel.
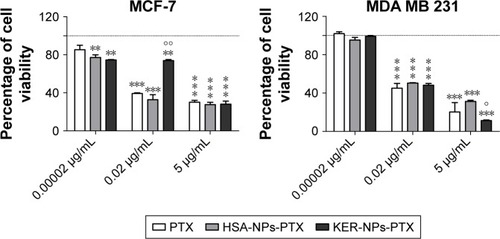
In particular, in MCF-7 cells, a similar effect was observed on cell growth induced by the three formulations at the highest drug concentration, ie, 5 µg/mL, upon 72 h treatment. Interestingly, in MDA MB 231 cells, KER-NPs-PTX at the highest concentration, ie, 5 µg/mL, induced a significant reduction in cell growth (P<0.001) (11.3±1) as compared to HSA-NPs-PTX formulation (31.3±1.8). However, at 0.02 µg/mL, KER-NPs-PTX appeared to be less effective (74.0±1.4) than control preparations (32.8±7.4 for HSA-NPs-PTX and 39.3±1.0 for PTX) in inhibiting MCF-7 viability.
Effects of PTX delivery on cell death in 2D model
Features of cell death induced by KER-NPs-PTX in MCF-7 and MDA MB 231 cells were then analyzed in detail following 24 and 48 h treatment in “conventional” 2D cultures (). Significant increases in percentages of late apoptotic cells were observed in MCF-7 48 h after KER-NPs-PTX (31.1±5.4) and PTX (28.6±5.1) treatments (P<0.001) or after HSA-NPs-PTX treatment (P<0.001) (24.5±6.4). In MDA MB 231 cells, a significant increase in percentages of early apoptotic cells was observed already after 24 h treatment with KER-NPs-PTX (25.9±2.5) (P<0.01), further increasing after 48 h (35.3±7.8) (P<0.001), and comparable to that induced by free PTX (27.1±2.4 and 39.4±6.9 at 24 and 48 h, respectively).
Figure 5 Induction of apoptosis in tumor cells cultured in 2D by PTX in a free form, HSA-NPs-PTX, or KER-NPs-PTX in 2D model.
Notes: MCF-7 and MDA MB 231 cells were exposed to PTX, HSA-NPs-PTX, and KER-NPs-PTX (PTX, 5 µg/mL) for 24 and 48 h. Apoptosis assays were carried out by flow cytometry, following APC-Annexin V and PI staining. Representative dot plots of MCF-7 (A) and MDA MB 231 (B) cell lines after each treatment. Percentage of early apoptotic cells (positive to APC-Annexin V and negative to PI) and late apoptotic cells (positive to APC-Annexin V and PI) was evaluated 24 and 48 h after treatment (C). Statistical significance versus untreated cells: *P<0.05, **P<0.01, and ***P<0.001. Statistical significance of data related to cells treated with KER-NPs-PTX versus cells treated with HSA-NPs-PTX: °°P<0.01.
Abbreviations: 2D, two-dimensional; HSA-NPs-PTX, PTX loaded in albumin nanoparticles; KER-NPs-PTX, PTX loaded in keratin nanoparticles; PI, propidium iodide; PTX, paclitaxel.
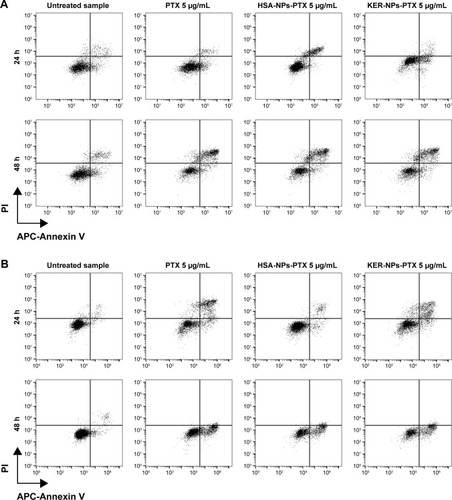
Notably, HSA-NPs-PTX was able to induce a significant increase in percentages of early (31.4±2.0) (P<0.001) and late (13.8±0.7) (P<0.01) apoptotic cells only upon 48 h treatment, thus confirming that MDA MB 231 cells have a different sensitivity toward PTX as compared to MCF7 cells and indicating that KER-NPs-PTX may be more effective in inducing early cell death upon 24 h treatment.
Effects of PTX delivery on gene expression in 2D model
Since PTX is able to induce apoptosis,Citation33–Citation35 the expression levels of proapoptotic BAX and antiapoptotic BCL-2 genes upon 12 h KER-NPs-PTX treatment were analyzed in comparison with those induced by free PTX and HSA-NPs-PTX (). Indeed, KER-NPs-PTX was able to induce increased BAX gene expression in MCF-7 (2.8±0.7), although a concomitant increase in BCL-2 gene expression was also detected (2.4±1.0). In contrast, we observed a significant increase in BAX gene expression in MDA MB 231 cells upon 12 h KER-NPs-PTX treatment (2.7±0.2) (P<0.05), whereas BCL-2 gene expression was not modified (1.3±0.4). These data are consistent with a relatively higher sensitivity of this cell line to PTX-loaded KER-NPs.
Figure 6 BAX and BCL-2 gene expression analyses in MCF-7 and MDA MB 231 cells cultured in 2D model upon 12 h treatment.
Notes: Cells were incubated for 12 h with PTX in a free form, HSA-NPs-PTX, or KER-NPs-PTX (PTX, 5 µg/mL). GAPDH was used as reference gene to normalize data. Effects of each treatment on gene expression levels were compared with those detectable in untreated cells (n=1) as indicated by the dotted line. Statistically significant difference versus untreated cells: *P<0.05.
Abbreviations: 2D, two-dimensional; GAPDH, glyceraldehyde-3-phosphate dehydrogenase; HSA-NPs-PTX, PTX loaded in albumin nanoparticles; KER-NPs-PTX, PTX loaded in keratin nanoparticles; PTX, paclitaxel.
Histological analysis of MCF-7 and MDA MB 231 scaffold sections
3D culture systems have been suggested to mirror in vivo tumor growth and to predict clinical success or failure of specific drugs more reliably than conventional 2D cultures.Citation36 Therefore, we seeded MCF-7 and MDA MB 231 cells onto 3D porous collagen scaffolds located in perfused bioreactor chambers and we subsequently evaluated the anticancer activity of the compounds under investigation. Collagen scaffolds were previously coated with fibronectin in order to increase cellular adhesion.Citation37 As previously described,Citation26 in perfused bioreactor chambers, cell suspensions and culture media flow directly through the pores of 3D scaffolds, resulting in efficient and uniform cell distribution. MCF-7 cells were cultured in a p3D model for 7 days and MDA MB 231 cells for 4 days. Cultures were then treated with KER-NPs-PTX at the highest drug concentration ([PTX] =5 µg/mL) already used for 2D experiments, as compared with the same drug concentrations as free PTX or HSA-NPs-PTX.
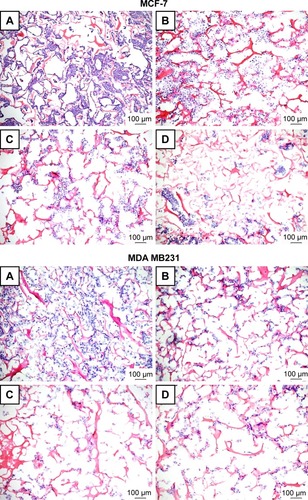
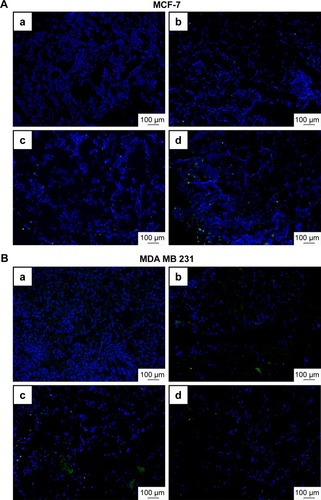
As shown in , histological characterization of MCF-7 and MDA MB 231 cells cultured in 3D showed that, similarly to free PTX and HSA-NPs-PTX, KER-NPs-PTX induced a complete disorganization of cellular structures. Notably, no major differences between the three formulations were observed.
Figure 7 Representative H&E staining of scaffold sections from p3D MCF-7 and MDA MB 231 cultures after treatments.
Notes: MCF-7 (upper panels) and MDA MB 231 (lower panels) cells were initially cultured for 7 and 4 days, respectively, and then left untreated (A) or treated for 48 h with PTX in a free form (B), HSA-NPs-PTX (C), and KER-NPs-PTX (D) (PTX, 5 µg/mL). Scale bar: 100 µm.
Abbreviations: H&E, hematoxylin and eosin; HSA-NPs-PTX, PTX loaded in albumin nanoparticles; KER-NPs-PTX, PTX loaded in keratin nanoparticles; p3D, three-dimensional model with perfused bioreactor; PTX, paclitaxel.
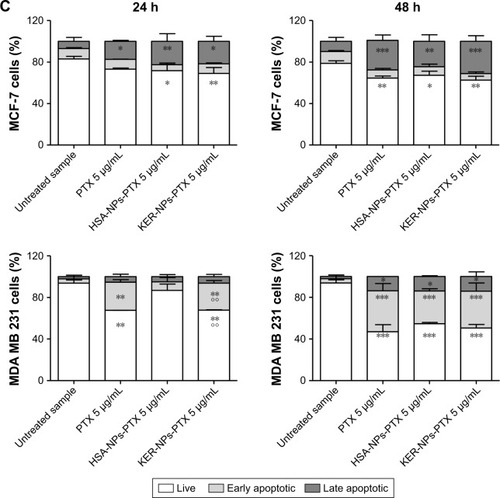
Effects of PTX delivery on cell death in p3D models
Induction of apoptosis by KER-NPs-PTX treatment in p3D MCF-7 and MDA MB 231 cultures were investigated by cytofluorimetric analysis of cell death () and immunofluorescence staining of CC3 (), an executioner molecule involved in the cell death pathway.Citation38 Remarkably, only KER-NPs-PTX treatment for 24 or 48 h induced a significant reduction in percentages of live cells (P<0.05) (74.0±8.9 at 24 h and 69.0±6.5) accompanied by a significant increase in early apoptotic cells after 48 h (P<0.05) in MCF-7 cells (19.0±4.7) cultured in p3D conditions (). Accordingly, increased CC3 expression was observed 48 h after KER-NPs-PTX treatment (). Importantly, effects of HSA-NPs-PTX failed to reach significance thresholds in terms of apoptotic events and CC3 expression was barely detectable ( and ).
Figure 8 Effects of PTX in a free form or vehiculated by HSA-NPs or by KER-NPs on cell death in p3D cultures.
Notes: MCF-7 and MDA MB 231 cells were exposed to PTX in a free form, HSA-NPs-PTX, and KER-NPs-PTX (PTX, 5 µg/mL) for 24 and 48 h. Apoptosis assays were carried out by flow cytometry, following APC-Annexin V and PI staining. Representative dot plots of MCF-7 (A) and MDA MB 231 (B) cell lines after each treatment. Percentages of early apoptotic cells (positive to APC-Annexin V and negative to PI) and late apoptotic cells (positive to APC-Annexin V and PI) were evaluated 24 and 48 h after treatment (C). Statistical significance versus untreated cells: *P<0.05.
Abbreviations: HSA-NPs, albumin nanoparticles; HSA-NPs-PTX, PTX loaded in HSA-NPs; KER-NPs, keratin nanoparticles; KER-NPs-PTX, PTX loaded in KER-NPs; p3D, three-dimensional model with perfused bioreactor; PI, propidium iodide; PTX, paclitaxel.
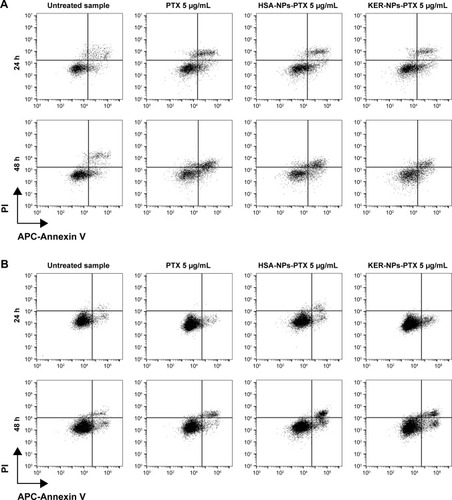
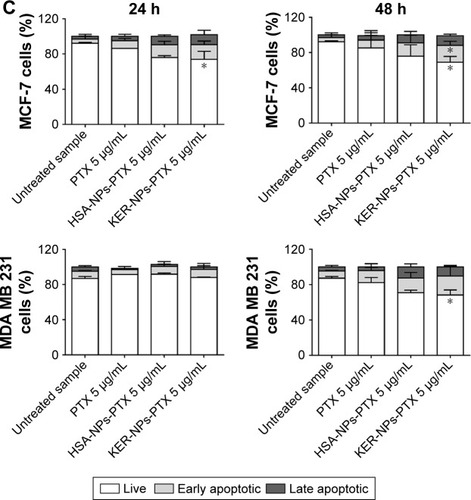
Figure 9 Immunofluorescence staining of CC3 in MCF-7 (upper panels) and MDA MB 231 (lower panels) scaffold sections.
Notes: Images show DAPI (blue) and CC3 (green) staining in MCF-7 (A) and MDA MB 231 (B) p3D scaffold sections upon treatment with PTX in a free form (b), HSA-NPs-PTX (c), and KER-NPs-PTX (d) (PTX, 5 µg/mL) for 48 h or untreated (a). Scale bar: 100 µm.
Abbreviations: CC3, cleaved caspase 3; DAPI, 4′,6-diamidino-2-phenylindole; HSA-NPs-PTX, PTX loaded in albumin nanoparticles; KER-NPs-PTX, PTX loaded in keratin nanoparticles; p3D, three-dimensional model with perfused bioreactor; PTX, paclitaxel.
Moreover, we observed a significant (P<0.05) reduction in percentages of live MDA MB 231 cells only upon 48 h KER-NPs-PTX treatment (68.2±5.7), while the effects of the other two formulations did not reach significant thresholds (). However, immunofluorescence staining of scaffold sections with anti-CC3 did not reveal significant differences between cultures treated for 48 h with all three formulations ().
Effects of PTX delivery on gene expression in p3D models
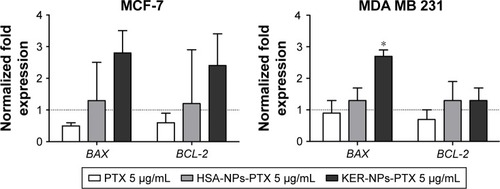
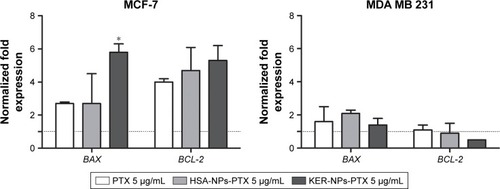
Effects of PTX delivered as KER-NPs to MCF-7 and MDA MB 231 cells cultured in p3D cultures were also explored by BAX and BCL-2 gene expression analyses following 24 h treatments (). A significant increase in BAX gene expression (P<0.05), as compared to PTX (2.7±0.1) and HSA-NPs-PTX (2.7±1.8), was only observed in MCF-7 cells following 24 h KER-NPs-PTX treatment (5.8±0.5) ([PTX] =5 µg/mL) (). In contrast, in MDA MB 231 p3D cultures, we did not observe any modification of BAX and BCL-2 gene expressions as compared to untreated conditions, irrespective of treatment.
Figure 10 BAX and BCL-2 gene expression analyses in MCF-7 and MDA MB 231 cells in p3D cultures following 24 h treatments.
Notes: Cells were incubated for 24 h with PTX in a free form, HSA-NPs-PTX, or KER-NPs-PTX (PTX, 5 µg/mL). GAPDH was used as reference gene to normalize data. The effects of each treatment were compared with gene expression detectable in untreated cells (=1) as indicated by the dotted line. Statistically significant difference versus untreated cells: *P<0.05.
Abbreviations: GAPDH, glyceraldehyde-3-phosphate dehydrogenase; HSA-NPs-PTX, PTX loaded in albumin nanoparticles; KER-NPs-PTX, PTX loaded in keratin nanoparticles; p3D, three-dimensional model with perfused bioreactor; PTX, paclitaxel.
Discussion
PTX is one of the most widely used anticancer agents with broad activity against malignancies of different histological origins, ranging from sarcomas to carcinomas and melanoma, and finds its major target in breast cancer. However, PTX suffers from almost complete aqueous insolubility and is associated with a variety of systemic side effects, including hypersensitivity, neutropenia, neurotoxic effects, and hypotension.Citation3,Citation4 To decrease systemic side effects while preserving or increasing its antitumor potential, several nanotechnology-based delivery systems have been engineered.
Albumin-based NPs, HSA-NPs-PTX, represent a significant milestone in this area. Albumin is a natural carrier of hydrophobic molecules, with favorable, noncovalent binding characteristics. Moreover, interaction between albumin and albumin-binding protein, secreted protein, acidic, and rich in cysteine (SPARC), appears to play a pivotal role in the preferential anchoring of HSA-NPs-PTX to tumor stroma.Citation13 In 2005, FDA approved Abraxane®, a PTX-albumin-based NPs formulation with the particle size of ~130 nm, for the treatment of metastatic breast cancer.Citation39
Although HSA-NPs-PTX formulation represents an important improvement for patients’ treatment and compliance, Abraxane® is characterized by rapid elimination of PTX from blood circulation and does not ameliorate PTX pharmacokinetics. Moreover, HSA-NPs-PTX are obtained by utilizing a mechanical procedure,Citation40,Citation41 independent from natural characteristics of albumin, and generating NPs stable in undiluted formulation but rapidly dissolving upon intravenous infusion, thus resulting in the generation of soluble albumin-bound PTX complexes with the size of single albumin units.
Aggregation method has also been investigated for the synthesis of HSA-PTX-NPs. However, this procedure provides low PTX loading ratio (up to 6%) and requires tedious purification postprocedures.Citation22 To ensure higher drug loading (up to 28%), additional methodologies have been proposed, envisaging a prereduction of the protein with β-mercaptoethanol followed by the dialysis of NPs to remove excess toxic reducing agent.Citation42
Our investigations on keratin as novel biopolymer for drug delivery have revealed that this high molecular weight hydrosoluble protein possesses an extraordinary ability to stably incorporate lipophilic compounds with high loading ratios. Thus, we report herein the preparation of keratin-based NPs loaded with PTX and their in vitro anticancer activity in 2D and p3D breast cancer models, as compared with free PTX or HAS-NPs-PTX. KER-NPs-PTX was efficiently obtained through a straightforward and quantitative aggregation procedure, starting from pure keratin water solutions and PTX, by exploiting the exceptional drug–protein affinity. Depending on initial keratin solution concentration and on amounts of added PTX, it was possible to fine-tune PTX-loading ratios, while providing monodisperse KER-NPs with hydrodynamic diameters ranging from 125 to 165 nm. KER-NPs-PTX stability studies performed in FBS/H2O and PBS at 37°C account for a high stability of these NPs, whose drug delivery rate follows a Fickian diffusion mechanism, ensuring a steady and controlled PTX release over time. From a technological view point, this study represents the first report of the synthesis of stable KER-NPs able to load a highly lipophilic drug, ie, PTX, in quantitative yields without requiring further purification processes. This unpredicted behavior relies on specific features of keratin, whose structural and chemical characteristics make it highly water soluble, while preserving hydrophobic pockets effectively allowing in-water incorporation of lipophilic drug such as PTX.
Development of this innovative carrier raises the issue of the biological activity of its payload. Therefore, we evaluated the anticancer potential of KER-NPs-PTX, as compared with free drug and HSA-NPs-PTX. Our results, based on functional, phenotypic, and gene expression analyses, clearly indicate that PTX loaded into KER-NPs is at least as effective as HSA-NPs-PTX or in a free form. Most interestingly, however, a potentially superior antitumor activity may be suggested by specific assays.
In standard 2D cultures, treatment of the cell lines under investigation for 72 h with KER-NPs-PTX and control compounds induced a significant antiproliferative activity. However, a significantly higher effect on MDA MB 231 cell viability was observed upon treatment with KER-NPs-PTX at the highest PTX concentration (5 µg/mL). Consistent with these data, we observed that KER-NPs-PTX was able to induce significant increases in early (25.9±2.5) and late (6.2±2.1) apoptotic MDA MB 231 cells already 24 h after treatment with a gradual increase up to 48 h (35.3±7.9 early and 14.0±4.5 late apoptotic cells, respectively). Interestingly, HSA-NPs-PTX at the same PTX concentration induced a significant increase in cell death only upon 48 h treatment of the same cell line (31.4±2.0 early and 13.8±0.7 late apoptotic cells for HSA-NPs-PTX and 39.4±6.7 early and 13.6±0.1 for PTX treatments, respectively).
From a gene expression point of view, we observed that PTX induced a downregulation of BAX and BCL-2 gene expressions as compared to HSA-NPs-PTX and KER-NPs-PTX 12 h after treatment in both cell lines. However, we also performed the BAX and BCL-2 gene expression analyses 6 h after treatments (data not shown), observing that BAX is already upregulated after PTX treatment in both cell lines (2.0±0.5 in MCF-7 and 1.8±0.5 in MDA MB 231) at that time point, while BCL-2 gene expression remained downregulated in both cell lines 6 h after PTX treatment. Moreover, we observed a slight increase in BAX gene expression when MDA MB 231 cells were treated with KER-NPs-PTX (2.7±0.2) for 12 h, underlying a different gene expression kinetic induced by system, compared to PTX and HSA-NPs-PTX. No appreciable differences in cytotoxicity and cells’ death were detected on MCF-7 cells, treated with KER-NPs-PTX as compared to HSA-NPs-PTX or to free PTX.
The higher cytotoxicity exerted on MDA MB 231 by KER-NPs-PTX in 2D cultures could be attributed to more favorable drug internalization mechanisms. Indeed, wool-derived keratin presents both RGD and LDV cell adhesion sequences.Citation43,Citation44 These sequences bind ανβ3 and α4β1 integrins overexpressed on the endothelium of the tumor neovasculature and on many types of cancer cells.Citation45–Citation47
To investigate the ability of our innovative delivery system to vehiculate PTX to cells grown in 2D model, we took advantage of PTX labeled with a thiophene-based fluorescent dye (PTX-F35), a previously reported fluorescent PTX derivative,Citation48 to perform cytofluorimetric uptake assays over time. We observed increased accumulation of PTX-F35 and loaded in KER-NPs (KER-NPs-PTX-F35) over time in both cell lines, although we appreciated a significantly higher cellular uptake in MCF-7, as compared to MDA MB 231 cells ( and ).
To support the robustness of our data, we investigated the effectiveness of KER-NPs-PTX in a p3D model. Indeed, it is being increasingly recognized that the selection of anticancer compounds on platforms using 2D cultured cells is frequently ineffective in precisely selecting clinically active drugs. In contrast, 3D culture systems are emerging as improved models of in vivo tumor growth,Citation49 recapitulating morphology, gradient distribution of chemicals and biological, and dynamic interactions between cancer cells and stroma.Citation50 Notably, cells cultured in 3D structures generally exhibit a reduced sensitivity to some chemotherapeutic agents, as compared to 2D monolayer cultures.Citation51
Accordingly, our results demonstrate that cells cultured in p3D are less sensitive than 2D cultures to PTX treatment, irrespective of its formulation. Nevertheless, only KER-NPs-PTX was able to induce significant cytotoxic effects upon 24 h treatment for MCF-7 and 48 h treatment for MDA MB 231 cells. These effects were also confirmed for MCF-7 cells by a significant increase in BAX gene expression (5.8±0.5) and by the immunostaining of scaffold sections with anti-CC3.
These data are consistent with a number of studies reporting different cellular responsiveness to anticancer treatment when cells are organized in 2D or 3D cultures. For instance, Imamura et alCitation49 treated different breast cancer cell lines with PTX, doxorubicin, or 5-fluorouracil in 2D and 3D models and observed a different cell sensitivity to all treatments when cells were organized in 3D models.
The different responsiveness of cell organized in 3D architectures to a specific antitumor agent might be attributed to a variety of factors, including altered signaling pathways,Citation52 reduced viability rates,Citation53 and environment-mediated factors including extracellular matrix-to-integrin signaling.Citation54,Citation55 Indeed, signals derived from cell-extracellular matrix are poorly present in monolayer cell cultures. Based on these considerations, the ability of KER-NPs-PTX to elicit cytotoxic effects on cells cultured in 3D structures might deserve particular interest.
Taken together, our data document that an innovative NP preparation, characterized by high solubility in water and easily amenable to up-scaled production, is able to effectively carry lipophilic payloads and to exert antitumor activities in advanced in vitro culture systems. These results pave the way for preclinical in vivo studies and may suggest important novel application in human cancer treatment.
Conclusion
Our investigations on keratin as novel biopolymer for drug delivery unravel that this high-molecular weight, full-length hydrosoluble protein, possesses an extraordinary ability to stably incorporate lipophilic compounds with high loading ratios. Thus, we described the preparation of keratin-based NPs loaded with PTX and their in vitro anticancer activity in 2D and p3D breast cancer models, as compared with free PTX and HSA-NPs-PTX.
PTX-loaded KER-NPs were obtained in quantitative yields and loading ratio up to 43% (w/w) (PTX/NPs). Depending on initial keratin solution concentration and on amounts of added PTX, it was possible to fine-tune PTX loading, while providing monodisperse KER-NPs with hydrodynamic diameters ranging from 125 to 165 nm. KER-NPs-PTX stability studies performed in FBS/H2O and PBS at 37°C document the high stability of these NPs, whose drug delivery rate follows a Fickian diffusion mechanism, ensuring a steady and controlled PTX release over time. From a technological view point, this study represents the first report of the synthesis of stable KER-NPs able to load a highly lipophilic drug, ie, PTX, in quantitative yields without requiring any purification processes. This unpredicted behavior relies on specific features of keratin, whose structural and chemical characteristics make it highly water soluble, while preserving hydrophobic pockets that effectively allow the in-water incorporation of lipophilic drug such as PTX.
In vitro 2D and p3D experiments performed on different breast cancers models, ie, MCF-7 and MDA MB 231 cells, document that this innovative NP preparation is able to effectively carry lipophilic payloads and to exert antitumor activities also in p3D models, despite their lower sensitivity to the anticancer treatments, as compared to conventional 2D models. These results pave the way for preclinical in vivo studies and may suggest important novel applications in human cancer treatment.
Author contributions
FF, GCS, and GV conceived the study. FF, GCS, GV, and MGM performed experiments, analyzed the data, and wrote the article. GV, MB, AG, CF, AA, and GCS performed compound synthesis, performed experiments, and analyzed the data. All authors contributed toward data analysis, drafting and revising the paper and agree to be accountable for all aspects of the work.
Acknowledgments
FF gratefully thanks Post-Doctoral Fellowship 2016 of Fondazione Umberto Veronesi and the European Molecular Biology Organization (EMBO) Short-Term Fellowship (ASTF 621-2015) for financial support of her research grants. This work was also supported by the Investigator Grant of the Italian Association for Cancer Research (AIRC) 16740 to GV. The authors acknowledge Dr Marta Columbaro for TEM analysis of nanoparticles.
Supplementary materials
Synthesis of paclitaxel (PTX) loaded in albumin nanoparticles (HSA-NPs-PTX)
HSA-NPs-PTX were prepared as previously described by Liu and co-workers.Citation1 Briefly, 8.4 mg of recombinant human serum albumin (HSA) was placed into a 10 mL vial and dissolved in PBS (4 mL) under magnetic stirring. PTX (1 mg) in ethanol (EtOH) (10 mg/mL) was added dropwise within 1 min. The solution was gently stirred at RT for 1 h and then centrifuged at 4,000 rpm for 4 min at 4°C in order to remove protein aggregates. The collected supernatant was then lyophilized. Nanoparticles’ (NPs) hydrodynamic diameter and zeta-potential were measured on a NanoBrook Omni Particle Size Analyzer (Brookhaven Instruments Corporation, USA) equipped with a 35 mW red diode laser (nominal 640 nm wavelength) ( and ). PTX loading on NPs was consistent with literature data.Citation1
Evaluation of cytotoxicity of albumin and KER-NPs
In order to evaluate if our delivery systems, ie, albumin nanoparticles (HSA-NPs) and keratin nanoparticles (KER-NPs), were safe as delivery NPs, MCF-7 and MDA MB 231 cells were incubated with increasing concentrations of compounds. Cytotoxicity was then evaluated 72 h after the treatment.
PTX labeled with a thiophene-based fluorescent dye (PTX-F35)Citation2 cellular uptake was carried out on C6 flow cytometry equipment (Accuri Cytometers, Milan, Italy). Briefly 8×10⁴ cells were plated in a six-well culture plate (TPP, Trasadingen, Switzerland) and incubated with PTX, PTX-F35, and PTX-F35 and loaded in KER-NPs (KER-NPs-PTX-F35) ([PTX-F35] =5 µg/mL) for 2, 4, 6, and 24 h. Cells were detached after each incubation period using a 0.05% trypsin–0.02% EDTA solution (Sigma-Aldrich, Co., St Louis, MO, USA) and re-suspended in 300 µL of PBS (Sigma-Aldrich, Co.). They were then run on the C6 flow cytometer (Accuri Cytometers), which considered 10,000 events, using 488 nm excitation to measure the intracellular PTX-F35. Intracellular fluorescence is expressed as integrated median fluorescence intensity (iMFI) ratio. This is the product of the frequency of cells that are positive to PTX-F35 and the median fluorescence intensity of the cells. Results are expressed in iMFI ratio, ie, the ratio between the iMFI of treated and untreated cells.
In vitro PTX release from the HSA-NPs-PTX
A certain amount of HSA-NPs-PTX suspension (1 mg/mL) containing 6% by weight of PTX were placed into a dialysis bag (cutoff 12–14 kDa) and immersed, under shaking, in 6 mL of a PBS solution (pH 7.4) containing 10% EtOH at 37°C. The outer solution was periodically sampled, and drug concentration was determined by ultraviolet–visible spectroscopy (UV–Vis) spectrophotometry (Cary 100; Agilent Technologies, Santa Clara, CA, USA).
Figure S1 Profile of PTX release from HSA-NPs.
Abbreviations: HSA-NPs, albumin nanoparticles; PTX, paclitaxel.
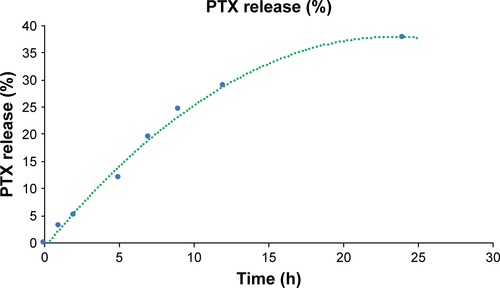
Figure S2 Transmission electron microscopy images of unfixed KER-NPs-PTX at two magnifications.
Notes: Morphological analysis shows that the particles had smooth surface, spherical shape with a central core surrounded by a weak halo, and an average dry diameter of ~100 nm. (A) Particles with scale bar of 2 µm; (B) particles with a scale bar of 200 nm.
Abbreviation: KER-NPs-PTX, paclitaxel loaded in keratin nanoparticles.
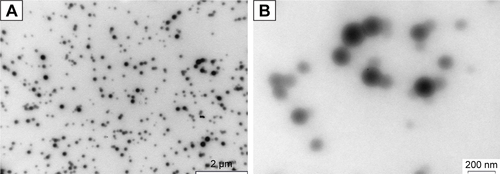
Figure S3 Stability of KER-NPs-PTX in PBS at 37°C measured by DLS analysis.
Abbreviations: DLS, dynamic light scattering; KER-NPs-PTX, paclitaxel loaded in keratin nanoparticles; PDI, polydispersity index.
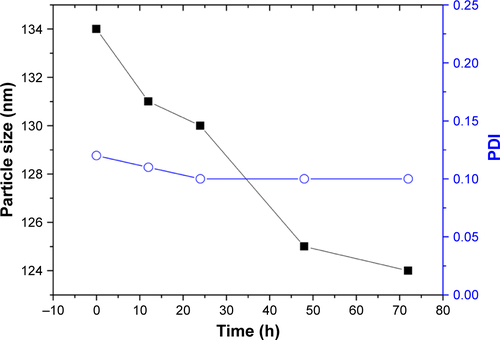
Figure S4 Evaluation of cytotoxic activity of HSA-NPs and KER-NPs on MCF-7 and MDA MB 231 cell proliferation in 2D model.
Notes: Cell proliferation was evaluated 72 h after exposure to increasing concentrations of HSA-NPs (0.0002, 0.22, and 55 µg/mL equivalent to PTX concentration of 0.00002, 0.02, and 5 µg/mL, respectively) or of KER-NPs (0.00004, 0.04, and 10 µg/mL equivalent to PTX concentration of 0.00002, 0.02, and 5 µg/mL, respectively) by APH assay. Untreated cells (100% are represented by a dotted line). PTX-F35 in a free form or as HSA-NPs-PTX-F35 or KER-NPs-PTX-F35 cytofluorimetric cellular uptake.
Abbreviations: APH, acid phosphatase; 2D, two-dimensional; HSA-NPs, albumin nanoparticles; HSA-NPs-PTX-F35, PTX labeled with a thiophene-based fluorescent dye and loaded in HSA-NPs; KER-NPs, keratin nanoparticles; KER-NPs-PTX-F35, PTX labeled with a thiophene-based fluorescent dye and loaded in KER-NPs; PTX, paclitaxel; PTX-F35, PTX labeled with a thiophene-based fluorescent dye.
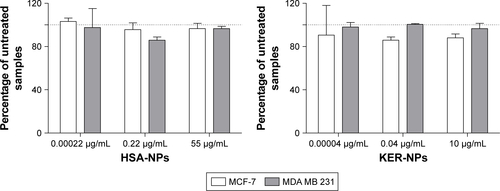
Figure S5 Paclitaxel labelled with a thiophene-based fluorescent dye (PTX-F35).
Notes: (A) Molecular structure of PTX-F35. (B) Absorbance and emission spectra of PTX-F35.
Abbreviation: PTX-F35, paclitaxel labeled with a thiophene-based fluorescent dye.
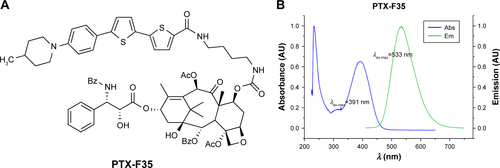
Figure S6 Cytofluorimetric analysis of the uptake of fluorescent PTX-F35 loaded in KER-NPs by MCF-7 and MDA MB 231 cells.
Notes: MCF-7 and MDA MB 231 cells were incubated at the same concentration of PTX-F35 ([PTX] =5 µg/mL) and KER-NPs-PTX-F35 for 2, 4, 6, and 24 h. Fluorescent signal was detected by a flow cytometer using a 488 nm excitation to measure intracellular PTX-F35 and expressed as iMFI ratio. Statistical significance versus untreated cells: *P<0.05 and ***P<0.001.
Abbreviations: iMFI, integrated median fluorescence intensity; KER-NPs, keratin nanoparticles; KER-NPs-PTX-F35, PTX labeled with a thiophene-based fluorescent dye and loaded in KER-NPs; PTX, paclitaxel; PTX-F35, PTX labeled with a thiophene-based fluorescent dye.
![Figure S6 Cytofluorimetric analysis of the uptake of fluorescent PTX-F35 loaded in KER-NPs by MCF-7 and MDA MB 231 cells.Notes: MCF-7 and MDA MB 231 cells were incubated at the same concentration of PTX-F35 ([PTX] =5 µg/mL) and KER-NPs-PTX-F35 for 2, 4, 6, and 24 h. Fluorescent signal was detected by a flow cytometer using a 488 nm excitation to measure intracellular PTX-F35 and expressed as iMFI ratio. Statistical significance versus untreated cells: *P<0.05 and ***P<0.001.Abbreviations: iMFI, integrated median fluorescence intensity; KER-NPs, keratin nanoparticles; KER-NPs-PTX-F35, PTX labeled with a thiophene-based fluorescent dye and loaded in KER-NPs; PTX, paclitaxel; PTX-F35, PTX labeled with a thiophene-based fluorescent dye.](/cms/asset/1606dbb6-0266-4463-bbde-7c025ee1d327/dijn_a_159942_sf0006_b.jpg)
Table S1 HSA-NPs-PTX hydrodynamic diameters
Table S2 HSA-NPs-PTX zeta potential
Table S3 KER-NPs-PTX hydrodynamic diameters
Table S4 KER-NPs-PTX zeta potential
References
- ChenQLiangCWangCLiuZAn imagable and photothermal “Abraxane- like” nanodrug for combination cancer therapy to treat subcutaneous and metastatic breast tumorsAdv Mater201527590391025504416
- DuchiSDambruosoPMartellaEThiophene-based compounds as fluorescent tags to study mesenchymal stem cell uptake and release of taxanesBioconjug Chem201425464965524628247
Disclosure
MGM and GCS are shareholders of Cellec Biotek AG. The other authors report no conflicts of interest in this work.
References
- SenkusEKyriakidesSPenault-LlorcaFESMO Guidelines Working GroupPrimary breast cancer: ESMO clinical practice guidelines for diagnosis, treatment and follow-upAnn Oncol201324suppl 6vi7vi2323970019
- RiveraECianfroccaMOverview of neuropathy associated with taxanes for the treatment of metastatic breast cancerCancer Chemother Pharmacol201575465967025596818
- HolmesFAWaltersRSTheriaultRLPhase II trial of taxol, an active drug in the treatment of metastatic breast cancerJ Natl Cancer Inst19918324179718051683908
- MengZLvQLuJProdrug strategies for paclitaxelInt J Mol Sci2016175E79627223283
- AftabSShahANadhmanANanomedicine: an effective tool in cancer therapyInt J Pharm20185401–213214929427746
- CavallaroGSardoCCraparoEFPorsioBGiammonaGPolymeric nanoparticles for siRNA delivery: production and applicationsInt J Pharm2017525531333328416401
- WangKHuangQQiuFSuiMNon-viral delivery systems for the application in p53 cancer gene therapyCurr Med Chem201522354118413626423086
- WangFLiCChengJYuanZRecent advances on inorganic nanoparticle-based cancer therapeutic agentsInt J Environ Res Public Health201613121182
- ZhangBWangKSiJSuiMShenYCharge-reversal polymers for biodeliveryGuZBioinspired and Biomimetic Polymer Systems for Drug and Gene DeliveryWeinheim, GermanyWiley-VCH Verlag GmbH & Co. KGaA2014223242
- GagliardiMSilvestriDCristalliniCMacromolecular composition and drug-loading effect on the delivery of paclitaxel and folic acid from acrylic matricesDrug Deliv201017645246520504107
- LohcharoenkalWWangLChenYCRojanasakulYProtein nanoparticles as drug delivery carriers for cancer therapyBiomed Res Int20142014112
- DosioFBrusaPCrosassoPArpiccoSCattelLPreparation, characterization and properties in vitro and in vivo of a paclitaxel–albumin conjugateJ Control Release199747293304
- FanciullinoRCiccoliniJMilanoGChallenges, expectations and limits for nanoparticles-based therapeutics in cancer: a focus on nano-albumin-bound drugsCrit Rev Oncol Hematol201388350451323871532
- MaPMumperRJPaclitaxel nano-delivery systems: a comprehensive reviewJ Nanomed Nanotechnol201342100016424163786
- AluigiASotgiuGFerroniCChlorin e6 keratin nanoparticles for photodynamic anticancer therapyRSC Adv201663391033918
- ZhiXWangYLiPYuanJShenJPreparation of keratin/chlorhexidine complex nanoparticles for long-term and dual stimuli-responsive releaseRSC Adv201558233482341
- YuBTaiHCXueWLeeLJLeeRJReceptor-targeted nanocarriers for therapeutic delivery to cancerMol Membr Biol201027728629821028937
- XuHShiZReddyNYangYIntrinsically water-stable keratin nanoparticles and their in vivo biodistribution for targeted deliveryJ Agric Food Chem201462379145915025174826
- LiQZhuLLiuRBiological stimuli responsive drug carriers based on keratin for triggerable drug deliveryJ Mater Chem201222371996419973
- LiYZhiXLinJYouXYuanJPreparation and characterization of DOX loaded keratin nanoparticles for pH/GSH dual responsive releaseMater Sci Eng C201773189197
- KunjiappanSChowdhuryASomasundaramBBhattacharjeeCOptimization, preparation and characterization of rutinquercetin dual drug loaded keratin nanoparticles for biological applicationsNanomed J20163253267
- ChenQLiangCWangCLiuZAn imagable and photothermal “Abraxane-like” nanodrug for combination cancer therapy to treat subcutaneous and metastatic breast tumorsAdv Mater201527590391025504416
- CukiermanEPankovRStevensDRYamadaKMTaking cell-matrix adhesions to the third dimensionScience200129455471708171211721053
- PampaloniFReynaudEGStelzerEHKThe third dimension bridges the gap between cell culture and live tissueNat Rev Mol Cell Biol200781083984517684528
- HirtCPapadimitropoulosAMeleV“In vitro” 3D models of tumor-immune system interactionAdv Drug Deliv Rev201479–80145154
- HirtCPapadimitropoulosAMuraroMGBioreactor-engineered cancer tissue-like structures mimic phenotypes, gene expression profiles and drug resistance patterns observed “in vivo”Biomaterials20156213814626051518
- DästerSAmatrudaNCalabreseDInduction of hypoxia and necrosis in multicellular tumor spheroids is associated with resistance to chemotherapy treatmentOncotarget20168117251736
- WendtDStroebelSJakobMJohnGTMartinIUniform tissues engineered by seeding and culturing cells in 3D scaffolds under perfusion at defined oxygen tensionsBiorheology2006433,448148816912419
- WendtDMarsanoAJakobMHebererMMartinIOscillating perfusion of cell suspensions through three-dimensional scaffolds enhances cell seeding efficiency and uniformityBiotechnol Bioeng200384220521412966577
- LivakKJSchmittgenTDAnalysis of relative gene expression data using real-time quantitative PCR and the 2−ΔΔCT methodMethods200125440240811846609
- GongGXuYZhouYMolecular switch for the assembly of lipophilic drug incorporated plasma protein nanoparticles and in vivo imageBiomacromolecules2012131232822029860
- MotlaghNSHParvinPGhasemiFAtyabiFFluorescence properties of several chemotherapy drugs: doxorubicin, paclitaxel and bleomycinBiomed Opt Express2016762400240627375954
- ZhouH-BZhuJ-RPaclitaxel induces apoptosis in human gastric carcinoma cellsWorld J Gastroenterol20039344244512632493
- WangJHeFTzangCDifferential gene expression profiles in paclitaxel-induced cell cycle arrest and apoptosis in human breast cancer MCF-7 cellsYao Xue Xue Bao2005401099110416496673
- SaundersDELawrenceWDChristensenCWapplerNLRuanHDeppeGPaclitaxel-induced apoptosis in MCF-7 breast-cancer cellsInt J Cancer19977022142209009163
- GuptaNLiuJRPatelBSolomonDEVaidyaBGuptaVMicrofluidics- based 3D cell culture models: utility in novel drug discovery and delivery researchBioeng Transl Med201611638129313007
- TaherianALiXLiuYHaasTADifferences in integrin expression and signaling within human breast cancer cellsBMC Cancer20111129321752268
- McIlwainDRBergerTMakTWCaspase functions in cell death and diseaseCold Spring Harb Perspect Biol201354a00865623545416
- GradisharWJTjulandinSDavidsonNPhase III trial of nanoparticle albumin-bound paclitaxel compared with polyethylated castor oil–based paclitaxel in women with breast cancerJ Clin Oncol200523317794780316172456
- DesaiNPTaoCYangA webpage on the InternetProtein Stabilized Pharmacologically Active Agents, Methods for the Preparation Thereof and Methods for the Use Thereof2004 Available from: https://www.google.com/patents/US6749868Accessed June 15, 2004
- DesaiNPSoon-ShiongP webpage on the InternetPaclitaxel-Containing Formulations2004 Available from: https://worldwide.espacenet.com/publicationDetails/biblio?FT=D&date=20040622&DB=&locale=&CC=US&NR=6753006B1&KC=B1&ND=1Accessed June 15, 2018
- ZhaoSWangWHuangYFuYChengYPaclitaxel loaded human serum albumin nanoparticles stabilized with intermolecular disulfide bondsMed Chem Commun201451116581663
- Ajay SharmaLAliMALoveRMWilsonMJDiasGJNovel keratin preparation supports growth and differentiation of odontoblast-like cellsInt Endod J201649547148226016886
- VermaVVermaPRayPRayARPreparation of scaffolds from human hair proteins for tissue-engineering applicationsBiomed Mater20083202500718458372
- DesgrosellierJSChereshDAIntegrins in cancer: biological implications and therapeutic opportunitiesNat Rev Cancer201010192220029421
- ZhangFHuangXZhuLNoninvasive monitoring of orthotopic glioblastoma therapy response using RGD-conjugated iron oxide nanoparticlesBiomaterials201233215414542222560667
- JuJAGodetIYeICHypoxia selectively enhances integrin α 5 β 1 receptor expression in breast cancer to promote metastasisMol Cancer Res201715672373428213554
- DuchiSDambruosoPMartellaEThiophene-based compounds as fluorescent tags to study mesenchymal stem cell uptake and release of taxanesBioconjug Chem201425464965524628247
- ImamuraYMukoharaTShimonoYComparison of 2D- and 3D-culture models as drug-testing platforms in breast cancerOncol Rep20153341837184325634491
- XuXFarach-CarsonMCJiaXThree-dimensional in vitro tumor models for cancer research and drug evaluationBiotechnol Adv20143271256126825116894
- FongELSLamhamedi-CherradiS-EBurdettEModeling Ewing sarcoma tumors in vitro with 3D scaffoldsProc Natl Acad Sci U S A2013110166500650523576741
- WeigeltBLoATParkCCGrayJWBissellMJHER2 signaling pathway activation and response of breast cancer cells to HER2-targeting agents is dependent strongly on the 3D microenvironmentBreast Cancer Res Treat20101221354319701706
- BurdettEKasperFKMikosAGLudwigJAEngineering tumors: a tissue engineering perspective in cancer biologyTissue Eng Part B Rev201016335135920092396
- MuranenTSelforsLMWorsterDTInhibition of PI3K/mTOR leads to adaptive resistance in matrix-attached cancer cellsCancer Cell201221222723922340595
- HuangCParkCCHilsenbeckSGβ1 integrin mediates an alternative survival pathway in breast cancer cells resistant to lapatinibBreast Cancer Res2011134R8421884573