
 ?Mathematical formulae have been encoded as MathML and are displayed in this HTML version using MathJax in order to improve their display. Uncheck the box to turn MathJax off. This feature requires Javascript. Click on a formula to zoom.
Abstract
Introduction
Deep penetration of large-sized drug nanocarriers into tumors is important to improve the efficacy of tumor therapy.
Methods
In this study, we developed a size-changeable “Trojan Horse” nanocarrier (THNC) composed of paclitaxel (PTX)-loaded Greek soldiers (GSs; ~20 nm) assembled in an amphiphilic gelatin matrix with hydrophilic losartan (LST) added.
Results
With amphiphilic gelatin matrix cleavage by matrix metalloproteinase-2, LST showed fast release of up to 60% accumulated drug at 6 h, but a slow release kinetic (~20%) was detected in the PTX from the GSs, indicating that THNCs enable controllable release of LST and PTX drugs for penetration into the tumor tissue. The in vitro cell viability in a 3D tumor spheroid model indicated that the PTX-loaded GSs liberated from THNCs showed deeper penetration as well as higher cytotoxicity, reducing a tumor spheroid to half its original size and collapsing the structure of the tumor microenvironment.
Conclusion
The results demonstrate that the THNCs with controlled drug release and deep penetration of magnetic GSs show great potential for cancer therapy.
Introduction
Chemotherapy is one of the most common ways to treat cancer, but traditional chemotherapeutic drugs usually cause severe side effects and high toxicity. Nanotechnology-based drug delivery systems have been developed to achieve a better therapeutic effect and reduced adverse effects via the enhanced permeability and retention effect with an optimal particle size of 30–200 nm in comparison with traditional chemotherapy.Citation1–Citation3 However, it was found that the highly dense tumor extracellular matrix (ECM) severely limits particle diffusion through the tissue, causing nanomedicines to accumulate near the blood vessels and release the antitumor drug only in the perivascular space of tumor areas.Citation4,Citation5 This reveals that particle size control below the mesh size of ECM matrix ranging between 20 and 40 nm in solid tumors becomes increasingly important for nanomedicine penetration.Citation5–Citation7 On the other hand, it has been reported that particles <10 nm show rapid renal clearance to minimize toxicity risks.Citation8 This indicates that new nanocarriers must be designed with a size-changeable structure to liberate ultra-small nanomedicine for enhancing penetration and drug delivery into the deep regions of tumors and achieving an efficacious therapy.
In recent years, progress in controlling nanoparticle (NP) size through nanotechnology and colloidal chemistry has been studied to improve the penetration and loading capacity of nanomedicine.Citation9,Citation10 Wong et al proposed a gelatin-coated quantum dots (QDs) NP delivery system (QDGelNPs) to demonstrate that the inorganic QDs can achieve efficient penetration into the deep tumor without being trapped by the cross-linked ECM after collagen degradation by matrix metalloproteinase-2 (MMP-2) that is highly expressed in the tumor microenvironment.Citation11 Ju et al used a reversible swelling–shrinking nanogel (NLSCNG) as a novel mechanism for the large NPs to accomplish deep tumor penetration.Citation12 Recently, several stimulation approaches have been proposed to improve the tumor microenvironment and achieve higher drug delivery and efficient transportation.Citation13,Citation14 Lai et al used a combination treatment of ultrasound and hyperthermia to increase the drug accumulation by up to three-fold.Citation15 Su et al used magnetic force–induced perfluorohexane gasification as a deep tumor-penetrating agent to release a burst of hydrophobic paclitaxel (PTX) drug from the hydrophobic pores of protein-capped particles.Citation16 Although the drug can be released and penetrated into the deep regions by an external stimulus such as intense heat or mechanical force, the effective therapeutic window is limited because these nanocarriers are easily trapped within the ECM or attached to the tumor vasculature.Citation17–Citation19 Therefore, there is a strong need to develop size-changeable nanomedicine with physicochemical responses to the tumor microenvironment for effective nanomedicine delivery into deep tumors for enhanced therapeutic efficiency.
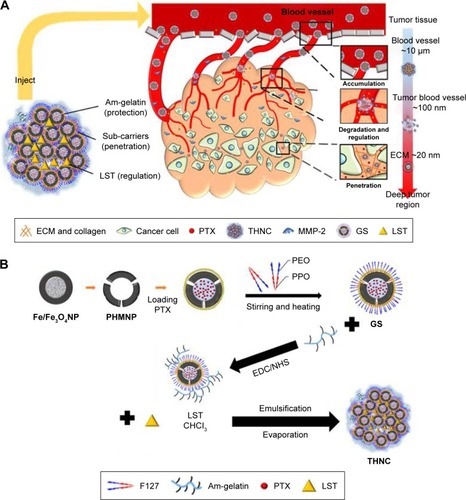
In addition, losartan (LST) has been reported to increase vascular perfusion for reducing the high interstitial fluid pressure in the tumor tissue,Citation19–Citation21 which would be favorable for potentiating sub-nanocarrier diffusion. In this study, to take advantage of the metalloproteinase-rich microenvironmentCitation22 and LST release, for enhancing tumor permeability, we proposed a microenvironment-sensitive, dual-drug loaded nanomedicine that can liberate the sub-nanocarriers for deep tumor penetration to achieve multistage drug delivery and release as illustrated in . PTX-loaded porous hollow magnetite NPs (PHMNPs) were first synthesized to form magnetic sub-nanocarriers. To adapt to the physiological hydrophilic tumor microenvironment and enhance penetration, the magnetic sub-nanocarriers were modified by Pluronic® F127 to form F-127-coated PHMNPs, referred to as Greek soldiers (GSs). Subsequently, the GSs can be further assembled through amphiphilic gelatin (AmG) conjugation to form a core–shell structure with multiple GSs located within the AmG matrix. To further destabilize the existing ECM matrix in tumors, LST was loaded in the AmG matrix to decrease collagen in the ECM, which is favorable for potentiating sub-nanocarrier diffusion after AmG is degraded by MMP-2. Therefore, a dual-drug–loaded nanostructure (referred to as “Trojan Horse” nanocarriers [THNCs]) can be obtained with GSs dispersed in the main AmG matrix. The newly designed THNCs provide a nanoplatform with efficient delivery of sub-nanocarriers for deep tumor penetration and sufficient drug release to increase therapeutic efficacy.
Materials and methods
Materials
1-Octadecene, MTT reagent, 4′-6-diamidino-2-phenylindole (DAPI, Thermo Fisher Scientific), acetone (≥99.9%) and acetonitrile (ACN; 99.8%), hexane (95%), iron pentacarbonyl (Fe(CO)5), oleic acid (90%), PTX (Scinopharm), LST (Fluka), PBS (UniRegion Bio-tech), oleylamine (>70%), pluronic F-127 (Sigma-Aldrich Co., St Louis, MO, USA), sodium dodecyl sulfate gel, acrylamide/bis-acrylamide (40% solution, 29:1), N,N,N′,N′-tetramethylethylenediamine (~99%), trimethylamine N-oxide and ammonium persulfate (≥98%) were purchased from Sigma-Aldrich Co. Benzyl ether (99%), gelatin type A (from porcine skin), MMP-2 (≥98%), chloroform, N-hydroxysuccinimide (NHS) and 1-ethyl-3-(3-dimethylaminopropyl) carbodiimide hydrochloride (EDC) were purchased from Sigma-Aldrich Co. Formaldehyde was purchased from Riedel de Haen and Tri-ton X-100 from J.T. Baker. CdSe/ZnS core/shell QDs were obtained from Ocean Nanotech (Springdale, AR, USA). All chemicals and solvents were of analytical reagent grade.
Synthesis of Fe/Fe3O4 NPs (seed)
Twenty microliters of 1-octadecene and 0.3 mL oleylamine (0.9 mmoL) in a flask was degassed under nitrogen gas at 120°C for 0.5 h to remove the oxygen and moisture. Then the solution was heated to 180°C, and Fe(CO)5 (0.7 mL) was injected with stirring under a blanket of nitrogen gas. The solution was kept at 180°C for 0.5 h before being cooled to 25°C. The magnetic stirring bar coated with black powder was washed with hexanes and transferred into a centrifuge vial after the supernatant was discarded. Then, 30 mL of iso-propanol was added to the product to precipitate the Fe/Fe3O4 (~16 nm) NPs. The washing step above was repeated three times. Finally, the Fe/Fe3O4 NPs were redispersed in hexane containing 0.01 mL oleylamine.
Synthesis of hollow magnetite NPs (HMNPs)
The solutions of 20 mL 1-octadecene and 30 mg trimethylamine N-oxide were mixed in a four-necked flask. To remove the moisture and oxygen, the mixture was degassed under nitrogen gas at 130°C for 1 h. Fe/Fe3O4 (80 mg) in hexane was injected into the solution, and then the resultant solution was kept at 130°C for 2 h to remove hexane. Next, the solution was heated at a rate of 2°C/min to a final temperature of 250°C. When the solution was cooled to 25°C, 40 mL of acetone was added to the mixture and then centrifuged for 10 min at 8,000 rpm. The powder was redispersed in hexane containing oleylamine and then precipitated by the addition of acetone (40 mL). The precipitated NPs were collected by centrifugation and the resulting HMNPs were redispersed into hexane.
Synthesis of PHMNPs
A solution of 0.17 mL oleylamine (0.5 mmol), 0.16 mL oleic acid and 20 mL benzyl was mixed in a three-necked flask. The solution was degassed with nitrogen gas at 25°C for 0.5 h. Next, the HMNPs (50 mg) in hexane were injected into the above solution via a syringe. The resulting mixture was heated to 100°C with stirring and kept at this temperature for 0.5 h to remove hexane. Subsequently, the mixture was heated at a rate of 2°C/min to a final temperature of 260°C and maintained at 260°C for 0.5 h before being cooled to 25°C. The black powder was precipitated by the addition of acetone (3 mL) and subsequently subjected to centrifugation. The washing process was repeated thrice and the resulting PHMNPs were obtained.
Synthesis of AmG
Gelatin (3 g) was added to water (40 mL), and 1 mL of 1 N sodium hydroxide (NaOH) solution was gently added into the suspension and stirred for 24 h at 70°C. Next, hexanoic anhydride (4 mL) and ethanol (30 mL) were added to the gelatin solution at 70°C. After heating for 4 h, the solution was cooled to 25°C and the pH was adjusted to 7.4 with 0.1 M NaOH. The resulting solution was collected in dialysis bags after dialysis against ethanol solution (75% v/v) for 48 h. Finally, the water-insoluble products were removed by dialysis membrane and oven-dried at 45°C overnight.
Incorporation of PTX in PHMNPs
To incorporate PTX into the cavity of PHMNPs, we dispersed the PHMNPs in a PTX-containing ethanol solution using the following modified nanoprecipitation method. Briefly, 6.5 mg of PHMNPs was dispersed in 3 mL of ethanol solution with 4 mg of PTX. The mixture was stirred for 4 h at 25°C and then the solvent was evaporated. The resultant PTX-loaded PHMNPs were washed three times with deionized water to remove free PTX.
Synthesis of GSs
PTX-loaded PHMNPs at a concentration of 6.5 mg PHMNPs were dispersed into 0.5 mL of chloroform and 10 mL of F127 solution (10 mg/mL) was then added. Next, the mixture was heated to 50°C and stirred vigorously, which produced a white emulsified solution and the chloroform was further removed by evaporation. The resulting solution was transferred into a centrifuge vial followed by centrifugation at 8,000 rpm for 10 min. The F127-coated PHMNPs (ie, GSs) were formed and redispersed into deionized water.
Synthesis of THNCs
Ten micrograms of GS was dispersed into 1 mL of buffer (pH 6.0) containing 0.5 M NaCl and 0.1 M 2-(N-morpholino) ethanesulfonic acid. Ten milligrams of AmG was dissolved into PBS (0.1 M sodium phosphate, 0.15 M NaCl, pH 7.2–7.5). Then, 1.24 mg of EDC was added into GS solution and stirred for 15 min. Also, 1.84 mg of NHS was sequentially added and stirred for another 15 min. After stirring, the AmG solution was added into the mixture and the reaction was carried out at 25°C for 2 h. Finally, the resultant solution was centrifuged at 8,500 rpm for 10 min to remove excess EDC and NHS. The washing step was repeated three times, and then, the GS–AmG complex was dispersed in deionized water.
Subsequently, 0.25 mg of GS–AmG complex with 6 mg of AmG and 2 mg LST were dispersed into 1 mL of deionized water. The mixture was vortexed for 30 min to ensure uniform solution. To the mixture, 0.5 mL of chloroform was then added and sonicated. The emulsion was heated to 50°C to evaporate chloroform. The resultant solution was centrifuged at 6,000 rpm for 10 min to remove excess AmG. Finally, the THNCs were synthesized and washed three times.
Characterization of THNCs
Transmission electron microscopy (TEM; JEM-2100; JEOL, Tokyo, Japan) and field-emission scanning electron microscope (JEOL-6500, JEOL) were used to observe the morphology of the NPs (GS, THNC). For scanning electron microscopic (SEM) analysis, NPs were coated with a thin platinum layer and dried on silicon wafers to improve the quality of the image. Dynamic light scatter (BECKMAN COULTER Delsa™ Nano C particle analyzer) was used to measure the sizes of NPs (GS, THNC). The static magnetization and the hysteretic behavior of magnetic NPs (GS, THNC; from −10,000 to +10,000 G at 25°C) were measured by Superconducting Quantum Interference Device (MPMS-XL).
In vitro drug release behavior
PTX and LST were used as model drugs to investigate the drug-releasing behavior of GSs and THNCs. High-performance liquid chromatography (HPLC) equipped with a 4.6×150 mm ZORBAX Eclipse XDB-C18 (5 μm) column was employed to quantify PTX at the detection wavelength of 227 nm. The composition of the mobile phase was water/ACN (20/80, v/v). On the other hand, LST was quantified by HPLC at the wavelength of 234 nm. The mobile phase was 40:60 ACN:buffer consisting of 0.05% of orthophosphoric acid and 0.05% triethylamine at a flow rate 1.0 mL/min.
A solution of dual-drug–loaded NPs was added to a dialysis bag (molecular weight cut off 14,000). The release condition was maintained at 37°C against PBS (pH 7.4, 10 mM) containing 0.5% Tween 80 by a dialysis method. One milliliter of the release medium was collected periodically and replaced with fresh medium. After the incubation, the residue was reconstituted in ACN to determine the amounts by HPLC.
The encapsulation efficiency (EE) of PTX and LST is defined using the following equation:
The drug-loading capacity (LC) was defined by the following equation:
Cytotoxicity of GSs and THNCs
The HeLa cell line was purchased from the Food Industry Research and Development Institute. The cells were cultured in DMEM supplemented with 10% fetal bovine serum (FBS) at 37°C in a humidified 5% CO2 atmosphere. After the cells were cultured until near confluence, the medium was removed and the cells were washed twice by PBS. Cells were detached by adding 1 mL of trypsin into the flask and incubating at 37°C for 3 min. Cells were collected by centrifugation at 3,000 rpm for 5 min and were transferred to a 96-well plate. Each well was seeded with 1×10⁴ cells. Cells were then exposed to GSs or THNCs at concentrations of 1,000, 100, 10, 1 or 0.1 μg/mL in DMEM (without FBS) for 24 or 48 h of incubation. Additionally, the cells were exposed to PTX-GSs and PTX-THNCs at PTX concentrations of 1, 10, 100, 200, 500, 800, 1,000, 10,000 and 1, 20, 50, 100, 200, 500, 1,000, 2,000 ng/mL in MEM (without FBS) for 24 or 48 h. The drug concentration was fixed at 0.4 mg PTX/mg in the GSs and 0.1 mg PTX/mL in THNCs. After incubation, all the HeLa cells were washed twice with PBS. The cell viabilities were determined with CellTiter 96® AQueous One Solution Cell Proliferation Assay (3-(4,5-dimethylthiazol-2-yl)-5-(3-carboxymethoxyphenyl)-2-(4-sulfophenyl)-2-H-tetrazolium [MTS] assay). Hundred microliters of MTS solution (MTS:MEM=1:4) was added into each well. The plates were incubated at 37°C with 5% CO2 atmosphere for 4 h. After incubation, the concentration of MTS product was measured by absorbance of a specific wavelength at 490 nm with a 96-well plate reader. Cell viabilities were determined by the percentage of absorbance of treated cells to that of non-treated cells and plotted as concentrations of nanocarriers and PTX.
Cellular uptake and immunofluorescence staining
The HeLa cell line was cultured in DMEM with 10% FBS in T75 flasks. After the cells were cultured until near confluence, the medium was removed and the cells were washed twice in PBS. Cells were detached by adding 1 mL of trypsin into the flask and incubating at 37°C for 3 min. Cells were collected by centrifugation at 3,000 rpm for 5 min and then transferred onto coverslips in 24-well plates. Each well was seeded with 2×10⁴ cells. Cells were then exposed to QD-conjugated GSs or THNCs at concentrations of 20 μg/mL in DMEM (without FBS) for 0.5, 1, 2, 3, 4, 6, 12 and 24 h. After incubation, the carrier-containing medium was removed and the cells were washed three times with PBS. Four percent paraformaldehyde was added to immobilize the cells for 30 min. The fixed cells were washed three times by PBS and 0.1% Triton was added to perforate the cell membranes for 30 min. Phalloidin was then added and the cells were incubated at room temperature for 1–2 h. After washing three times with PBS, DAPI was used as a nuclear counterstain and incubated for 5–15 min. The cells were then washed three times, and the coverslips were picked out from the 24-well plates. The coverslips were sealed onto slides with Dako Fluorescent Mounting Medium and the slides were visualized by confocal laser scanning microscopy (CLSM). The cells were also collected by trypsin and dispersed in PBS for flow cytometry analysis (10,000 cumulative events, analyzed by Cellquest® software).
Collagen gel diffusion
We mixed 160 μL of 8.6 mg/mL rat tail collagen I (354249; BD Biosciences, San Jose, CA, USA), 3.8 μL of 1 M NaOH and 19.5 μL of 0.17 M EDTA on ice to synthesize collagen hydrogels. The final concentration of EDTA was 20 mM and that of collagen was 7.38 mg/mL. After vortexing, the gel was added into the capillary tube (Vitrocom no 2540) and then incubated at 37°C for 24 h. QD-labeled THNCs were incubated with activated MMP-2 (230 ng) for 12 h in Hepes (50 mM) with CaCl2 (2 mM). EDTA was added to balance the final concentration at about 20 mM at the end of 12 h. Twenty microliters of QD-labeled THNCs (with or without incubation with MMP-2) and QD-labeled GSs were added into the tube and placed in contact with the surface of the collagen gel. After overnight incubation, the QD distribution was recorded by photographs.
In vitro penetration of sub-nanocarrier into tumor spheroid model
CLSM (Zeiss LSM 700 Confocal; Carl Zeiss Meditec AG, Jena, Germany) was used to observe the penetration of sub-carriers, and hydrophobic fluorescent QDs (Ocean NanoTech, San Diego, CA, USA) were used to label the GS particles. To grow tumor spheroids, 200 μL/well of cell suspensions containing 1×10⁴ HeLa cells were dispensed into ULA 96-well round-bottom plates (Corning® Costar® cell culture plates 96 well; Corning Incorporated, Corning, NY, USA). The cells were incubated in DMEM (containing 10% FBS and 1% penicillin/streptomycin) at 37°C with 5% CO2. After 4 weeks, tumor spheroids of diameter 1,000 μm were used for a penetration test and immunofluorescence staining. For observation, the tumor cells were fixed with 4% formaldehyde and then permeabilized with 0.1% Triton X-100 for 0.5 h. Phalloidin 488 and DAPI were used to stain the F-actin and nuclei of the cells, respectively. The fluorescence intensities of the spheroids were analyzed and quantified using the CLSM software (ZEN lite).
In vitro cytotoxicity of nanocarrier in tumor spheroid model
HeLa tumor spheroids were incubated with PTX-THNCs+MMP-2, PTX-THNCs and PTX-GSs for 24 h. The tumor spheroids were stained using a LIVE/DEAD® kit (Thermo Fisher Scientific) to estimate the cell viability. In this study, live cells appeared green because calcein acetoxymethyl ester is cleaved by esterases in live cells to yield cytoplasmic green fluorescence. Dead cells appeared red because the compromised nuclear membrane of a dead cell allows the ethidium homodimer-1 to enter and bind nucleic acids, yielding red fluorescence. To dilute the fluorescence stains, 2.5 μL of calcein acetoxymethyl ester and 8 μL of ethidium homodimer-1 were dissolved in 10 mL of PBS. Tumor spheroids were incubated with 1 mL of fluorescence stains for 30 min, followed by imaging using an inverted Nikon microscope (TE-2000U; Nikon Corporation, Tokyo, Japan).
CLSM observation
Fluorescein isothiocyanate or CdSe/ZnS QDs were used to label the AmG and GSs, respectively, for visualization under a fluorescence microscope and were examined by confocal microscopy. Subsequently, cells were seeded in 24-well plates at a density of 1×10⁴ cells per well. After 24 h incubation, the QD-labeled NPs were added at the required concentration. After various periods, the medium was removed, and each well was washed three times with PBS. The cells were fixed with 4% formaldehyde and washed with PBS. The 0.1% Triton X-100 in PBS was added in the well for 15 min. Cytoskeletons were then stained with F-actin for 2 h. Cells were subsequently washed three times in PBS, and then, the nuclei of cells were stained with 1 μg/mL DAPI solution for 1 h. Finally, the stained samples were mounted on clean glass slides using mounting solution and observed by CLSM.
Results and discussion
Synthesis of GSs and THNCs
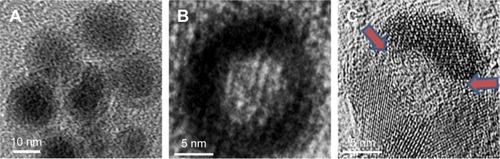
illustrates the fabrication process of THNCs composed of PTX-loaded sub-nanocarrier PHMNPs and AmG. First, by thermal decomposition of Fe(CO)5 in the presence of oleylamine, iron NPs were oxidized into Fe/Fe3O4 core–shell structures, which were used as seeds in . Next, by adding the oxygen transfer reagent, trimethylamine N-oxide, hollow magnetite structure was involved from the Fe/Fe3O4 NPs in . This phenomenon is called the nanoscale Kirkendall effect,Citation23,Citation24 describing the formation of voids at the interface between two materials with different diffusion rates.Citation25 With further treatment at 260°C in the presence of oleic acid and oleylamine, PHMNPs with an average diameter of ~15 nm can be synthesized () due to the extension of the grain boundary under high temperature treatment, where multiple-domain regions on the Fe3O4 shell structure (arrows) can be clearly observed. To make PHMNP therapeutic, PTX as a model drug was encapsulated into the central cavities of the hydrophobic PHMNPs through the nanoprecipitation process as shown in , demonstrating that PHMNPs were dispersed in hydrophobic hexane. In contrast, to reduce PTX leakage and adapt to a physiological hydrophilic environment for sub-nanocarrier penetration, amphiphilic Pluronic F127, a tri-block copolymer containing a central hydrophobic block of polypropylene glycol flanked by two hydrophilic blocks of polyethylene glycol, was coated on the PTX-PHMNPs. The F127 possessed polypropylene glycol to link the oleic acid layer on the PHMNPs and polyethylene glycol ends to make PHMNPs into hydrophilic particles, so that F127-coated PHMNPs (ie, GSs) can be easily dispersed in aqueous condition (). The Fourier-transform infrared spectroscopy spectrum of PHMNPs in indicates that the peak at around 3,000 cm−1 was due to the O−H stretch dimer and the peak at 1,633 cm−1 stood for the stretching vibration of the C=C alkenes. In addition, the peaks at 2,852 and 2,921 cm−1 corresponded to the symmetric and asymmetric CH2 stretching modes, respectively. A strong peak at 3,313 cm−1 suggested chemisorption of oleic acid onto the iron oxide NPs. According to the spectrum of GSs, the broad peak at 3,000 to 3,700 cm−1 was assigned to O−H vibrational mode and another broad peak at 1,095 cm−1 corresponded to C−O−C stretch, indicating the surface of the PHMNPs was coated with F127. In addition, the spectrum of PTX-GSs with the bands at 1,600–1,750, 1,180–1,300 and 630–770 cm−1 indicated that GSs have the ability to carry PTX.
Figure 1 Morphology of magnetite nanoparticles.
Notes: TEM images of (A) Fe/Fe3O4 seed, (B) high-resolution HMNP, and (C) high-resolution PHMNPs. Arrows indicate the pores formed on the Fe3O4 shell of PHMNPs.
Abbreviations: HMNPs, hollow magnetite nanoparticles; PHMNPs, porous hollow magnetite nanoparticles; TEM, transmission electron microscopy.
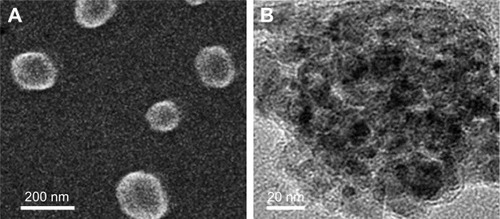
Next, AmG was conjugated on the GS through EDC/NHS to form a GSs–AmG building unit, which can be further used for the synthesis of THNCs with the addition of LST drug into AmG matrix during formation. The morphology of THNCs was further investigated by SEM and TEM. The SEM image in shows that THNC NPs display a homogeneous shape with a uniform diameter of about 140–160 nm. The TEM image of THNCs revealed that many GSs were located within the inner AmG matrix of the THNCs (), illustrating that GSs–AmG building units were assembled to form the THNC as depicted in . The conjugation of AmG on the GSs can be further confirmed by Fourier-transform infrared spectroscopy (), where the peaks at 1,540 and 1,653 cm−1 are assigned to amide bonds. The particle size of GSs was measured to be ~20 nm by dynamic light scatter as shown in . The static magnetization and the hysteretic behavior of PHM-NPs and GSs were measured by Superconducting Quantum Interference Device. As shown in , both displayed similar shape with negligible hysteresis, but GSs with F127 resulted in less saturation magnetization (Ms) compared to PHMNPs.
Figure 2 Morphology of THNCs.
Note: (A) SEM and (B) TEM images of THNCs.
Abbreviations: SEM, scanning electron microscopy; TEM, transmission electron microscopy; THNCs, Trojan Horse nanocarriers.
Drug release of PTX and LST from GSs and THNCs
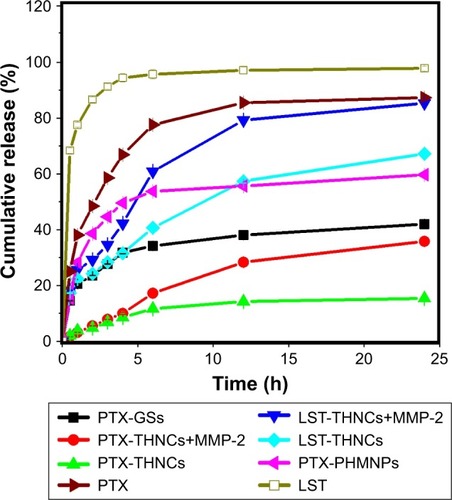
The encapsulation efficiency and drug-loading capacity in GS nanoparticles determined by HPLC were calculated to be approximately 90.48% and 35.19 wt% for PTX. The corresponding EE and LC in THNCs were 95.47% and 0.9 wt% for DOX, and 81.74% and 26.15 wt% for LST, respectively. shows the cumulative drug release profile of PTX and LST from the PHMNPs, GSs, THNCs and THNCs with MMP-2 (THNCs+MMP-2), where the free drug profiles of PTX and LST were provided as a baseline to understand the controllable drug release behavior from the different NPs. Here, it was noted that the PTX release profile of the PTX-GSs was slow compared to that of the PTX-PHMNPs, demonstrating that the Pluronic F127 used to coat the PTX-PHMNPs can protect the PTX from leakage. However, as the GSs were further integrated within AmG to form the THNC structure, a much slower release profile was observed for PTX-THNCs. At 6 h, GSs can release >30% of PTX, but THNCs only release 10% of PTX into the buffer solution, which is attributed to the barrier of AmG causing a slow drug release behavior. In contrast, THNCs with MMP-2 added, PTX-THNCs+MMP-2, showed two-stage drug release behavior with a faster release rate compared to that of PTX-THNCs alone because the AmG layer was degraded by MMP-2. Similarly, PTX release in the THNCs+MMP-2 has to cross the iron oxide shell and AmG matrix, which act as physical barriers to block the drug release, causing a slower drug release rate as compared to LST release. It is worth mentioning that the slow release of PTX naturally is important because the well-encapsulated drug in GSs can avoid side effects and reach efficient penetration and efficacious therapy.
Figure 3 Drug release behaviors of PTX and LST from PHMNPs, GSs, THNCs, and THNC+MMP-2, with free PTX and free LST provided for comparison.
Abbreviations: GSs, Greek soldiers; LST, losartan; MMP-2, matrix metalloproteinase-2; PHMNPs, porous hollow magnetite nanoparticles; PTX, paclitaxel; THNCs, Trojan Horse nanocarriers.
Degradation of THNCs and penetration of GSs
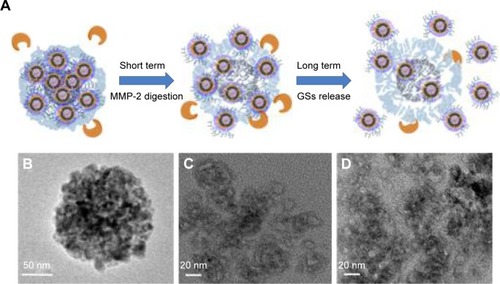
The degradation of AmG matrix is crucial to the size-changing effect and drug release behavior of THNCs, as illustrated in . The degradation behavior of THNCs can be further investigated using TEM to observe the releasing behaviors of GSs and morphology change of THNCs at 0, 6 and 16 h after the addition of MMP-2. In the beginning, THNCs had a perfect solid structure (). However, THNC disintegration under enzymatic digestion is clearly observed in after 6 h, indicating that the enzymatic degradation by MMPs plays a highly favorable trigger mechanism for size reduction. This further confirmed that THNCs could be enzymatically degraded by MMP-2, which is overexpressed at the sites of angiogenesis and the edge of tumors. However, a long enzymatic digestion, such as for 16 h, caused significant disintegration of THNCs for complete liberation of the GSs, as shown in . Such characteristics could enhance the diffusion and penetration of sub-nanocarriers to deep tumor tissue and, thus, improve therapeutic efficiency.
Figure 4 The study of THNCs degradation.
Notes: (A) Schematic mechanism of THNC degradation. TEM image of degraded THNCs at different incubation times: (B) 0 h, (C) 6 h and (D) 16 h.
Abbreviations: GSs, Greek soldiers; MMP-2, matrix metalloproteinase-2; TEM, transmission electron microscopy; THNCs, Trojan Horse nanocarriers.
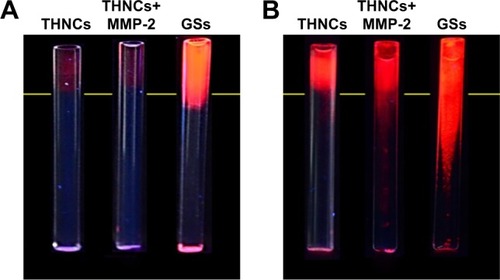
We next evaluated whether the size change of THNCs can enhance diffusive transport in dense collagen environments resembling those in solid tumors. To understand the behavior of THNC degradation and GS penetration, a collagen gel in a capillary tube at 7.4 mg/mL concentration was prepared, which is similar to the estimated density of 9.0±2.5 mg/mL for the interstitial matrix in both murine mammary carcinoma (MCalV) and human colon adenocarcinoma (LS174T) cells implanted in mouse dorsal chambers.Citation26,Citation27 The collagen gel penetration of THNCs before and after cleavage with MMP-2 was carried out to compare the penetration ability, where the GSs were labeled with CdSe/ZnS QDs for easy detection and observation. First, infiltration of both THNCs (with and without MMP-2 degradation) and GSs onto the fibrillar collagen gel was determined. The results in show that THNCs with and without MMP-2 enzymatic degradation (0 h incubation) exhibited negligible penetration, but a slight penetration of GSs into the collagen matrix was observed due to their ultra-small size. However, after 16 h with MMP-2 treatment, THNCs+MMP-2 demonstrated an obvious penetration into the dense collagen gel () in comparison with the group without MMP-2; after cleavage with MMP-2, the liberated GSs were able to penetrate the gel efficiently. A significant penetration from the GSs alone, represented as red (QDs), can be clearly observed through the tube. The penetration rate of GSs alone was even faster than that of digested THNCs (THNCs+MMP-2 group) because any residual AmG fragments remaining on the surface would slightly impede the diffusion. The penetration depth was measured using ImageJ software, and the QD intensity from the GSs alone was 1.7-fold higher than that for THNCs+MMP-2 and 2.4-fold higher than that for THNCs (). These results indicate that highly efficient diffusion in dense collagen with MMP-2 helps THNC degradation and release of GS NPs to overcome the difficulty of diffusion in the ECM.
Figure 5 The simulation of nanocarriers penetration.
Note: Fluorescent images of collagen gel penetration for (A) 0 h incubation and (B) 16 h incubation with THNCs, THNCs+MMP-2 and GSs.
Abbreviations: GSs, Greek soldiers; MMP-2, matrix metalloproteinase-2; THNCs, Trojan Horse nanocarriers.
Cytotoxicity and cellular uptake of GSs and THNCs
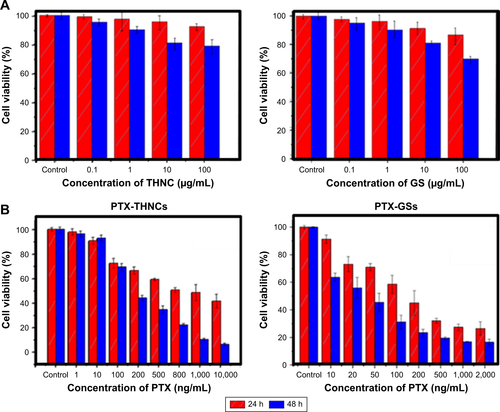
The cytotoxicity of THNCs and GSs was assessed using the human cervical cancer HeLa cell line. The results in imply that HeLa cells incubated with drug-free GSs and THNCs at concentrations of 100, 10, 1 and 0.1 μg/mL remained highly viable compared to the control group for 24 and 48 h, demonstrating that both THNCs and GSs are biocompatible with HeLa cells. In contrast, with PTX loading, GSs and THNCs induced obvious cytotoxicity in Hela cells and the IC50 measured at 24 h incubation was estimated to be 150 ng/mL and 1,000 ng/mL, respectively (). At 48 h of incubation, the IC50 was further reduced to 30 and 200 ng/mL, respectively, indicating that PTX is more easily released from GSs than THNCs.
On the other hand, the cellular uptake into the tumor tissue must be considered when designing a drug delivery system. Flow cytometry was used to quantify the uptake of THNCs and GSs by HeLa cells, as shown in , respectively. We found that HeLa cells exhibited cellular uptake of THNCs after 2 h (), which was attributed to the Arg–Gly–Asp (RGD) motifs on AmG.Citation28 However, the GSs in produced a remarkable increase in fluorescence intensity with time as compared to THNCs, which may be attributed to the smaller particle size and Pluronic F127 surface coating on the GSs. This result reveals that the GS sub-nanocarrier released from the THNC system can more efficiently penetrate into a complex tumor and enhance the uptake of HeLa cells after the AmG is digested by MMP-2. To further evaluate the uptake efficiency of GSs and THNCs, GSs were labeled with QDs (λex: 545 nm, λem: 560 nm, full width half maximum <40 nm) and then incubated with HeLa cells. The fluorescence images in show the cell association behavior between the QD-labeled THNCs and HeLa cells for various incubation periods, where the blue spheres indicate cell nuclei, the green fibrous parts stand for actin and the red dots are the QD-labeled GSs. THNCs appeared to show no clear attachment to the surface on the cell membranes at 0.5 h incubation. After 6 h, a few THNCs migrated to the cytoplasm, but with a long incubation time of 24 h, the cell uptake of THNCs increased in the cytoplasm.
Figure 6 Cellular uptake behavior of THNCs and GSs.
Notes: Flow cytometry analysis of the cellular uptake efficiency for HeLa cells incubated with (A) THNCs and (B) GSs for 2, 4, 6 and 24 h. Cellular uptake of HeLa cells incubated with (C) THNCs and (D) GSs for 0.5, 6 and 24 h, where the blue spot is the plasma membrane of the HeLa cells, green is the cytoskeleton and red indicates the QD-labeled GSs.
Abbreviations: GSs, Greek soldiers; QDs, quantum dots; THNCs, Trojan Horse nanocarriers.
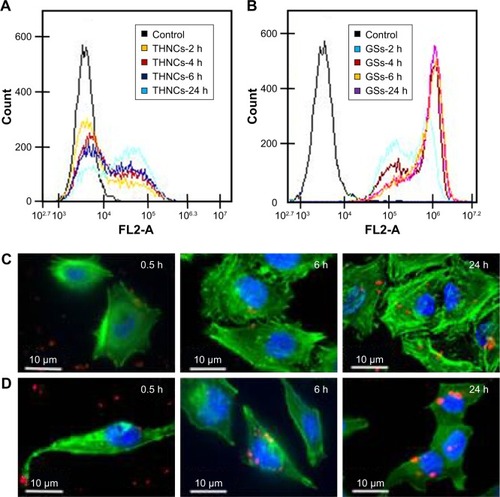
In contrast, according to the fluorescence images in , we observed red dots in the HeLa cells at 0.5 h. Although GSs did not conjugate with any targeting ligand, the HeLa cells still showed an apparent increase in uptake efficiency. After 6 h of incubation, the cytoplasm displayed considerably strong red fluorescence. This phenomenon is pretty consistent with the result shown in .
In vitro penetration of sub-nanocarriers into the tumor tissue
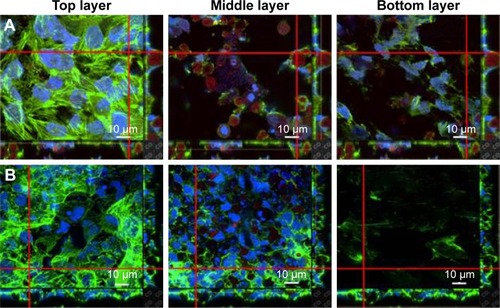
The penetration of nanocarriers into deep tumor tissue is important to overcome the accumulation in a complex tumor microenvironment. An in vitro thick tumor sphere model constructed using a HeLa cell line was used to investigate the penetration of GSs and PHMNPs (without surface modification) following the fabrication of Su et al.Citation29 shows the confocal image of the tumor spheroid at different penetration depths after 24 h incubation with GSs and PHMNPs, where both nanocarriers were labeled with QDs. As illustrated in , most of the GSs were trapped in the middle layer (about 15 μm) of the tumor spheroid model and even partial GSs penetrated into the bottom layer (about 30 μm). In contrast, shows that after 24 h incubation, although PHMNPs could still penetrate the top to the middle layer of the tumor model, fewer PHMNPs (red) in the middle layer can be detected compared to GSs (). However, we did not see any PHMNPs in the bottom layer of the tumor model. The results demonstrated that GSs with a surface modification of hydrophilic F127 can provide better penetration into the deep tumor regions through the complex hydrophilic tumor microenvironment, compared to PHMNPs.
Figure 7 The difference between GSs and PHMNPs in tumor spheroid model.
Note: Confocal images of tumor spheroid model treated with (A) GSs and (B) PHMNPs at different penetration depths after 24 h incubation.
Abbreviations: GSs, Greek soldiers; PHMNPs, porous hollow magnetite nanoparticles.
In vitro cytotoxicity of GS and THNC penetration in 3D tumor spheroid
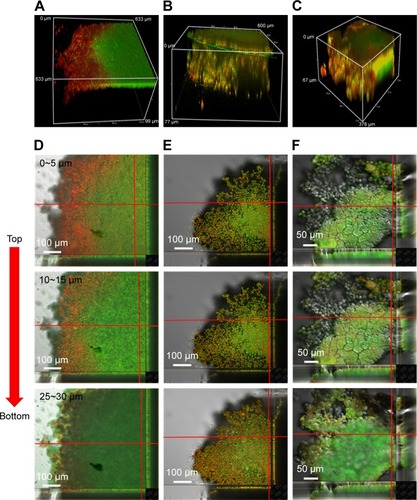
To help us understand the more realistic cytotoxicity situation occurring with in vivo tumors subjected to PTX drug release from both GSs and THNCs, we incubated the 3D tumor spheroid with PTX-THNCs, PTX-THNCs+MMP-2 and PTX-GSs for 24 h to observe the therapeutic efficacy using the LIVE/DEAD Cell Viability Assays, in which red represents dead cells and green represents live cells. For comparison, PTX-THNCs+MMP-2 was added with MMP-2 for 6 h. As shown in the 3D confocal image of , most of the PTX-THNCs (without MMP-2 treatment) were restricted to the top of the tumor spheroid because no AmG cleavage occurred to reduce the particle size. As a result, only the tumor cells at the top and along the edge of the 3D tumor spheroid died, but tumors in the deep area were still alive. In addition, all of the tumor cells in the tumor spheroid retained a compact solid morphology. In contrast, with MMP-2 pretreatment for 6 h before incubation with tumor spheroid, PTX-THNCs+MMP-2 showed more effective permeability () compared to that of PTX-THNCs (). This can be explained by the fact that with the aid of MMP-2 digestion and sub-nanocarrier GS release, the drug could more easily penetrate into the deep region, resulting in an improved therapeutic effect. The dead cells were not only restricted to the surface, but also observed in a slightly deep region. In contrast, the PTX-GSs alone not only had a similar penetration effect, but also induced more severe damage in the tumor spheroid because of an F127-modified hydrophilic surface and efficient drug delivery. It was noted that the tumor spheroid size became smaller (spheroid diameter changed from ~600 to ~378 μm) and its skeleton structure collapsed ().
Figure 8 The cytotoxicity of PTX-loaded nanocarriers in tumor spheroid model.
Notes: Confocal 3D image of LIVE/DEAD® cell viability assays for (A) PTX-THNCs, (B) PTX-THNCs+MMP-2 and (C) PTX-GSs incubated with HeLa tumor spheroids for 24 h, and cross-sections of the confocal images for (D) PTX-THNCs, (E) PTX-THNCs+MMP-2 and (F) PTX-GSs incubated with HeLa tumor spheroids for 24 h.
Abbreviations: GSs, Greek soldiers; MMP-2, matrix metalloproteinase-2; PTX, paclitaxel; THNCs, Trojan Horse nanocarriers.
Scheme 1 Schematic illustration for the (A) delivery mechanism and (B) synthesis of “Trojan Horse” nanocarriers (THNCs).
Abbreviations: Am, amphiphilic; EDC, 1-ethyl-3-(3-dimethylaminopropyl) carbodiimide hydrochloride; GS, Greek soldier; LST, losartan; MMP-2, matrix metalloproteinase-2; NHS, N-hydroxysuccinimide; PEO, poly(ethylene oxide); PHMNPs, porous hollow magnetite nanoparticles; PPO, poly(propylene oxide); PTX, paclitaxel; THNCs, Trojan Horse nanocarriers.
To further observe the cell morphology and cytotoxicity at different depths in the above-mentioned tumor spheroid, we used a confocal microscope to analyze each cross-sectional image with depth. As shown in , dead cells were only observed in the top surface image within 15 μm in the PTX-THNCs–treated tumor spheroid. The image in the middle region showed all cells alive and the bottom was darker because of the thicker tumor spheroid interfering with the laser. In , many killed tumor cells were detected in the center position (25–30 μm) for both PTX-THNCs+MMP-2 and PTX-GSs. More importantly, the tumor spheroids could not be completely maintained and they almost disintegrated, indicating that GSs liberated from the THNCs can indeed improve NP penetration and drug accumulation in the deep tumor tissue to achieve an efficacious antitumor effect.
Conclusion
In summary, we developed a size-changeable dual-drug THNC delivery system that resulted in enhanced penetration of PTX-loaded magnetic GSs with efficient delivery of PTX drug into the deep tumor tissue. The THNCs developed here can provide the following benefits: 1) controllable degradation for inducing the size change of the nanomedicine, 2) PTX-loaded magnetic GSs with hydrophilic Pluronic F127 modification for enhancing the penetration efficiency in the deep tumor, 3) loading different physicochemical drugs for controlled release, and 4) high biocompatibility. As expected, the dual-drug THNCs nanomedicines that combine multiple hydrophobic/hydrophilic drugs can enhance the penetration and accumulate drug in deep tumor tissue and open new avenues for various cancer treatments, leading to possible clinical applications.
Acknowledgments
This work was financially supported by the Ministry of Science and Technology, Republic of China, Taiwan under Contract of MOST 105-2221-E-009-024-MY3.
Supplementary materials
Figure S1 Solubility of PHMNPs and GSs.
Abbreviations: GSs, Greek soldiers; PHMNPs, porous hollow magnetite nanoparticles.
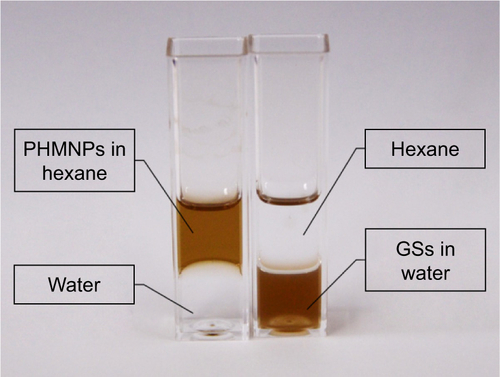
Figure S2 Surface characteristics of nanocarriers.
Note: FTIR spectra of (A) PHMNPs (black), GSs (blue), F127-COOH (red), PTX-loaded GSs (green); (B) GS (blue), GS–AmG (red).
Abbreviations: AmG, amphiphilic gelatin; FTIR, Fourier-transform infrared spectroscopy; GSs, Greek soldiers; PHMNPs, porous hollow magnetite nanoparticles; PTX, paclitaxel.
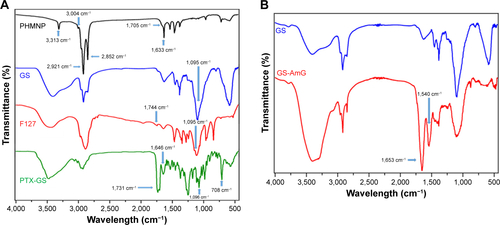
Figure S3 Particle size distribution profiles of nanocarriers in aqueous solution measured by DLS.
Abbreviations: DLS, dynamic light scatter; GSs, Greek soldiers; THNCs, Trojan Horse nanocarriers.
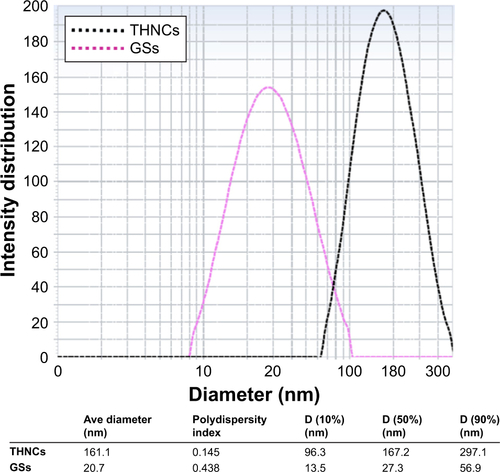
Figure S4 SQUID curves of GSs and PHMNPs.
Abbreviations: GSs, Greek soldiers; PHMNPs, porous hollow magnetite nanoparticles; SQUID, Superconducting Quantum Interference Device.
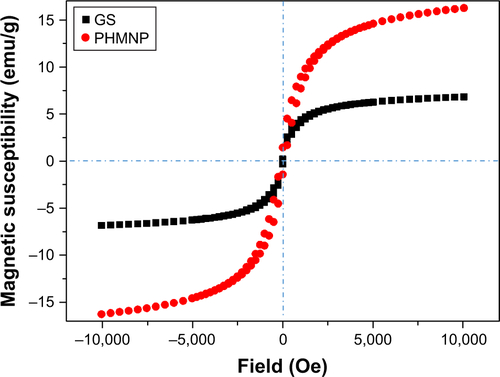
Figure S5 ImageJ analysis of collagen gel penetration in 16 h of incubation.
Abbreviations: GSs, Greek soldiers; MMP-2, matrix metalloproteinase-2; THNCs, Trojan Horse nanocarriers.
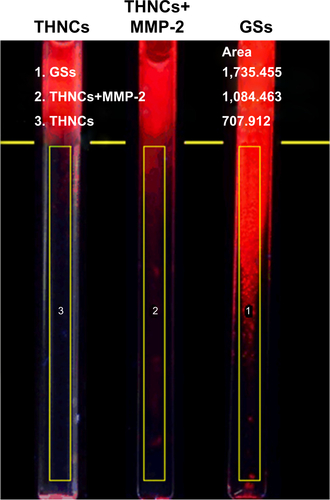
Figure S6 The cytotoxicity of THNCs, GSs and PTX-loaded, respectively.
Note: Cell viability of HeLa cells incubated with (A) empty THNCs and GSs and (B) PTX-THNCs and PTX-GSs for 24 and 48 h.
Abbreviations: GSs, Greek soldiers; MMP-2, matrix metalloproteinase-2; PTX, paclitaxel; THNCs, Trojan Horse nanocarriers.
Disclosure
The authors report no conflicts of interest in this work.
References
- DuncanRPolymer conjugates as anticancer nanomedicinesNat Rev Cancer20066968870116900224
- PeerDKarpJMHongSFarokhzadOCMargalitRLangerRNanocarriers as an emerging platform for cancer therapyNat Nano2007212751760
- ChauhanVPStylianopoulosTBoucherYJainRKDelivery of molecular and nanoscale medicine to tumors: transport barriers and strategiesAnnu Rev Chem Biomol Eng2011228129822432620
- ShiJVotrubaARFarokhzadOCLangerRNanotechnology in drug delivery and tissue engineering: from discovery to applicationsNano Lett20101093223323020726522
- NicholsJWBaeYHOdyssey of a cancer nanoparticle: from injection site to site of actionNano Today20127660661823243460
- WaiteCLRothCMNanoscale drug delivery systems for enhanced drug penetration into solid tumors: current progress and opportunitiesCrit Rev Biomed Eng2012401214122428797
- JainRKStylianopoulosTDelivering nanomedicine to solid tumorsNat Rev Clin Oncol201071165366420838415
- LongmireMChoykePLKobayashiHClearance properties of nanosized particles and molecules as imaging agents: considerations and caveatsNanomedicine (Lond)20083570371718817471
- BaruaSMitragotriSChallenges associated with penetration of nanoparticles across cell and tissue barriers: a review of current status and future prospectsNano Today20149222324325132862
- GoodmanTTOlivePLPunSHIncreased nanoparticle penetration in collagenase-treated multicellular spheroidsInt J Nanomedicine20072226527417722554
- WongCStylianopoulosTCuiJMultistage nanoparticle delivery system for deep penetration into tumor tissueProc Natl Acad Sci U S A201110862426243121245339
- JuCMoRXueJSequential intra-intercellular nanoparticle delivery system for deep tumor penetrationAngew Chem Int Ed2014532462536258
- KhawarIAKimJHKuhHJImproving drug delivery to solid tumors: priming the tumor microenvironmentJ Control Release2015201788925526702
- ZhangBShiWJiangTOptimization of the tumor microenvironment and nanomedicine properties simultaneously to improve tumor therapyOncotarget2016738626076261827566585
- LaiC-YFiteBZFerraraKWUltrasonic enhancement of drug penetration in solid tumorsFront Oncol2013320423967400
- SuYLFangJHLiaoCYLinCTLiYTHuSHTargeted mesoporous iron oxide nanoparticles-encapsulated perfluorohexane and a hydrophobic drug for deep tumor penetration and therapyTheranostics20155111233124826379789
- NieSUnderstanding and overcoming major barriers in cancer nanomedicineNanomedicine (Lond)20105452352820528447
- MinchintonAITannockIFDrug penetration in solid tumoursNat Rev Cancer20066858359216862189
- KwonIKLeeSCHanBParkKAnalysis on the current status of targeted drug delivery to tumorsJ Control Release2012164210811422800574
- ToroseanSFlynnBAxelssonJNanoparticle uptake in tumors is mediated by the interplay of vascular and collagendensity with interstitial pressureNanomedicine20139215115822841910
- ChauhanVPMartinJDLiuHAngiotensin inhibition enhances drug delivery and potentiates chemotherapy by decompressing tumour blood vesselsNat Commun20134251624084631
- LuPTakaiKWeaverVMWerbZExtracellular matrix degradation and remodeling in development and diseaseCold Spring Harb Perspect Biol2011312a00505821917992
- LiJZengHCHollowing Sn-doped TiO2 nanospheres via ostwald ripeningJ Am Chem Soc200712951158391584718047331
- LouXWArcherLAYangZHollow Micro-/nanostructures: synthesis and applicationsAdv Mater2008202139874019
- PengSSunSSynthesis and characterization of monodisperse hollow Fe3O4 nanoparticlesAngew Chem Int Ed Engl200746224155415817469084
- NettiPABerkDASwartzMAGrodzinskyAJJainRKRole of extracellular matrix assembly in interstitial transport in solid tumorsCancer Res20006092497250310811131
- RamanujanSPluenAMcKeeTDBrownEBBoucherYJainRKDiffusion and convection in collagen gels: implications for transport in the tumor interstitiumBiophys J20028331650166012202388
- AmijiMMPolymeric Gene Delivery: Principles and ApplicationsUSACRC Press2004
- SuY-LChenK-TSheuY-CThe penetrated delivery of drug and energy to tumors by lipo-graphene nanosponges for photolytic therapyACS Nano2016101094209433