Abstract
Background
Stem cells can differentiate into multiple cell types, and therefore can be used for cellular therapies, including tissue repair. However, the participation of stem cells in tissue repair and neovascularization is not well understood. Therefore, implementing a noninvasive, long-term imaging technique to track stem cells in vivo is needed to obtain a better understanding of the wound healing response. Generally, we are interested in developing an imaging approach to track mesenchymal stem cells (MSCs) in vivo after delivery via a polyethylene glycol modified fibrin matrix (PEGylated fibrin matrix) using MSCs loaded with gold nanoparticles as nanotracers. The objective of the current study was to assess the effects of loading MSCs with gold nanoparticles on cellular function.
Methods
In this study, we utilized various gold nanoparticle formulations by varying size and surface coatings and assessed the efficiency of cell labeling using darkfield microscopy. We hypothesized that loading cells with gold nanotracers would not significantly alter cell function due to the inert and biocompatible characteristics of gold. The effect of nanoparticle loading on cell viability and cytotoxicity was analyzed using a LIVE/DEAD stain and an MTT assay. The ability of MSCs to differentiate into adipocytes and osteocytes after nanoparticle loading was also examined. In addition, nanoparticle loading and retention over time was assessed using inductively coupled plasma mass spectrometry (ICP-MS).
Conclusion
Our results demonstrate that loading MSCs with gold nanotracers does not alter cell function and, based on the ICP-MS results, long-term imaging and tracking of MSCs is feasible. These findings strengthen the possibility of imaging MSCs in vivo, such as with optical or photoacoustic imaging, to understand better the participation and role of MSCs in neovascularization.
Introduction
Stem cells are advantageous in that they can potentially be used for cellular therapies due to the fact that they can differentiate into multiple cell types,Citation1 including cardiovascular cells.Citation2–Citation5 Previous work by our group demonstrated that PEGylated fibrin gels promote mesenchymal stem cell (MSC) tubulogenesis and differentiation towards a vascular cell type.Citation4 These findings suggest MSCs could potentially be delivered to an injury site after an ischemic event in order to assist in neovascularization and tissue repair.Citation3–Citation7 However, the exact mechanisms of vascular repair, as well as the role and extent of participation of MSCs in neovascularization, are not well understood.
To this end, there have been numerous proposed approaches for long-term tracking of stem cells in vivo. A majority of this research has focused on labeling MSCs in vitro, delivering the MSCs in vivo, and sacrificing the animals at various time points and performing histology.Citation8 However, a major issue with this methodology is the inability to track the cells within a single, live animal model over time. As a result, many investigators have turned to noninvasive imaging modalities which are capable of monitoring and tracking stem cells within a single model over time.Citation9–Citation11
The imaging approaches previously investigated require use of contrast agents to label the cells. Efficient cell labeling with contrast agents is necessary in order to image and track MSCs adequately. For long-term imaging, it is desirable to have contrast agents which have long-term stability, are not toxic to the cells, and do not affect cell function. Radionuclides have short half-lives,Citation12 and thus are not ideal for long-term imaging studies. Reporter genes indirectly label cells and are not diluted as a result of cell division.Citation13 However, the cells need to be genetically manipulated, which could alter cell function, and a substrate must be administered intravenously for each imaging session.Citation13 Nanoparticles provide an advantage over radionuclides, in that they can be used for long-term imaging and allow for repeated imaging over time.Citation12,Citation14–Citation17 Although nanoparticle labeling can decrease over time due to cell division, certain nanoparticle materials, such as gold, are not toxic to the cellsCitation16 and do not alter cell function.
Taking into account the advantages and disadvantages of the various contrast agents which can be employed, we are interested in investigating gold nanoparticles to be used as contrast agents. We propose to use gold nanoparticles as contrast agents because of their optically tunable properties and inert characteristics. In addition, photoacoustic imaging can be used to image cells labeled with gold nanoparticles.Citation18,Citation19 Photoacoustic imaging can be used for in vivo imaging at reasonable depths,Citation20 as well as for longitudinal studies.Citation21,Citation22 Specifically, the long-term goal of our study is to assess optically how MSCs delivered in vivo via a PEGylated fibrin gel participate in the process of neovascularization. In this study, we assessed the efficiency of MSC labeling with gold nanotracers and the effects of nanoparticle loading on cell function. We determined initial nanoparticle loading and retention over time in order to assess the feasibility of long-term imaging of MSCs. This study provides a first step in achieving the goal of tracking the migration of MSCs delivered in vivo using PEGylated fibrin gels in order to assess the role of MSCs in the process of neovascularization and tissue repair. A better understanding of the process of neovascularization, and the extent to which MSCs participate in this process, can potentially lead to the development of better therapies and therapeutics, and specifically therapies involving MSCs, for tissue repair.
Methods and materials
Human MSC culture
Human MSCs (Lonza, Walkersville, MD) were cultured in Dulbecco’s Modified Eagle Medium (DMEM, Invitrogen, Carlsbad, CA) supplemented with 10% fetal bovine serum, 1% glutamax, and 1% penicillin-streptomycin. The cell culture medium was changed every 2–3 days. Cells were passaged using 0.25% trypsin/ethylenediamine tetra-acetic acid (Lonza), collected by centrifugation at 600 × g for seven minutes, and counted with Trypan Blue exclusion. For all experiments, cells were seeded at a density of 5000 cells/cm2. Cells were grown under standard cell culture conditions (37° C, 5% CO2). Passage 5–8 human MSCs were used in this study.
Nanoparticle synthesis
Gold nanoparticles were synthesized via citrate reduction of tetrachloroauric (III) acid (HAuCl4) under reflux. Briefly, 100 mL of distilled water was heated to 100°C, and 1 mL of 10 mg/mL HAuCl4 was added while stirring. Sodium citrate (11.4 mg/mL) dissolved in distilled water was then added. Gold nanoparticles of various sizes (20 nm, 40 nm, and 60 nm) were synthesized by varying the volume of sodium citrate, ie, 2 mL of sodium citrate solution was added for 20 nm nanoparticles, 1 mL of sodium citrate solution was added for 40 nm nanoparticles, and 0.6 mL of sodium citrate solution was added for 60 nm nanoparticles. Gold nanoparticles were coated with poly-L-lysine (1–5 kD) by adding 0.3 mg of poly-L-lysine/mL of nanoparticle solution and allowed to mix for 30 minutes. The nanoparticles were then centrifuged at 3200 × g for 30 minutes in order to remove the excess poly-L-lysine. Poly-L-lysine hydrobromide (Sigma-Aldrich, St. Louis, MO) was dissolved in distilled water prior to use.
Nanoparticle characterization
A DelsaNano (Beckman Coulter Inc, Brea, CA) was used to determine the size and zeta potential of citrate-stabilized and poly-L-lysine-coated gold nanoparticles in water and in media. Briefly, nanoparticle solutions were loaded into a glass cuvette and readings were taken at a temperature of 25°C. For size measurements, five repetitions were performed for each nanoparticle solution, with 60 readings per repetition. For zeta potential measurements, three repetitions were performed for each nanoparticle solution, with five readings per repetition.
A FEI Tecnai transmission electron microscope fitted with a top mount AMT Advantage HR 1k × 1k digital camera was used to determine the size and shape of citrate-stabilized and poly-L-lysine-coated gold nanoparticles in water and in media. Images were taken at 135k× magnification. Prior to imaging, carbon-coated copper 300 mesh grids (Electron Microscopy Sciences, Hatfield, PA) were placed in the nanoparticle solutions and allowed to incubate for approximately two minutes. The grids were then removed from the solution and allowed to dry.
Nanoparticle incubation and assessment of cell uptake
Cells were cultured as described earlier. Nanoparticle medium was made by centrifuging the nanoparticle solutions (5000 × g for 15 minutes for 20 nm citrate-stabilized nanoparticles and 3220 × g for 30 minutes for all other nanoparticle solutions) and resuspending the pellet in phenol red free medium at a concentration of approximately 1012 nanoparticles/mL. MSC growth medium was aspirated from the flasks, and 200 μL/cm2 of nanoparticle medium was added to the cell culture and allowed to incubate for 24 hours. After 24 hours, the nanoparticle medium was removed and the cells were washed with phosphate-buffered saline. A Leica DMI2000B microscope equipped with a Leica DFC290 camera was used to obtain darkfield images (20× magnification) in order to assess nanoparticle uptake.
LIVE/DEAD staining
In order to assess cell viability after nanoparticle uptake, a LIVE/DEAD stain was performed. Briefly, stock solutions of calcein AM (4 mM) and ethidium homodimer-1 (2 mM) were diluted in phosphate-buffered saline to a final working concentration of 4 μM and 1 μM, respectively. MSC growth medium was removed from the wells, and the cells were washed twice in phosphate-buffered saline. The cells were then incubated in the LIVE/DEAD stain for 45 minutes at 37°C, after which they were washed twice in phosphate-buffered saline. The stained cells were then imaged using fluorescence microscopy (Leica DMI2000B microscope equipped with a Leica DFC290 camera) under 10× magnification. Control cells consisted of cells not incubated with nanoparticles. Cell viability was assessed at various time points over a two-week period.
MTT assay
A Sigma-Aldrich MTT cell proliferation assay kit was used to perform the MTT assay. Briefly, MTT reagent was added to cells at a ratio of 100 μL/mL of medium. The samples were incubated for three hours at 37°C. The detergent reagent was then used to lyse the cells. A universal microplate reader ELX800 (Bio-Tek Instruments Inc, Winooski, VT) was used to measure the absorbance values of the samples at 562 nm and a reference wavelength of 630 nm. Control cells consisted of cells not incubated with nanoparticles. A blank sample containing no cells was used and subtracted from all measurements. Cytotoxicity was assessed over a one-week period at various time points. Triplicate samples were used and the assay was performed twice.
The number of cells was calculated using a standard curve. A one-way analysis of variance, followed by t-tests for multiple comparisons, was used to compare the experimental conditions with the control condition at the same time point (P < 0.01).
MSC differentiation
The ability of the cells to exhibit bipotent proliferation (ie, adipogenic and osteogenic) after nanoparticle uptake was assessed for all nanoparticle conditions. Control cells consisted of cells not incubated with nanoparticles and which were induced to differentiate into the specified lineages. Negative control cells consisted of cells not incubated with nanoparticles and which were not induced to differentiate into the specified lineages.
Briefly, adipogenesis was induced by plating cells at a density of 2.1 × 10⁴ cells/cm2 and allowing the cells to grow to confluence in MSC growth medium. After the cultures reached 100% confluence, the MSC growth medium was replaced with adipogenic induction medium (DMEM, 10% fetal bovine serum, 1% penicillin-streptomycin, 1% glutamax, 1 μM dexamethasone [Sigma-Aldrich], 10 μg/mL 3-isobutyl-1-methylxanthine [Sigma-Aldrich], 10 μg/mL insulin [Sigma-Aldrich], and 100 μM indomethacin [Sigma-Aldrich]). After three days, the adipogenic induction medium was replaced with adipogenic maintenance medium for one day (DMEM, 10% fetal bovine serum, 1% penicillin-streptomycin, 1% glutamax, and 10 μg/mL insulin). Three cycles of induction/maintenance were performed, after which the cells were incubated in adipogenic maintenance medium for seven days. Control cells were supplemented only with adipogenic maintenance medium. Oil red O (Sigma-Aldrich) staining was used to assess adipogenesis. The cells were fixed in 10% formalin and then incubated in 60% isopropanol for four minutes. The cells were then incubated in oil red O staining solution for five minutes, rinsed in tap water, and counterstained in hematoxylin for one minute. After washing with tap water, the slides were mounted and viewed under phase contrast using a Leica DMI2000B microscope equipped with a Leica DFC290 camera (20× magnification).
Osteogenesis was induced by plating cells at a density of 3.1 × 10³ cells/cm2. The cells were allowed to adhere for 24 hours in MSC growth medium, after which the medium was replaced with osteogenic induction medium (DMEM, 10% fetal bovine serum, 1% penicillin-streptomycin, 1% glutamax, 50 μg/mL ascorbic acid, 100 nM dexamethasone [Sigma-Aldrich], and 10 mM beta-glycerophosphate disodium salt hydrate [Sigma-Aldrich]). Osteogenesis was induced over a period of two weeks, after which a Fisher von Kossa staining kit was used to assess osteogenesis. The cells were fixed in 10% formalin and then incubated in 5% silver nitrate for 40 minutes with exposure to ultraviolet light. The cells were washed in distilled water and then placed in 5% sodium thiosulfate for two minutes, after which they were rinsed in tap water and placed in nuclear fast red stain for five minutes. After washing with tap water, the slides were mounted and viewed under brightfield using a Leica DMI2000B microscope equipped with a Leica DFC290 camera (20× magnification).
Inductively coupled plasma mass spectrometry
Initial nanoparticle loading and retention over a two-week period was assessed for cells incubated with 20 nm citrate-stabilized nanoparticles using inductively coupled plasma mass spectrometry (ICP-MS). Cells were cultured and incubated with nanoparticles for 24 hours as described above. After 24 hours, the nanoparticle medium was removed and the cells were washed twice with phosphate-buffered saline. The cells were then incubated in MSC growth medium without nanoparticles and collected at the designated time points. Cell medium was changed every 2–3 days with MSC growth medium, and the cells were passaged after reaching about 80% confluence.
At the designated time points, the cells were collected, centrifuged, and resuspended in 300 μL of 70% nitric acid and incubated at 60°C for 14 hours, after which the cells were diluted 100× in distilled water. A standard curve was used to quantify the amount of gold in the cells. Briefly, standard solutions were made by diluting AAS gold standard (Sigma-Aldrich) in the same background solution as that of the cell solutions. All measurements were made using triplicate samples.
Results
Nanoparticle characterization
Nanoparticle size was analyzed using transmission electron microscopy (TEM) and dynamic light scattering (DLS). In addition, nanoparticle shape and zeta potential were assessed using TEM and DLS, respectively. Using DLS, the average size of the three nanoparticle formulations (ie, citrate-stabilized nanoparticles in water) were determined to be 23.1 ± 4.14 nm, 49.78 ± 9.18 nm, and 57.58 ± 10.72 nm (see ), and were designated as 20 nm, 40 nm, and 60 nm, respectively. In addition, representative TEM images of 20 nm, 40 nm, and 60 nm citrate-stabilized nanoparticles in water are shown in , respectively.
Table 1 Average nanoparticle diameter
Figure 1 Representative transmission electron microscope images of A) 20 nm, B) 40 nm, and C) 60 nm citrate-stabilized gold nanoparticles in water. Scale bars 100 nm.
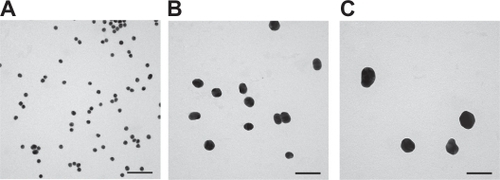
Coating the gold nanoparticles with poly-L-lysine caused the zeta potential of the nanoparticles in water to go from negatively charged (approximately −30 mV) to positively charged (approximately +30 mV for 40 nm and 60 nm poly-L-lysine and +14 mV for 20 nm poly-L-lysine), as determined using DelsaNano (results not shown). There was also a slight increase in the average size of the nanoparticles after coating with poly-L-lysine (see ). It should be noted that 20 nm particles were most likely to undergo aggregation in the presence of poly-L-lysine, which may be attributed to cross-linking of nanoparticles by poly-L-lysine. This effect is observed for the smaller particles because, as the size of the nanoparticle decreases, the relative concentration of nanoparticles/mL upon synthesis increases as the third power of the ratio of nanoparticle diameters. As a result, a lower amount of poly-L-lysine per nanoparticle was added for the 20 nm particles compared with the 40 nm and 60 nm particles, which could result in insufficient coating of the smaller sized nanoparticles and thus formation of aggregates. To test this hypothesis, we varied the concentration of poly-L-lysine used to coat 20 nm gold nanoparticles and found that increased poly-L-lysine concentration resulted in decreased nanoparticle aggregation (results not shown).
MSC nanoparticle loading
MSC nanoparticle loading was assessed using darkfield microscopy. Control cells were not incubated with nanoparticles and appear as a faint blue (). Due to the faint appearance of the control cells under darkfield, a phase contrast image of the control cells is provided in to verify the presence of cells.
Figure 2 Darkfield images (exposure time 257.3 msec) of mesenchymal stem cells incubated for 24 hours with B) 20 nm citrate-stabilized (CS), C) 20 nm poly-L-lysine (PLL), D) 40 nm citrate-stabilized, E) 40 nm poly-L-lysine, F) 60 nm citrate-stabilized, and G) 60 nm poly-L-lysine media. A) A control darkfield image and A1) phase-contrast image of mesenchymal stem cells not incubated with nanoparticles is shown for comparison. Scale bars 100 μm.
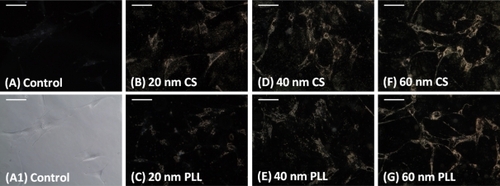
Nanoparticle-loaded cells appear a yellow-orange color when observed under darkfield microscopy, as compared with cells not loaded with nanoparticles, which appear blue. The darkfield images show that cells were loaded with 20 nm, 40 nm, and 60 nm citrate-stabilized nanoparticles after 24 hours of incubation (, respectively), as evidenced by the yellow-orange appearance of the cells. In addition, cells were loaded with 20 nm, 40 nm, and 60 nm poly-L-lysine-coated nanoparticles after 24 hours of incubation (, respectively), as evidenced by the yellow-orange appearance of the cells.
Cells incubated with 20 nm, 40 nm, and 60 nm gold nanoparticles coated with polyethylene glycol did not exhibit nanoparticle uptake, as evidenced by the lack of yellow-orange color of the cells (results not shown). Instead, cells incubated with polyethylene glycol coated nanoparticles (PEGylated nanoparticles) more closely resembled the control cells. However, MSC nanoparticle loading was not expected for cells incubated with PEGylated nanoparticles because of the well documented evidence for polyethylene glycol as a stealthing agent.Citation23,Citation24 Due to the fact that the nanoparticle formulations used in this study did not incorporate targeting agents (eg, targeting antibodies), nanoparticle uptake by cells was passive, and thus MSCs were unable to detect and passively uptake PEGylated nanoparticles.
MSC viability and cytotoxicity
MSC viability and cytotoxicity after nanoparticle loading was assessed using a LIVE/DEAD stain and an MTT assay. The effect of nanoparticle loading on MSC viability was assessed over a two-week period at various time points. The time points (day 1, day 7, and day 14) correspond to the number of days after initial nanoparticle incubation. The results of the LIVE/DEAD assay are shown in . Green cells were considered live and red cells were considered dead. Control cells were not incubated with nanoparticles. As evident from the representative LIVE/DEAD images in , the cells remained viable for all nanoparticle formulations over a two-week period, and there was minimal cell death present (indicated by white arrows).
Figure 3 After 24 hours of incubation with nanoparticles, the particles were removed and LIVE/DEAD and MTT assays were performed. A) Representative LIVE/DEAD images of cells incubated with nanoparticles for 24 hours and assessed at various time points after nanoparticle removal over a two-week period. Cells which appear green were considered live and those which appear red were considered dead (indicated by white arrows). Scale bar 100 μm. B) An MTT assay was used to assess nanoparticle cytotoxicity by quantifying cell number over a one-week period using a plate reader at 562 nm. Data are shown as mean ± standard error. Significantly lower differences in cell number from the control for the corresponding day are indicated by an asterisk (P < 0.01).
Abbreviations: CS, citrate-stabilized; PLL, poly-L-lysine.
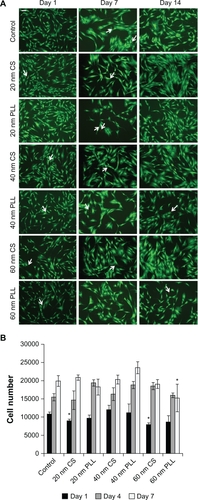
Nanoparticle cytotoxicity was assessed at various time points over a one-week period using an MTT proliferation assay. The time points (day 1, day 4, and day 7) correspond to the number of days after initial nanoparticle incubation. The cell numbers were quantified using a spectrophotometer and a standard curve. Control cells were not incubated with nanoparticles. The results for the MTT assay are shown in . It should be noted that the nanoparticles loaded within the cells did not contribute to the ultraviolet-visible spectrophotometry readings (results not shown). Cell numbers for the various nanoparticle formulations were statistically compared with the control condition for the corresponding day. It was found for day 1 that cells loaded with 20 nm and 60 nm citrate-stabilized nanoparticles had a significantly lower cell number compared with control cells (P < 0.01). In addition, on day 7, cells loaded with 60 nm poly-L-lysine nanoparticles had a significantly lower cell number compared with control cells (P < 0.01). It should be noted that some conditions (day 4, 60 nm citrate-stabilized, 20 nm poly-L-lysine, 40 nm poly-L-lysine; day 7, 40 nm poly-L-lysine) had a significantly higher cell number compared with the control for the corresponding time point, the cause for which is not known at this time.
MSC differentiation
The bipotent ability of MSCs to differentiate into adipogenic and osteogenic lineages after nanoparticle loading was assessed in order to determine if MSC function was maintained after nanoparticle loading. Control (+) cells were not incubated with nanoparticles and were induced to differentiate, and control (−) cells were not incubated with nanoparticles and were not induced to differentiate.
shows the results of oil red O staining for assessing adipogenesis. Fatty lipid deposits were stained red (indicated by white arrows) and are indicative of adipogenesis. The ability of MSCs to differentiate into adipocytes was maintained for all nanoparticle formulations, as qualitatively assessed by comparing the control images with the nanoparticle-loaded MSC images. As expected, control (−) cells did not exhibit any lipid deposits, as indicated by the negative staining.
Figure 4 The bipotent ability of mesenchymal stem cells to differentiate into adipogenic and osteogenic lineages was assessed after 24 hours of nanoparticle incubation. Control cells were not incubated with nanoparticles. Control (+) cells were induced to differentiate and control (−) cells were not induced to differentiate. A) Oil red O staining was used to assess adipogenic differentiation by staining for lipid deposits (white arrows). B) von Kossa staining was used to assess osteogenic differentiation by staining for calcium deposits (red arrows). Scale bar 100 μm.
Abbreviations: CS, citrate-stabilized; PLL, poly-L-lysine.
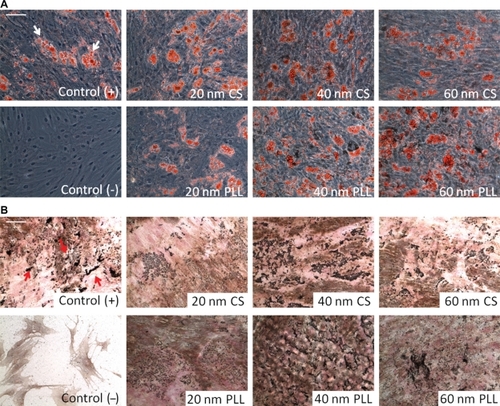
shows the results of von Kossa staining for assessing osteogenesis. Calcium deposits were stained black (indicated by red arrows) and are indicative of osteogenesis. The ability of MSCs to differentiate into osteocytes was maintained for all nanoparticle formulations, as qualitatively assessed by comparing the control images with the nanoparticle-loaded MSC images. Control (−) cells did not exhibit any calcium deposits.
MSC nanoparticle uptake and retention
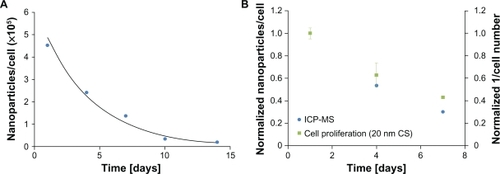
Initial nanoparticle loading and retention over a two-week period were determined for MSCs loaded with 20 nm citrate-stabilized gold nanoparticles using ICP-MS (see ). The average number of nanoparticles/cell decreased by approximately an order of magnitude over a two-week period from 4.53 × 10⁵ ± 3.98 × 10³ nanoparticles/cell to 2.00 × 10⁴ ± 2.18 × 10² nanoparticles/cell. Also, the number of nanoparticles/cell decreased exponentially over a two-week period. compares the average number of nanoparticles/cell and cell proliferation rate for cells loaded with 20 nm citrate-stabilized nanoparticles. The data were normalized to the maximum value for the corresponding data set. Day 7 was the only data point that showed a significant difference between the ICP-MS and cell proliferation data (P < 0.01), as determined using a Student’s t-test.
Figure 5 A) Nanoparticle uptake and retention over a two-week period were assessed using inductively coupled plasma mass spectrometry (ICP-MS) for cells incubated with 20 nm citrate-stabilized (CS) nanoparticles for 24 hours. The results are shown as the average number of nanoparticles/cell ± standard error. B) Comparison of the normalized values for the average number of nanoparticles/cell and the inverse of cell proliferation over time for control and 20 nm citrate-stabilized cells. The results are shown as the mean ± standard error.
Discussion
Previous work has demonstrated that PEGylated fibrin gels promote MSC differentiation and tubulogenesis.Citation4 Many investigators have suggested delivering stem cells to an injury site (eg, myocardial infarction) in order to promote wound healing and retain normal physiological function.Citation2–Citation4,Citation25,Citation26 However, it is not clear if the MSCs implanted within the gels are actively participating in neovascularization in vivo, and, if so, what the specific role of the delivered MSCs is in neovascularization. Thus, we are proposing to load MSCs with gold nanotracers in order to track and monitor the growth of MSCs over time in vivo after delivery. The specific aims of this study were to determine if nanoparticle loading of MSCs with gold nanotracers was possible, and to assess if MSC function was compromised as a result of nanoparticle loading. To this end, the results of this study demonstrate the feasibility of loading MSCs with gold nanotracers in order to track the MSCs in vivo. Specifically, MSCs were loaded with 20 nm, 40 nm, and 60 nm citrate-stabilized and poly-L-lysine-coated gold nanoparticles (see ). In addition, nanoparticle loading was not cytotoxic to the cells and did not substantially affect MSC viability. MSC differentiation to adipogenic and osteogenic lineages was also maintained.
MSC nanoparticle loading was accomplished via passive uptake of the nanoparticles by the cells because no targeting agents were used to promote nanoparticle uptake. The nanoparticles aggregated when resuspended in cell culture medium, as evident from the change in color of the nanoparticle solution from deep red to light blue, as well as the presence of peak broadening in the absorbance spectrum. Nanoparticle aggregation can most likely be attributed to the adsorption of serum proteins onto the nanoparticle surface. It is possible that protein adsorption could promote nanoparticle uptake by the cell.
It is interesting to note that the poly-L-lysine nanoparticles did not have a negative effect on MSC function. Other investigators have found that high concentrations of poly-L-lysine induce cell toxicity.Citation27 However, poly-L-lysine is commonly used to coat substrates in low concentrations in order to promote cell adhesion, with no negative effects on cell viability. In this study, the cells were exposed to a low concentration of poly-L-lysine coating the nanoparticles, and, as a result, cell toxicity was not induced. In fact, previous investigators have also found that poly-L-lysine in low concentrations, such as that used for coating nanoparticles, is not toxic to cells.Citation28,Citation29
The results of this study also demonstrate that nanoparticle loading decreased exponentially over time. Previous investigators have cited the dilution of nanoparticle concentration per cell as a result of cell proliferation and division.Citation15,Citation30 In addition, other investigators have suggested cell exocytosis of nanoparticles may occur. The exocytosis process of cells loaded with gold nanoparticles has been quantified, with the exocytosis process dependent on nanoparticle size and shape, cell type, and extracellular environment.Citation31,Citation32 Taken together, these studies demonstrate that decreased nanoparticle loading over time could be attributed to cell division, as well as other mechanisms, such as exocytosis of the nanoparticles by the cells. The normalized data for the average number of nanoparticles/cell and the inverse of the cell number over time (see ) exhibit a similar trend, with what appears to be an exponential decrease over time. If the decrease in nanoparticle retention over time was due only to cell division, we would not expect a significant difference between the ICP-MS results and the cell proliferation data at the same time points. Of the three time points analyzed, only day 7 showed a statistically significant difference between the ICP-MS and cell proliferation data. Thus, it was concluded that at the later time points, cell division was not the only factor responsible for the decrease in nanoparticle retention over time, and additional mechanisms, such as nanoparticle exocytosis, also significantly contributed to the observed results. However, as evidenced by the results, a majority of the decrease in nanoparticle retention over time was due to cell division.
Regardless of the mechanisms responsible for the decrease in the number of nanoparticles/cell, the decrease in nanoparticle retention over time has implications for the ability to image cells over long time periods. That is, a significant decrease in nanoparticle loading over time corresponds to a substantial decrease in signal when imaging. However, previous investigators have demonstrated the ability to use photoacoustic imaging, which is a noninvasive imaging approach that is capable of imaging cells at sufficient depths in vivo, to image human epithelial carcinoma cells.Citation18 The cells were also imaged in vitro and loaded with 50 nm epidermal growth factor receptor-targeted gold nanospheres almost an order of magnitude lower than that exhibited by MSCs after two weeks.Citation18 Thus, we are confident that MSCs loaded with gold nanotracers can be detected and imaged over a two-week time period using photoacoustic imaging.
As mentioned previously, the end goal of this study is to develop an imaging technique which can visualize and track MSCs at sufficient depths and spatial/temporal resolutions. Specifically, we are interested in using a noninvasive imaging approach which is capable of optically tracking MSCs in vivo over long time periods within a single animal model. Optical imaging modalities which could be employed to monitor and track MSCs include photoacoustic imaging,Citation18,Citation19 confocal microscopy,Citation33 two-photon microscopy,Citation34 and optical coherence tomography.Citation35,Citation36
Conclusion
In summary, the work presented here demonstrates the ability to load MSCs with gold nanotracers of various sizes and surface coatings. In addition, this study also demonstrates that MSC function is not altered by nanoparticle loading. Furthermore, these findings strengthen the possibility of imaging MSCs in vivo in order to understand better the participation and role of MSCs in neovascularization. The concentration of nanoparticle loading and retention over a two-week period suggests that long-term imaging and tracking of MSCs is feasible. Specifically, we are interested in developing an imaging approach to track MSCs in vivo after delivery via a PEGylated fibrin matrix using MSCs loaded with gold nanotracers. Thus, our future research will include in vitro imaging studies to verify that nanoparticle-loaded MSCs can be imaged using optical imaging modalities (eg, photoacoustic imaging combined with ultrasound imaging) and that MSC viability is not affected as a result of imaging. In addition, in vivo studies are necessary to monitor the progression of MSC growth over time.
Acknowledgements
The ICP-MS data were collected at the Holcombe Laboratory in the Department of Chemistry and Biochemistry at The University of Texas at Austin. The TEM images were collected at the Microscopy and Imaging Facility of the Institute for Cellular and Molecular Imaging at The University of Texas at Austin. This work was supported in part by a National Science Foundation Graduate Research Fellowship awarded to LMR and by the National Institutes of Health.
Disclosure
The authors report no conflicts of interest in this work.
References
- PittengerMMackayABeckSMultilineage potential of adult human mesenchymal stem cellsScience1999284541114314710102814
- ZhangGWangXWangZZhangJSuggsLA PEGylated fibrin patch for mesenchymal stem cell deliveryTissue Eng200612191916499438
- ZhangGHuQBraunlinEASuggsLJZhangJEnhancing efficacy of stem cell transplantation to the heart with a PEGylated fibrin biomatrixTissue Eng Pt A200814610251036
- ZhangGDrinnanCTGeussLRSuggsLJVascular differentiation of bone marrow stem cells is directed by a tunable three-dimensional matrixActa Biomater2010393395340320302976
- AsaharaTMuroharaTSullivanAIsolation of putative progenitor endothelial cells for angiogenesisScience199727553029649679020076
- ValarmathiMDavisJYostMGoodwinRPottsJA three-dimensional model of vasculogenesisBiomaterials20093061098111219027154
- Al-KhalidAElipoulosNMartineauDPostnatal bone marrow stromal cells elicit a potent VEGF-dependent neoangiogenic response in vivoGene Ther200310862162912692590
- LeeZDennisJGersonSImaging stem cell implant for cellular-based therapiesExp Biol Med20082338930940
- NageshaDLaevskyGSLamptonPIn vitro imaging of embryonic stem cells using multiphoton luminescence of gold nanoparticlesInt J Nanomedicine20072481381918203448
- HorákDBabičMJendelováPEffect of different magnetic nanoparticle coatings on the efficiency of stem cell labelingJ Magn Magn Mater20093211015391547
- AdonaiNNguyenKWalshJEx vivo labeling with 64Cu-pyruvaldehyde-bis(N4-methylthiosemicarbazone) for imaging cell trafficking in mice with positron-emission tomographyProc Natl Acad Sci U S A20029953030303511867752
- SheikhAWuJMolecular imaging of cardiac stem cell transplantationCurr Cardiol Rep20068214715416524542
- FrangioniJHajjarRIn vivo tracking of stem cells for clinical trials in cardiovascular diseaseCirculation2004110213378338315557385
- HuangDHsiaoJChenYThe promotion of human mesenchymal stem cell proliferation by superparamagnetic iron oxide nanoparticlesBiomaterials200930223645365119359036
- GuzmanRUchidaNBlissTLong-term monitoring of transplanted human neural stem cells in developmental and pathological contexts with MRIProc Natl Acad Sci U S A200710424102111021617553967
- FerreiraLNanoparticles as tools to study and control stem cellsJ Cell Biochem2009108474675219708027
- FerreiraLKarpJNobreLLangerRNew opportunities: the use of nanotechnologies to manipulate and track stem cellsCell Stem Cell20083213614618682237
- MallidiSLarsonTAaronJSokolovKVEmelianovSMolecular specif ic photoacoustic imaging with plasmonic nanoparticlesOpt Express200715116583658819546967
- SokolovKVFollenMAaronJReal-time vital optical imaging of precancer using anti-epidermal growth factor receptor antibodies conjugated to gold nanoparticlesCancer Res20036391999200412727808
- XuMWangLPhotoacoustic imaging in biomedicineRev Sci Instrum2006774041101
- SiphantoRIThummaKKKolkmanRGMSerial noninvasive photoacoustic imaging of neovascularization in tumor angiogenesisOpt Express2005131899519488331
- LaoYXingDYangSXiangLNoninvasive photoacoustic imaging of the developing vasculature during early tumor growthPhys Med Biol200853154203421218635896
- NiidomTYamagataMOkamotoYPEG-modified gold nanorods with a stealth character for in vivo applicationsJ Control Release2006114334334716876898
- YangHLopinaSDiPersioLSchmidtSStealth dendrimers for drug delivery: correlation between PEGylation, cytocompatibility, and drug payloadJ Mater Sci Mater Med20081951991199717952565
- YeghizariansYZhangYPrasadMInjection of bone marrow cell extract into infarcted hearts results in functional improvement comparable to intact cell therapyMol Ther20091771250125619384293
- LiuJHuQWangZAutologous stem cell transplantation for myocardial repairAm J Physiol Heart Circ Physiol20042872501511
- FischerDLiYAhlemeyerBKrieglsteinJKisselTIn vitro cytotoxicity testing of polycations: influence of polymer structure on cell viability and hemolysisBiomaterials20032471121113112527253
- ZiadyAGGedeonCRMuhammadOMinimal toxicity of stabilized compacted DNA nanoparticles in the murine lungMol Ther20038694895614664797
- ArbabASBashawLAMillerBRCharacterization of biophysical and metabolic properties of cells labeled with superparamagnetic iron oxide nanoparticles and transfection agent for cellular MR imagingRadiology2003229383884614657318
- BulteJDouglasTWitwerBMagnetodendrimers allow endosomal magnetic labeling and in vivo tracking of stem cellsNat Biotechnol200119121141114711731783
- ChenRHuangGKePCalcium-enhanced exocytosis of gold nanoparticlesAppl Phys Lett2010979093706
- ChithraniBChanWElucidating the mechanisms of cellular uptake and removal or protein-coated gold nanoparticles of different sizes and shapesNano Lett2007761542155017465586
- MallidiSLarsonTTamJMultiwavelength photoacoustic imaging and plasmon resonance coupling of gold nanoparticles for selective detection of cancerNano Lett2009982825283119572747
- DurrNJLarsonTSmithDKTwo-Photon luminescence imaging of cancer cells using molecularly targeted gold nanorodsNano Lett20077494194517335272
- SkalaMCCrowMJWaxAIzattJAPhotothermal optical coherence tomography of epidermal growth factor receptor in live cells using immunotargeted gold nanospheresNano Lett20088103461346718767886
- GobinAMLeeMHHalasNJNear-infrared resonant nanoshells for combined optical imaging and photothermal cancer therapyNano Lett2007771929193417550297