
Abstract
Introduction
In vivo distribution of polyethylene glycol (PEG)ylated functional nanoparticles is vital for determining their imaging function and therapeutic efficacy in nanomedicine. However, contradictory results have been reported regarding the effect of core size and PEG surface of the nanoparticles on biodistribution.
Methods
To clarify this ambiguous understanding, using iron oxide nanoparticles (IONPs) as a model system, we investigated the effect of core size and PEG molecule weights on in vivo distribution in mice. Three PEGylated IONPs, including 14 nm IONP@PEG2,000, 14 nm IONP@PEG5,000, and 22 nm IONP@PEG5,000, were prepared with a hydrodynamic size of 26, 34, and 81 nm, respectively. The blood pharmacokinetics and tissue distribution were investigated in detail.
Results
The results indicated that the PEG layer, rather than core size, played a dominant role in determining the half-life time of IONPs. Specifically, increased molecular weight of the PEG layer led to a longer half-life time. These PEGylated IONPs were mainly excreted by liver clearance. While the PEG molecular layer constituted the key factor to determine the clearance ratio, core size affected the clearance rate.
Conclusion
Complete blood count analysis and histopathology suggested excellent biocompatibility of PEGylated IONPs for future clinical trials.
Introduction
Owing to their excellent advantages, such as unique magnetic properties, easy surface functionalization, and high biocompatibility, magnetic iron oxide nanoparticles (IONPs) have demonstrated great promise for diagnosis and therapeutics, including their role as delivery tools of medicines, in magnetic hyperthermia, and in contrast-enhanced MRI.Citation1–Citation3 For all of these IONP-based biomedical applications, sufficient in vivo blood circulation time is a requisite for carrying these inorganic nanoparticles (NPs) into target tissues and organs. Similar to gold NPs and porous silicon NPs, they are required to undergo surface modification to avoid quick clearance by the immune system prior to arriving at the predesignated organs.Citation4,Citation5 Recent studies in this field revealed that the blood circulation of IONPs can be controlled by their particle size, morphology, and surface ligands.Citation6,Citation7 Since spherical IONPs have been widely adopted for biomedical applications, including the commercial Endorem (Guerbet S.A., Roissy Charles de Gaulle Cedex, France), and Sinerem (AMAG Pharmaceuticals, Inc., Cambridge, MA, USA), the effect of core size and surface ligands on circulation time has attracted extensive attention.Citation8,Citation9 As reported, IONPs smaller than 5 nm can be rapidly removed from the blood circulation system via renal clearance by the kidney.Citation10–Citation12 In addition, those with a size from 10 to 200 nm in hydrodynamic diameter can also be quickly absorbed by the reticuloendothelial system (RES) of the liver and spleen.Citation6,Citation7,Citation13,Citation14
Regarding the surface ligands, polyethylene glycol (PEG), an US Food and Drug Administration-approved macromolecule with different molecular weights, has been frequently employed to modify the surface of various functional NPs for the reduction of overall blood plasma protein adsorption, diminution of liver and immune response-associated proteins, and prevention of NP agglomeration.Citation15,Citation16 Non-stealth NPs can be recognized and removed by the mononuclear phagocytic system before they can play their designated roles. Moreover, PEGylation can help NPs escape from the mononuclear phagocytic system with prolonged blood circulation.Citation12,Citation15,Citation16 For example, it was experimentally demonstrated that the half clearance time of PEG during blood circulation was prolonged from 30 minutes to 24 hours with the increase of molecular weight from a few thousands to a few hundred thousand by reducing and slowing down RES uptake.Citation15–Citation17 As a result, it is deduced that the circulation time of PEG-modified IONPs can be regulated by utilizing PEG of different molecular weight, similar to that reported for gold NPs and hydrogel particle replication in nonwetting templates NPs.Citation4,Citation18
Although both the size of the NPs and surface PEG modification can extend the blood circulation time, early extant literature has reported controversial findings regarding whether the core size or PEG surface should be the dominant factor to prolong the circulation time of IONPs.Citation13,Citation19–Citation21 Since intravenously injected IONPs are delivered to different tissues and organs by blood circulation in vivo, blood circulation time can affect the dynamic distribution and metabolism in organs. Despite that PEG-modified IONPs have been extensively shown to act as an imaging or hyperthermia agent, the dynamic distribution and metabolism of PEGylated NPs in vital organs and tissues remain unclear.Citation3,Citation10,Citation12 It is thus essential to investigate the influence of core size and PEG coating on in vivo dynamic distribution and metabolism in vital organs, as well as the circulation time, for future potential clinical trials.
In the present study, highly monodisperse IONPs with different core sizes and PEG molecules were prepared, and their biodistribution and metabolism were investigated systematically in vivo. They were injected via the tail vein into Kunming mice at a dose of 5 mg Fe/kg per mouse according to the dose requirement of MRI imaging and biosafety in vivo.Citation22 The effects of core size and PEG-modified surface on blood circulation, biodistribution, and metabolism were elucidated. The results clearly indicated that blood circulation time and tissue clearance time of these IONPs were dominated by the PEG coating layer rather than the core size. Additionally, the biosafety of PEGylated IONPs was systematically evaluated in vivo. All of these results will be very useful for the design of IONPs with excellent blood compatibility and histocompatibility.
Materials and methods
Chemicals
FeCl3⋅6H2O (American Chemical Society qualified purity), FeOOH (American Chemical Society qualified purity), sodium oleate (>97%), oleic acid (analytical reagent), PEG (molecular weight: 2,000, 5,000), alcohol (99.5%), n-hexane (analytical reagent), and trichloromethane (analytical reagent) were used for the study. All reagents were analytically pure.
Synthesis of IONPs
IONPs were prepared using previously developed methods.Citation23,Citation24 Synthesis of 14 nm IONPs was performed as follows. Exactly 1.8 g of the iron–oleate complex and 0.3 g of oleic acid were dissolved in 10 g of 1-octadecene at room temperature. The reaction mixture was heated to 320°C with a constant heating rate of 3.3°C/min and then kept at 320°C for 30 minutes. The resultant solution containing the nanocrystals was then cooled to room temperature and 25 mL of ethanol was added to the solution to precipitate the nanocrystals. The nanocrystals were separated by centrifugation at 8,000 rpm for 10 minutes.
Synthesis of 22 nm IONPs was performed as follows. Exactly 178 mg of FeOOH, 1.71 g of oleic acid, and 5 g of 1-octadecene were mixed in a flask, allowing for degassing with Ar under 110°C for 30 minutes. The system was heated to 180°C for 2 hours and then heated to reflux for another 1 hour before being cooled to room temperature. The product was collected by centrifugation with the addition of ethyl alcohol and purified with a mixture of hexane and ethyl alcohol. The as-prepared IONPs were re-dispersed in hexane for further use.
Synthesis of PEGylated IONPs
The as-prepared IONPs were hydrophobically coated with oleic acid. Phosphorylated mPEG, which was synthesized according to previously reported methods,Citation3,Citation8 was used to transfer them into the water phase, which resulted in PEGylated IONPs. In a typical procedure of ligand exchange, 10 mg of IONPs and 50 mg of phosphorylated mPEG were mixed in 20 mL of chloroform. The mixture was then heated slowly to 70°C and kept at this temperature for 5 hours. After dispersing the completely dried NP powder in water, followed by centrifugation for 3 minutes at 3,000 rpm, the resultant supernatant was collected and stored. The same procedure was utilized to coat different-sized IONPs using phosphorylated mPEG of different molecular weights ranging from 2,000 to 5,000 Da. Infrared spectrum (Fourier transform infrared spectrometry), weight loss analysis under heating, dynamic light scattering, and stability analysis in deionized water were used to evaluate the PEGylation process. Three samples with different core sizes and coatings were prepared and labeled as S1 (14 nm IONP@PEG2,000), S2 (14 nm IONP@PEG5,000), and S3 (22 nm IONP@PEG5,000). The concentrations of S1, S2, and S3 were usually higher than 2,000 µg Fe/mL. They were diluted with normal saline prior to use.
In vivo study
All the in vivo experiments were conducted according to guidelines that were approved by the Institutional Animal Care and Use Committee of the Northwest University, Xi’an, China.
Animals and test groups
Kunming mice (male, 6–8 weeks old) with a weight of ~18–22 g were used and fed conventional rodent diets and water at room temperature. One hundred and forty mice were individually caged and divided into a blank group (n=5), control group (infusion of saline; n=18tissue+10blood), test group 1 (infusion of S1; n=18tissue+10blood), test group 2 (infusion of S2; n=18tissue+10blood), and test group 3 (infusion of S3; n=18tissue+10blood). Then 0.2 mL of 500 µg/mL of the three samples in saline was administered to the animals via tail vein injection. All experiments were performed in triplicate.
Pharmacokinetics, biodistribution, and metabolism
Mice blood and tissues were collected from each mouse. A blood sample of ~0.1 mL was obtained from each mouse via docking tail at the time points of 0 minute, 5 minutes, 15 minutes, 30 minutes, 45 minutes, 1 hour, 6 hours, 1 day, 3 days, and 5 days. In addition, the blood sample was mixed with 0.8 mL of EDTA-K2 to prevent coagulation. A series of tissue samples were prepared at 30 minutes, 1 hour, 6 hours, 1 day, 3 days, and 5 days. The tissues were weighed and fixed in formalin buffer to minimize analysis loss and facilitate subsequent sample preparation steps.
The blood and tissue samples were digested with concentrated nitric acid (HNO3, MOS grade). In detail, ~0.20–0.25 g of fixed tissue and 0.1 mL of blood were, respectively, weighed into a Teflon reaction vessel and then 3 mL of 65% HNO3 was added. The closed reaction vessel was heated in a 130°C oven until digestion was completed. Samples were then diluted to a final volume of 10 mL with distilled water and stored in a centrifugal tube for subsequent ICP-MS analysis (Elan DRC-e; PerkinElmer Sciex). Uptake of IONPs in various organs was expressed as µg Fe/g organ weight.
In addition, blood routine indexes were investigated. Exactly 0.3 mL of blood samples were collected into the purchased evacuated blood vessels containing EDTA-K2 as an anticoagulant for whole blood cell analysis. Statistical differences among experimental groups were analyzed using one-way ANOVA. P<0.05 was considered statistically significant.
Ethical statement for using medical laboratory animals
According to the guidelines on the good treatment of experimental animals issued by the Ministry of Science and Technology, the regulations on the management of experimental animals issued by the National Committee for Science and Technology, and the measures for the management of experimental animals issued by Shaanxi government, the in vivo research conducted by Luo’s group had been strictly examined by the Institutional Animal Care and Use Committee of Northwest University. After examination, the in vivo research conducted by Luo’s group met the requirements of laboratory animal ethics and had been approved.
Results and discussion
Preparation of PEGylated IONPs with different core sizes and PEG layers
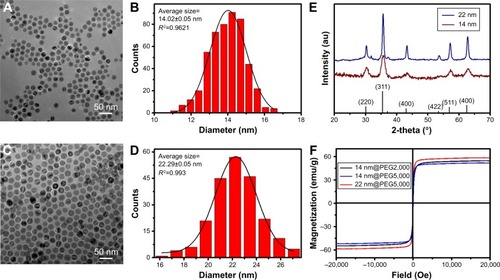
The morphology of IONPs was observed by transmission electron microscope, and the mean size of the NPs sample was analyzed by ImageJ software. As shown in , the prepared IONPs exhibited good monodispersity, and these IONPs with spherical morphology were 14 and 22 nm, respectively, with a narrow particle size distribution similar to that found in previous reports.Citation8,Citation25 The X-ray powder diffraction pattern of the as-prepared IONPs was in good agreement with the standard Fe3O4 powder diffraction data (). The hysteresis loop further confirmed that these PEGylated IONPs showed superparamagnetic behavior ().
Figure 1 Characterization of different-sized IONPs before PEGylation (A–E) and after PEGylation (F). Picture A and B are TEM images of IONPs with designed sizes of 14 nm and 22 nm, respectively; plot C and D show the size analysis of 14 nm and 22 nm IONPs, respectively; plot E is the XRD pattern of IONPs; and plot F is the hysteresis loop of three samples of PEGylated IONPs at room temperature.
Abbreviation: PEG, polyethylene glycol.
As a kind of polymeric surfactant with different molecular weight, the hydrodynamic size of IONPs could be regulated by PEG via controlling the thickness of the PEG layer and was detected with dynamic light scattering. Furthermore, the hydrodynamic diameter of NPs was positively coincident with the average molecular weight of PEG. As shown in , S1 and S2 with the same core size of 14 nm have a hydrodynamic diameter of 26 nm () and 34 nm (), respectively, after modification with PEG 2,000 and PEG 5,000 (). Moreover, it is well known that the decrease in core size will lower the hydrodynamic size of NPs when modified with the same PEG. The hydrodynamic size of S2 decreased from 81 to 34 nm with the core size decreasing from 22 to 14 nm, compared with S3 (core size 22 nm, hydrodynamic size 81 nm), as shown in . Although the size of PEG usually increases with increasing molecular weight in a linear model, the linear relationship between PEG size and PEG molecular weight will cease when the PEG molecular weight is greater than 2,000.Citation4,Citation27 In addition, although the same preparation procedure was used, the PEG density of IONPs varied with PEG molecular weight and particle size. PEG molecules are likely to form a coiled structure at a low surface density, so as to wrap the NPs tightly.Citation4,Citation18 In our case, 14 nm IONPs were bounded with more PEG 2,000 molecules than PEG 5,000 ().Citation22 Therefore, the hydrodynamic diameter of PEGylated IONPs with PEG 5,000 did not increase two times, as the molecular weight of PEG did in comparison to that with PEG 2,000.Citation27 For the samples modified by PEG 5,000, the particle number of large IONPs was less than that of small ones with the same mass. Due to a higher surface density (; ), the PEG chains on 22 nm IONPs stretched and then the hydrodynamic diameter of 22 nm IONP@PEG5,000 was much larger than that of 14 nm IONP@PEG5,000.Citation4,Citation18 Generally, under the effects of the different numbers and sizes of core and shell, the hydrodynamic diameters of PEGylated IONPs increased with the increasing PEG molecular weight and core size in a nonlinear model, as shown in and .
Table 1 The size changes of IONPs after being coated with PEG 2,000 or PEG 5,000
Figure 2 Characterization of different-sized IONPs after PEGylation. Plot A and B are the hydrodynamic diameters of 14 nm IONPs after PEGylation with PEG2,000 and PEG5,000, respectively; plot C is the hydrodynamic diameters of 22 nm IONPs after PEGylation with PEG5,000; plot D are the infrared spectrums (FTIR) of IONPs before and after PEGylation; plot E is thermogravimetric analysis (TGA) after PEGylation; and plot F is the zeta potential of three samples after PEGylation.
Abbreviations: IONPs, iron oxide nanoparticles; PEG, polyethylene glycol.
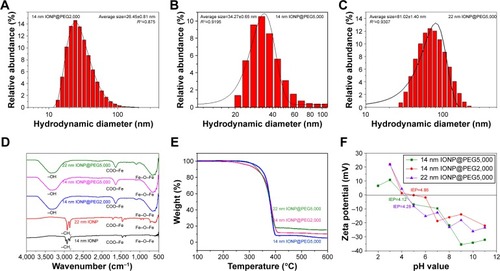
Fourier transform infrared spectrometry was used to evaluate whether or not a new PEGylated IONP was formed.Citation10 As shown in , the peaks at 2,850 and 2,920 cm−1, due to the −CH2 of oleate on the surface of IONPs prior to PEGylation, disappeared after PEGylation. Other absorption peaks at 1,635 and 1,556 cm−1, attributed to COO−Fe of IONPs before PEGylation, still remained after PEGylation. A new absorption peak at 3,200 cm−1 appeared after PEGylation, which is attributed to the −OH stretching vibration that comes from PEG surrounding the IONPs. The change in these identified peaks revealed that Fe3O4 NPs had been PEGylated by PEG. In addition, the strong absorption peak at 596 cm−1 from the Fe−O−Fe vibration further verified that the cores were Fe3O4 NPs.
Effects of core size and PEG layer on the clearance rate of IONPs in blood
The clearance process of intravenously injected PEGylated NPs was investigated based on pharmacokinetics (). The content of IONPs of all sizes in blood decreased significantly within 1 hour and was close to zero after 5 hours. Among the three samples mentioned above, S1 with a hydrodynamic size of 26 nm (14 nm IONP@PEG2,000) could be eliminated the fastest in comparison to the others coated with PEG 5,000. The clearance profile of all samples in blood could fit well using the one-compartment model of pharmacokinetics.
Figure 3 Blood clearance profile of IONPs with different core size and PEG layer. S1, S2, and S3 were 14 nm IONP@PEG2,000, 14 nm IONP@PEG5,000 and 22 nm IONP@ PEG5,000, respectively.
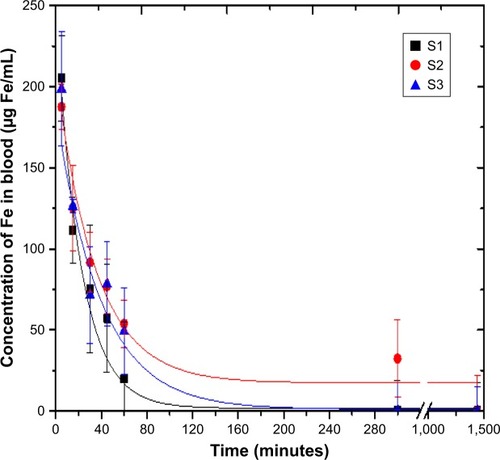
For S1 (14 nm IONP@PEG2,000), the fitting pharmacokinetic equation was CS1=2.02+242.29 e−0.045t with R2=0.97, where C (µg/mL) and t (minutes) were the content of NPs in blood and the clearance time, respectively. As a result, the half-life time (T1/2) was ~15 minutes, and the area under the pharmacokinetic curve (AUC0–t) was 5,335 µg/mL⋅min. Regarding S2 (14 nm IONP@PEG5,000), the pharmacokinetic equation was CS2=17.27+192.29 e−0.029t with R2=0.97. The half-life time (T1/2) was ~24 minutes, and AUC0–t was 6,673 µg/mL⋅min. For S3 (22 nm IONP@PEG5,000), the pharmacokinetic equation was CS3=1.07+185.09 e−0.026t with R2=0.97. Its half-life time (T1/2) was prolonged to 27 minutes coupled with a larger AUC0–t of 7,223 µg/mL⋅min.
Although the core size of S1 and S2 was the same at 14 nm, their half-life time varied significantly from 15 to 24 minutes, which constituted a nearly 160% increase accompanied by a change of PEG molecular weight. However, with the same PEG 5,000 layer, the half-life time of the IONPs with the 22 nm core increased slightly to 27 minutes compared with IONPs with the 14 nm core (12.5% increase). These results clearly indicated that the PEG layer played a more important role in the circulation time of IONPs than did the core size. It has been well demonstrated that the density and length of PEG, as well as its mixed heterogeneous layer structure, could affect blood circulation.Citation5,Citation28 It has also been reported that the increase in molecular weight of PEG can prolong the circulation time of PEG in blood.Citation29 For example, when the molecular weight increased from 6,000 to 19,000, the half-life time could be increased from 18 minutes to 1 hour in blood.Citation29 In this study, the half-lives of PEGylated IONPs were longer than that of pure PEG with the same molecular weight. In comparison to the PEG layer, the core size of IONPs contributed less to prolonging retention time. On the other hand, IONPs seemed to switch the two-compartment model of PEG into the one-compartment model.Citation29 Our pharmacokinetics of PEGylated IONPs were consistent with previous results.Citation30
Despite the difference in core size and PEG layer, the small hydrodynamic diameter of IONPs corresponded to a short half-life time in blood because smaller particles were more readily absorbed and more widely distributed in the body than larger particles.Citation31,Citation32
Effects of core size and PEG layer on blood routine indexes
After injection, IONPs acting as foreign materials are discovered and removed by the immune system. PEG molecular chains on the surface of the IONPs core can block antigenic determinants, largely avoiding the uptake by the RES system and recognition by the immune system.Citation12,Citation29,Citation30 Usually, the blood indexes will change obviously after 3 days of invasion of exogenous bacteria. Consequently, pertinent blood indices were analyzed by sampling blood from the tail veins of mice after 5 days. Complete blood count analysis was performed to evaluate the inflammatory response of mice to PEGylated IONPs. Especially, immune cells, such as leukocytes (white blood cells), neutrophils, eosinophils, lymphocytes, monocytes, basophils, lymphocytes, mast cells, and platelets, were considered. The results are shown in .
Figure 4 Results of complete blood count analysis treated with IONPs. S1, S2, and S3 were 14 nm IONP@PEG2,000, 14 nm IONP@PEG5,000 and 22 nm IONP@PEG5,000, respectively. Error bars = standard error of the mean; *P<0.05.
Abbreviations: BASO, basophil; EO, eosinophil; HGB, hemoglobin; LYMOH, lymphocyte; MCHC, mean corpuscular hemoglobin concentration; MCV, mean corpuscular volume; MONO, monocyte; MVP, mean platelet volume; NEUT, neutrophils; PLT, platelet; RBC, red blood cell; RDW-SD, red blood cell distribution width; WBC, white blood cells; RDW-CV, coefficient variation of red blood cell volume distribution width; HCT, hematocrit; PCT, thrombocytocrit; PDW, platelet distribution width; P-LCR, platelet larger cell ratio.
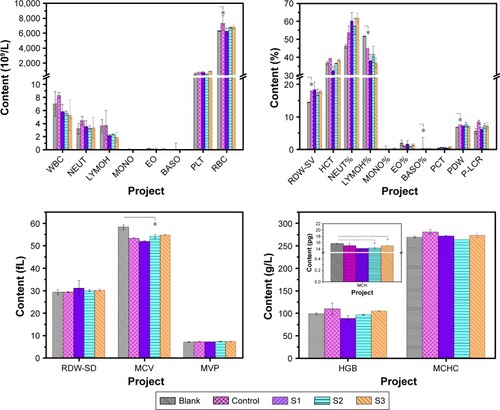
No significant difference was found in the distribution ratio of leukocytes among the three treated groups. Compared with the blank and control groups, the lymphocyte ratio of the treated groups decreased, while the proportion of neutrophils increased. In addition, the leukocyte number was close to that of physiological saline, indicating that PEGylated IONPs had good biocompatibility.
Being responsible for acute inflammation, neutrophils can phagocytize and digest bacteria, body necrotic tissues, and old red blood cells (RBCs) due to their strong ability to deform. For S1, a slight increase of neutrophils was accompanied by a significant decrease of lymphocytes, which accelerated the clearance of particles in blood. Since the half-life time of S2 and S3 in blood was relatively prolonged, the inflammatory response was stronger. For these two samples, the lymphocytes decreased without a change in neutrophils, resulting in an overall decrease of white blood cells. Compared with S2, S3 with a larger size resulted in more lymphocytes’ apoptosis after encircling, swallowing, and degrading IONPs. In addition, all PEGylated IONPs had no influence on platelet count and mean platelet volume.
S1 in blood was removed quickly (half-life time was 15 minutes) with low residue after intravenous injection for 30 minutes. Since the demand for oxygen transport and catabolism of Fe3O4 was the lowest, the number of RBCs of the group treated with S1 was close to that of the blank group. Responding to the longer half-life times of S2 (24 minutes) and S3 (27 minutes) IONPs in blood, since the extra oxygen requirement for transporting and catabolizing Fe3O4 in vivo lasted longer, the number of RBCs was higher than that of the blank group. Accordingly, the changing tendency of hemoglobin amount was the same as that of RBC. Although the mean corpuscular volume of the treated groups increased with the half-life time of NPs, it was lower than that of the blank group, which further confirmed that extra oxygen was required for transporting and catabolizing Fe3O4 in vivo.
In general, PEG 5,000 could effectively extend the circulation time of NPs in blood. Moreover, the changes of blood index resulting from PEGylated IONPs were within a safe range.
Effects of core size and PEG layer on tissue distribution
The distribution of PEGylated IONPs in vital functional organs was studied. The time profiles of NPs distribution in the heart, liver, spleen, lungs, and kidney are shown, respectively, in . Although the severe and rapid RES uptake of IONPs was reduced by coating with PEG molecules, a majority of PEGylated IONPs still accumulated in the liver and spleen, and the maximum absorption amounts of all PEGylated IONPs in the liver and spleen were >30%, which was close to the findings of previous studies.Citation33,Citation34
Figure 5 The time profiles of the distribution of PEGylated IONPs (µg Fe/g organ) in vital tissues. S1, S2, and S3 were respectively 14 nm IONP@PEG2,000, 14 nm IONP@ PEG5,000 and 22 nm IONP@ PEG5,000, respectively.
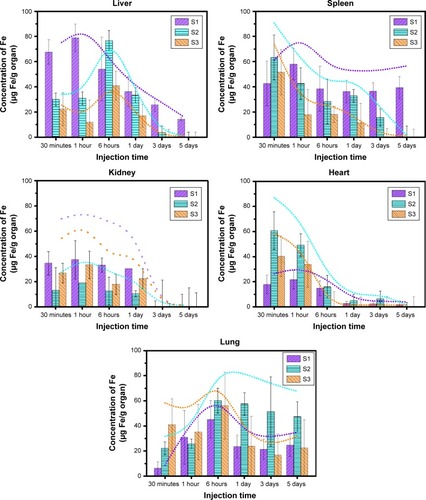
Regarding S1, the distribution ratio in the liver was up to 40% at 30 minutes and then decreased to 14 µg Fe/g organ on the fifth day. In addition, the distribution ratio of S2 in the liver reached 40% at the sixth hour and then decreased to approximately zero on the fifth day. For S3, the distribution ratio in the liver was only 31% at the sixth hour and then rapidly declined to almost zero on the third day. In brief, IONPs modified with PEG 5,000 could be effectively cleared by the liver within 5 days, while IONPs modified with PEG 2,000 could be eliminated up to 95% by the liver within 5 days. These results agreed with those of previous work, in which 21 nm CdSe@S QDs were metabolized in the liver and excreted via feces within 5 days.Citation35,Citation36 Concerning large-molecular-weight PEG, it is considered to be cleared by the liver,Citation37 while small-molecular-weight PEG and small particles are mainly cleared by the kidney.Citation12,Citation20,Citation35
Concerning the distribution of different-sized PEGylated IONPs in the spleen, the highest distribution of S1, S2, and S3 was 26%, 33%, and 28%, respectively. Except for S1, S2 and S3 decreased to zero on the fifth day and third day, respectively. According to the results of histological staining, almost PEGylated IONPs of all sizes were located in the red pulp region of the spleen (data in the next section). In the red pulp region, blood flow rate decreased so significantly that the amount of IONPs flowing back into blood vessels was low.Citation35,Citation38 Meanwhile, since the macrophages in the red pulp region engulfed large-molecular-weight PEG and large particles,Citation33 the phagocytosis of 14 nm IONPs PEGylated with PEG 2,000 was low. As a result, S1 could not be cleared in the spleen within 5 days. In the spleen and liver, PEG molecular weight was the key factor to determine the clearance ratio of IONPs, while core size could affect the clearance rate.
In addition to liver clearance, renal excretion constitutes an essential biological process for protecting the body from damage and toxicity by eliminating unwanted materials.Citation35 Renal clearance relies on glomerular filtration in the kidney, and the filtration-size threshold of glomerular capillary walls is typically 6–8 nm for spherical particles.Citation20,Citation35 According to the results of histological staining, nearly all PEGylated IONPs distributed in the glomerular capillary at the first hour and completely disappeared on the fifth day (data in the next section). Since all sizes of PEGylated IONPs in our study were larger than the filtration-size threshold of glomerular capillary walls, these IONPs could not penetrate and might flow out of the kidney and be excreted from the liver.Citation36 In addition, there was no obvious difference in distribution amount and clearance time for these samples.
The heart, the power center of the circulatory system, promotes blood flow, provides sufficient blood flow to tissues and organs, supplies oxygen and nutrients, removes metabolites (such as carbon dioxide, inorganic salt, urea, and uric acid), and enables cells to maintain normal metabolism and function. After intravenous injection for 6 hours, the content of PEGylated IONPs of all sizes decreased below 20 µg Fe/g organ and they were eliminated and decreased to zero on the fifth day. Although both S2 and S3 were PEGylated by PEG 5,000, S3 was removed faster than S2 and S1 (14 nm IONP@PEG2,000), which might result from the fast clearance by the liver. Since the liver clearance efficiency and spleen degradation of 14 nm IONP@PEG2,000 were low, the circulation time of S1 was longer than those of the other two samples.
Being different than the time profiles of tissue distribution in the heart, spleen, and kidney, the accumulation of PEGylated IONPs of all sizes in the lungs reached the highest at the sixth hour and remained ~20 µg/g organ after 1 day. In comparison to the distribution in other tissues, the percentage distribution at the sixth hour increased in the lungs with increase in particle hydrodynamic size, and it was 24%, 31%, and 42% for S1, S2, and S3, respectively. Due to the stable residual quantity of NPs, the percentage distribution in the lungs increased with prolonging the metabolic time. In the lungs, alveolar macrophage-mediated clearance constituted the main mechanism for foreign intruder removal, while the size selectivity and phagocytosis of NPs smaller than 100 nm were quite inefficient.Citation35 Intracellular particle dissolution is an additional clearance pathway, and its rate depends on the physicochemical characteristics of the particle, such as size, density, surface area, and chemical composition.Citation20,Citation33,Citation35 Phagocytic uptake, including macropinocytosis, pinocytosis, and RhoA-, Arf6-, clathrin-, or caveolae-mediated endocytosis, seemed to partly reduce the content of IONPs in the lung, whereas the trace IONPs in the capillary vessel walls seemed to cluster due to their paramagnetic property, inducing the decrease in oxygenation function of lung;Citation38 this tendency still remained in lung histopathology ().
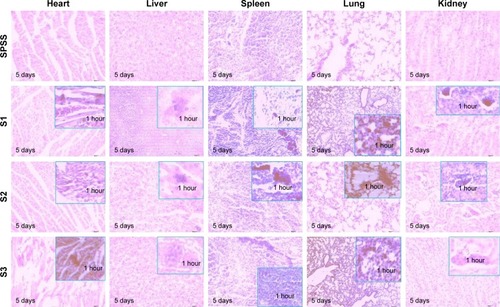
Figure 6 Pathological changes of the heart, liver, spleen, lungs, and kidney after tail vein injection with different sized IONPs (200× on the 5th day, HE staining). S1, S2, and S3 were 14 nm IONP@PEG2,000, 14 nm IONP@PEG5,000 and 22 nm IONP@PEG5,000, respectively.
Effects of core size and PEG layer on histopathology
The distribution of PEGylated IONPs with different core sizes and layers was visually found by histopathology with HE staining. Similar to the results shown by ICP-MS in , IONPs stained in blue could be seen in the liver and spleen at the first hour after injection.Citation34 Some previous investigations reported that 100–200 nm particles could be quickly engulfed by the RES and removed by the lysosomes of Kupffer cells, 50–100 nm particles were distributed into the liver parenchyma, and <50 nm particles were mainly distributed in the spleen and bone marrow.Citation20,Citation35 Although all PEGylated IONPs were smaller than 100 nm in this study, they still appeared in Kupffer cells (). Generally, large-molecular-weight PEG and large particles are prone to be degraded and eliminated by the efficient clearance system composed of Kupffer cells. Five days later, there were no blue IONPs (S2 and S3) modified by PEG 5,000 in the liver, but a small amount of S1 still remained in sinus hepaticus and Kupffer cells. Furthermore, the liver tissue stained by HE also showed that there was no degeneration and necrosis of hepatocytes, which confirmed that all of these PEGylated IONPs had good biocompatibility.Citation9 Spleen tissue stained by HE showed no obvious incrassation at the spleen capsule, spleen trabecular, or connective tissue hyperplasia, which implied excellent biocompatibility of PEGylated IONPs. Deposited in the red pulp, a small amount of blue NPs still remained 5 days later.Citation9
Regarding the lungs stained by HE, alveolar epithelium was not affected. Consequently, there was no dilatation or hyperemia in the alveolar wall blood capillary, no obvious incrassation at the alveolar septum, and no obvious inflammatory cells. Mass or granular blue NPs could be observed in some capillaries in the alveolar wall, rather than in the large arteries and veins.
Blue NPs were scattered in the capillaries of glomeruli. They were difficult to penetrate, but easy to flow back to the blood vessels, and no NPs remained in the kidney on the fifth day. Blue NPs could be observed in the left atrium and interventricular septum, and slight adipose degeneration and granular degeneration partly occurred.
Histological results coincided well with those of ICP-MS. PEGylated IONPs could be cleared in the liver and had good biocompatibility due to the safety of PEG and Fe3O4.Citation7 Concerning IONPs smaller than 100 nm, liver clearance efficiency was affected more by PEG molecular weight than by inner core size.
Effects of core size and PEG layer on the functions of the liver and kidney
Parameters that can elucidate the effects of IONPs on liver and kidney function were also determined. The key clinical indices of liver function and kidney function were evaluated (), including ALT, AST, total cholesterol, creatinine, and blood urea nitrogen.
Figure 7 Changes in levels of the key index reflecting liver function and kidney function. S1, S2, and S3 were 14 nm IONP@PEG2,000, 14 nm IONP@PEG5,000 and 22 nm IONP @PEG5,000, respectively. Error bars = standard error of the mean; *P<0.05. **P<0.01.
Abbreviations: BUN, blood urea nitrogen; CHOL, total cholesterol; CREA, creatinine.
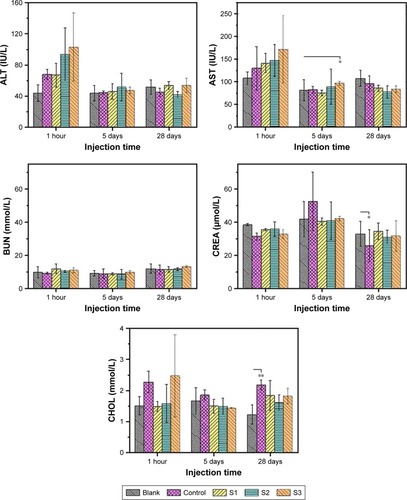
After intravenous injection of PEGylated IONPs into mice for 1 hour, S2 and S3 containing PEG 5,000 caused a larger content increase of ALT and AST than saline, while the content enhancement of ALT and AST injected S1 containing PEG 2,000 was close to that of saline. These data demonstrated that S2 and S3 significantly increased liver metabolic burden, which further confirmed that large-molecular-weight PEG was prone to hepatic clearance. Five days later, the contents of ALT and AST of all treatment groups decreased to near those of the blank and control groups, indicating that PEGylated IONPs were effectively eliminated without damaging the liver function.Citation9
Except for S3, the other two samples did not cause an increase of cholesterol in the blood after injection of NPs for 1 hour in comparison to the blank group. Based on the content increase of AST and ALT in the liver, it could be inferred that <1% of the liver cells were injured (). Consequently, the elimination rate and decomposition rate of S3 were slowed down. As a result, less iron free radicals were formed, which were unable to compete with NADPH for the pathway of cholesterol synthesis, resulting in more cholesterol synthesized at the first hour.Citation39 In addition, the damage to liver cells reduced the decomposition amount of cholesterol, and thus, cholesterol accumulation eventually increased significantly compared with the blank group at the first hour. As shown in , S1 entered into the liver at the fastest rate and was then rapidly removed by the hepatic cells. Free radicals were produced so quickly that the accumulated free radicals could compete with NADPH for the cholesterol synthesis pathway, resulting in a lower accumulation of cholesterol compared with the other sized NPs at the first hour. In view of the very low proportion of hepatocyte injury, hepatocyte growth and metabolism returned to normal as time passed. Moreover, 5 days later, the stimulating effect of IONPs on cholesterol amount disappeared and the cholesterol level returned to the level of the blank group.
The contents of creatinine and urea nitrogen in the blood were within the normal range. They also did not significantly vary with particle core size or PEG layer. Meanwhile, there was no significant difference of CRE/BUN between the blank group and the treatment groups, which indicated that these three kinds of IONPs did not damage the kidney function.
Conclusion
PEG surface modification could slow down the RES uptake of NPs and increase NPs half-life time in the blood, and half-life time can be prolonged with the increase of PEG molecular weight. Moreover, PEG molecular weight greatly affected NPs tissue distribution and metabolism. The liver is the main clearance organ for these PEGylated IONPs, and large-molecular-weight PEG and large particles can be cleared faster than the small ones. The results of complete blood count analysis and histopathology demonstrated that PEGylated IONPs have excellent biocompatibility and potential applications in clinical settings.
Acknowledgments
This study was financially supported by the National Natural Fund (Grant Nos 21176200, 81571809, and 81771981) and the Natural Science Foundation of Shaanxi Province (Grant Nos 2017JM2032, 2017JM2031, and 2015JM2063).
Disclosure
The authors report no conflicts of interest in this work.
References
- CaruthersSDWicklineSALanzaGMNanotechnological applications in medicineCurr Opin Biotechnol2007181263017254762
- LeeJHHuhYMJunYWArtificially engineered magnetic nanoparticles for ultra-sensitive molecular imagingNat Med2007131959917187073
- KimBHLeeNKimHLarge-scale synthesis of uniform and extremely small-sized iron oxide nanoparticles for high-resolution T1 magnetic resonance imaging contrast agentsJ Am Chem Soc201113332126241263121744804
- RahmeKChenLHobbsRGMorrisMAO’DriscollCHolmesJDPEGylated gold nanoparticles: polymer quantification as a function of PEG lengths and nanoparticle dimensionsRSC Adv201331760856094
- NissinenTNäkkiSLaaksoHTailored dual PEGylation of inorganic porous nanocarriers for extremely long blood circulation in vivoACS Appl Mater Interfaces2016848327233273127934159
- IliumLDavisSSWilsonCGThomasNWFrierMHardyJGBlood clearance and organ deposition of intravenously administered colloidal particles. The effects of particle size, nature and shapeInt J Pharm1982122–3135146
- SchipperMLIyerGKohALParticle size, surface coating, and PEGylation influence the biodistribution of quantum dots in living miceSmall20095112613419051182
- LiuXLFanHMYiJBOptimization of surface coating on Fe3O4 nanoparticles for high performance magnetic hyperthermia agentsJ Mater Chem2012221782358244
- JainTKReddyMKMoralesMALeslie-PeleckyDLLabhasetwarVBiodistribution, clearance, and biocompatibility of iron oxide magnetic nanoparticles in ratsMol Pharm20085231632718217714
- ZhangHLiLLiuXLUltrasmall ferrite nanoparticles synthesized via dynamic simultaneous thermal decomposition for high-performance and multifunctional T1 magnetic resonance imaging contrast agentACS Nano20171143614363128371584
- VinogradovSVBronichTKKabanovAVNanosized cationic hydro-gels for drug delivery: preparation, properties and interactions with cellsAdv Drug Deliv Rev200254113514711755709
- ParkJYDakshaPLeeGHWooSChangYHighly water-dispersible PEG surface modified ultra small superparamagnetic iron oxide nanoparticles useful for target-specific biomedical applicationsNanotechnology2008193636560321828874
- PetrosRADesimoneJMStrategies in the design of nanoparticles for therapeutic applicationsNat Rev Drug Discov20109861562720616808
- JokerstJVLobovkinaTZareRNGambhirSSNanoparticle PEGylation for imaging and therapyNanomedicine20116471572821718180
- DosioFArpiccoSBrusaPStellaBCattelLPoly(ethylene glycol)-human serum albumin-paclitaxel conjugates: preparation, characterization and pharmacokineticsJ Control Release2001761–210711711532317
- OwensDEPeppasNAOpsonization, biodistribution, and pharmacokinetics of polymeric nanoparticlesInt J Pharm200630719310216303268
- KimSShinIGLeeYMAmphiphilic diblock copolymeric nanospheres composed of methoxy poly(ethylene glycol) and glycolide: properties, cytotoxicity and drug release behaviourBiomaterials199920111033104210378803
- PerryJLReuterKGKaiMPPEGylated PRINT nanoparticles: the impact of PEG density on protein binding, macrophage association, biodistribution, and pharmacokineticsNano Lett201212105304531022920324
- StarkWJNanoparticles in biological systemsAngew Chem Int Ed Engl20115061242125821290491
- LongmireMChoykePLKobayashiHClearance properties of nanosized particles and molecules as imaging agents: considerations and caveatsNanomedicine20083570371718817471
- SahayGAlakhovaDYKabanovAVEndocytosis of nanomedicinesJ Control Release2010145318219520226220
- JiaZSongLZangFActive-target T1-weighted MR imaging of tiny hepatic tumor via RGD modified ultra-small Fe3O4 nanoprobesTheranostics20166111780179127570550
- ParkJAnKHwangYUltra-large-scale syntheses of monodisperse nanocrystalsNat Mater200431289189515568032
- YuWWFalknerJCYavuzCTColvinVLSynthesis of monodisperse iron oxide nanocrystals by thermal decomposition of iron carboxylate saltsChem Commun (Camb)2004202023062307
- MaPLuoQChenJIntraperitoneal injection of magnetic Fe3O4-nanoparticle induces hepatic and renal tissue injury via oxidative stress in miceInt J Nanomedicine2012784809481822973100
- UnniMUhlAMSavliwalaSThermal decomposition synthesis of iron oxide nanoparticles with diminished magnetic dead layer by controlled addition of oxygenACS Nano20171122284230328178419
- BunkerAPoly(ethylene glycol) in drug delivery, why does it work, and can we do better? All atom molecular dynamics simulation provides some answersPhys Procedia20123432433
- ZhouHFanZDengJHyaluronidase embedded in nanocarrier PEG shell for enhanced tumor penetration and highly efficient antitumor efficacyNano Lett20161653268327727057591
- YamaokaTTabataYIkadaYDistribution and tissue uptake of poly(ethylene glycol) with different molecular weights after intravenous administration to miceJ Pharm Sci19948346016068046623
- MooreAGrimmJHanBSantamariaPTracking the recruitment of diabetogenic CD8+ T-cells to the pancreas in real timeDiabetes20045361459146615161749
- NeubergerTSchöpfBHofmannHHofmannMvon RechenbergBSuperparamagnetic nanoparticles for biomedical applications: possibilities and limitations of a new drug delivery systemJ Magn Magn Mater20052931483496
- YangWPetersJIWilliamsROInhaled nanoparticles – a current reviewInt J Pharm20083561–223924718358652
- TsoiKMMacparlandSAMaXZMechanism of hard-nanomaterial clearance by the liverNat Mater201615111212122127525571
- YuMZhengJClearance pathways and tumor targeting of imaging nanoparticlesACS Nano2015976655667426149184
- WangBHeXZhangZZhaoYFengWMetabolism of nanomaterials in vivo: blood circulation and organ clearanceAcc Chem Res201346376176923964655
- ChenZChenHMengHBio-distribution and metabolic paths of silica coated CdSeS quantum dotsToxicol Appl Pharmacol2008230336437118495192
- MacpheePJSchmidtEEGroomACIntermittence of blood flow in liver sinusoids, studied by high-resolution in vivo microscopyAm J Physiol19952695 Pt 1G692G6987491960
- PrabhuSMutalikSRaiSUdupaNRaoBSSPEGylation of superparamagnetic iron oxide nanoparticle for drug delivery applications with decreased toxicity: an in vivo studyJ Nanopart Res20151710412433
- NesWDBiosynthesis of cholesterol and other sterolsChem Rev2011111106423645121902244