
 ?Mathematical formulae have been encoded as MathML and are displayed in this HTML version using MathJax in order to improve their display. Uncheck the box to turn MathJax off. This feature requires Javascript. Click on a formula to zoom.
Abstract
Background
Numerous studies have proposed the use of fluorescent semiconductor nanoparticles or quantum dots (QDs) as novel tools to label cells and tumors. However, QD applications are limited by their toxicity in biological systems and little is known about whether QDs affect the capacity of cancer cells to metastasize. Previously, we described the “biomimetic” synthesis of CdTe-QDs (QDs-glutathione [GSH]) with increased biocompatibility and the potential utility in labeling cells.
Purpose
In order to determine the feasibility of using QDs-GSH as a tool for tracking tumor cells during early metastasis, we characterized here for the first time, the in vitro and in vivo effects of the incorporation of green or red biomimetic QDs-GSH into B16F10 cells, a syngeneic mouse melanoma line for metastasis assays in C57BL/6 mice.
Methods
B16F10 cells were labeled with green or red biomimetic QDs-GSH in the presence or absence of n-acetylcysteine. Then, migration, invasion and proliferation of labeled B16F10 were evaluated in vitro. Finally, the B16F10 cells labeled with red QDs-GSH were used to monitor in vivo lung metastasis at early time points (5 minutes to 24 hours) or after 21 days in C57BL/6 mice.
Results
We developed a methodology that allows obtaining QDs-GSH-labeled B16F10 cells (nearly 100% viable labeled cells), which remained viable for at least 5 days and migrated similarly to control cells. However, proliferation, invasion, and the capacity to form metastatic nodules in the lungs were severely attenuated. Fluorescence imaging revealed that distribution/accumulation of QDs-GSH-labeled B16F10 cells could be tracked following injection into C57BL/6 mice (syngeneic preclinical metastasis model) and that these cells preferentially accumulated in the perialveolar area in lungs as early as 5 minutes post-injection.
Conclusion
The methodology described here represents a useful alternative for monitoring initial events during tumor cell metastasis.
Introduction
Cancer is a leading cause of death world-wideCitation1 and frequently attributable to tumor cell dissemination to distant organs, a process referred to as metastasis.Citation2,Citation3 The evolution of metastasis in vivo is difficult to follow, mainly because only a few tumor cells that enter the blood stream successfully colonize distant organs in a clinically detectable fashion.Citation3 Standard in vivo experimental approaches to study metastasis involve the injection of metastatic cells into the blood stream of a mouse and subsequent evaluation of distant organ invasion/colonization as metastatic foci after sacrificing the animal, generally several weeks post-inoculation of the tumor cells. Accordingly, these traditional methods are considered “black box” experiments, given that the events occurring between initial administration of cells and metastatic tumor formation in the target organ cannot be directly observed.Citation4
For in vivo imaging studies, fluorescence stands out over other techniques due to its low cost, high signal as well as spatial and temporal resolution, and the possibility of simultaneously evaluating multiple labels.Citation4,Citation5 The main disadvantages of fluorescence-based techniques include the instability of fluorescent probes and autofluorescence of biomolecules.Citation4 In the last decade, sensitivity, versatility and stability of fluorescence imaging applications have increased notably, thanks to the development of semiconductor nanoparticles (NPs) or quantum dots (QDs).Citation4–Citation6
QDs are inorganic, semiconducting, and fluorescent NPs, ranging in size from 1 to 20 nm approximately.Citation7–Citation9 The QD size determines their fluorescence emission wavelength, which may vary from 450 nm (blue-green) to 650 nm (red).Citation7,Citation8,Citation10,Citation11 QDs possess a number of spectroscopic properties that make them particularly interesting for studies in vivo: 1) elevated resistance to chemical degradation and photobleaching; 2) narrow and almost symmetric fluorescence peaks; 3) a broad light absorption spectrum that allows fine-tuning for processing of optical images and multispectral analysis of multiple objects simultaneously;Citation7,Citation10,Citation11 and 4) a sensitivity that may be 2–3-fold higher than other organic fluorophores commonly used for detection in tissues.Citation10,Citation11 The aforementioned characteristics of QDs make them a promising tool for tumor and/or cell labeling, raising the specter of being able to track essentially real-time tumor cell migration, and their accumulation in distant organs.Citation12
A major disadvantage of using QDs in biological systems is their toxicity associated with the formation of reactive oxygen species (ROS) and the release of heavy metal ions from the QDs core (ie, Cd+2 and Pb+2, among others).Citation13–Citation16 These ions interact with intracellular thiolated proteins and glutathione (GSH), thereby altering the cellular redox environmentCitation16–Citation19 and these changes likely affect the behavior of QDs-labeled metastatic cells.Citation20 More recently, in an attempt to bypass these limitations, a new generation of cadmium-free QDs was developed, with essentially the same spectroscopic advantages but lacking detrimental effects linked to the presence of cadmium. Nonetheless, some toxic effects attributable to physical and surface properties of these QDs remain.Citation21
In this perspective, a few years ago, we developed a protocol to synthesize, in an ecofriendly and biocompatible manner, cadmium-telluride QDsCitation8 (Patent No US 20130284979).Citation22 This method, referred to as “Biomimetic,” permits obtaining rapidly and easily, hydrophilic QDs, stabilized with GSH on their surface (QDs-GSH), which emit fluorescence between 480 nm (green) and 650 nm (red), depending upon their size.Citation8,Citation9 QDs-GSH fluorescence was shown to remain stable for months when kept at room temperature. Moreover, QDs-GSH do not precipitate in buffers, cells, or bacterial culture media, in contrast to classic QDs.Citation8 It is noteworthy that for QDs-GSH, no significant detrimental effects on human gastric cancer cell (MKN45) viability and morphology were detected after QDS-GSH internalization, even when incubated at concentrations up to 200 μg/mL.Citation8,Citation9,Citation23 Nevertheless, it still remained to be determined how QDs-GSH affect migration, invasion, and metastasis of cancer cells.
In the current study, we extensively characterized the effects of QDs-GSH internalization on the viability, proliferation, and invasion in vitro, as well as lung metastasis in vivo of B16F10 murine melanoma cells in syngeneic C57BL/6 mice, a preclinical melanoma model.Citation24,Citation25 QDs-GSH-labeled B16F10 cells were used to track the early accumulation/distribution of these metastatic cells in C57BL/6 mice. Although QDs-GSH internalization severely reduced the ability of B16F10 cells to form visible metastatic nodules 21 days post-injection, the QDs-GSH-labeled B16F10 cells could be successfully tracked during initial colonization of distant organs including the lung.
Materials and methods
QDs-GSH chemical synthesis
QDs-GSH were synthesized by protocols previously described by Pérez-Donoso et al.Citation8,Citation22 Citrate/NaBH4 15 mM (pH=9.4) solution was used as the synthesis buffer, to which CdCl2 40 μM, K2TeO310 μM, and GSH 10 mM were added. The synthesis solution was incubated at 90°C shaking vigorously for 2 (green QDs-GSH [gQDs-GSH]) or 6 hours (red QDs-GSH [rQDs-GSH]) and the synthesis reaction was stopped by cooling to 4°C. QDs-GSH were dialyzed in Citrate/NaBH4 15 mM at pH 9.4, during 2 hours. Afterwards, QDs-GSH were precipitated using 2 volumes of ethanol for 10 minutes at −20°C. Solutions were then centrifuged at 24,000× g at 4°C for 20 minutes. Pellets were purified and vacuum dried for 24 hours at room temperature. Finally, QDs were weighed and dissolved in nanopure water.
QDs-GSH characterization
Solutions of different QDs-GSH (10 mg/mL) were charac-terized by spectroscopy. Characterization was performed in 96-well plates, using a multimodal multiplate reader (fluorescence and absorbance) (Sinergy-H1M; Biotek). Size and zeta potential were determined by dynamic light scattering and laser electrophoresis Doppler, respectively (Zetasizer nano S90 light; Malvern Instruments Limited, Malvern, UK). The core size of rQDs-GSH was determined by using a JEOL/JEM 1200 EX II transmission electron microscope ().
Cell culture and QDs-GSH incubation
B16F10 cells (provided originally by Dr Laurence Zitvogel, Institut Gustave Roussy, Villejuif, France) were cultured for 24 hours in Roswell Park Memorial Institute medium (RPMI medium) (Gibco™; Thermo Fisher Scientific, Waltham, MA, USA) supplemented with 10% fetal bovine serum (FBS; Bioind) and antibiotics (penicillin 100 UI/mL, streptomycin 100 μg/mL), at 37°C in 5% CO2. All procedures and the use of these cells were approved by the unit of risk prevention and biosafety, medical school, University of Chile and the institutional committee of care and use of animals (CICUA) of the University of Chile. Afterwards, QDs-GSH treatments were performed with the previously described culture medium supplemented with lipofectamine 4 μL/mL (Invitrogen), plus 0, 50, 100, 200, or 400 μg/mL of each QDs-GSH. N-acetyl-cysteine (NAC) treatments of 0, 2, 4, 8, or 10 mM were performed using the same conditions, but only for rQDs-GSH.
Fluorescence-activated cell sorting (FACS)
Cell viability, labeled viable cells, mean fluorescence intensity (MFI) and ROS levels were determined by FACS flow cytom-etry. B16F10 cells treated with red and green QDs-GSH were washed twice with PBS, detached with trypsin-EDTA 0.5%, and centrifuged at 150× g for 5 minutes. Then, cell pellets were washed with Flow Buffer (BD Biosciences, San José, CA, USA) and centrifuged as mentioned earlier. B16F10 cells treated with gQDs-GSH were incubated for 10 minutes with propidium iodide (PI) 10 μg/mL (Thermo Fisher Scientific) for death cell differentiation. On the other hand, B16F10 cells treated with rQDs-GSH were tested for green live cells-labeling (Calcein), with LIVE/DEAD® Viability/Cytotoxicity Kit, for mammalian cells (Thermo Fisher) dilution 1:100,000 to determine viability and with dihydrodichlorofluorescein (H2DCFDA) (Invitrogen) dilution 1:10,000 to determine ROS levels. Five thousand events were analyzed to determine size (forward scatter [FSC]) and granularity parameters (side scatter [SSC]), excluding cell debris. Cellular gQDs-GSH-fluorescence, cellsH2DCFDA and cellsCalcein were determined using the FITC channel (green fluorescence); rQDs-GSH and PI mark were tracked in the PerCP-Cy5 channel (red fluorescence). Both emissions were obtained by laser excitation at 488 nm. The percentage of viable labeled cells was obtained, for either red- or green-labeled cells, with the following equation:
MFI was determined for viable QDs-labeled cells and control cells by FACs. Data were analyzed using the FCS Express four plus research edition software (De Novo Software, Los Angeles, CA, USA).
Confocal microscopy
Viable cells labeled or not with QDs-GSH were evaluated using a Zeiss Microscope model LSM 700. The excitation laser was set at 488 nm. Green and red fluorescence were tracked at 510 and 600 nm, respectively. All optical sections obtained for co-localization studies were processed with ImageJ 1.47 v software (National Institutes of Health, USA).
For invasion assays, fixed cells attached to the lower membrane surface were visualized using a Zeiss Microscope, model LSM 700. Wavelength excitation laser was set at 405 nm. DAPI and rQDs-GSH fluorescence were tracked at 460 and 580 nm, respectively. Images of either B16F10 or B16F10QDs-GSH-10NAC cells attached to the lower side of the well membrane were obtained. Both types of cells were labeled with DAPI 1:1,000 for 5 minutes. Afterwards, membranes were washed twice and fixed in DACO fluorescent solution.
Fluorescence microscopy
Membrane-attached cells after migration were visualized using a CKX41 inverted microscope and a fluorescence light source U-LH100HG (Olympus, Japan). Images were processed with ImageJ 1,47 v software (National Institutes of Health, USA).
Quantification of reduced thiols
B16F10 and MKN45 cells were cultured until they reached ~90% confluence in 100 mm plates. Afterwards, cells were collected, washed with PBS and resuspended in 200 μL sulfosalicylic acid 5% (SSA). Samples were divided into two equivalent portions, one for total protein measurement (BCA assay) and the other for the determination of intracellular thiols. Cells were lyzed using 20 freeze/thaw cycles and subsequently centrifuged at 32,000× g for 20 minutes. Supernatants were collected and reduced thiols (RSH) were quantified with Ellman’s reagent. Following incubation for 5 minutes at 37°C, the absorbance of super-natants at 412 nm was determined.Citation26,Citation27 Calibration curves were obtained using GSH solutions of known concentration. Intracellular RSH levels were normalized to cellular protein content in milligrams.
Migration assays
Assays were performed using 8 μm pore polycarbonate membrane transwells (diameter 6.5 mm) (Corning, NY, USA). After coating the lower membrane surface with 100 μL of fibronectin 2 μg/mL, membranes were washed with PBS. Afterwards, tran-swells were immersed in RPMI medium supplemented with 10% FBS. Suspensions of 1.5×10⁵ cells (B16F10, B16F10QDs-GSH-4NAC or B16F10QDs-GSH-10NAC) prepared in serum-free RPMI medium were seeded into the upper chamber of transwells. After 2 hours, inserts were collected and the cells present in the upper chamber were removed. Cells attached to the lower membrane surface after migration were fixed and stained with a 0.1% crystal violet solution in methanol 20% for 2 hours at 37°C. Membranes were then gently washed, dried at room temperature, mounted in Mowiol, and observed under a light microscope. At least seven fields were evaluated per experiment to determine the number of transmigrated cells.
Invasion assays
Assays were performed using Matrigel Invasion Chambers (8 μm; Corning, NY, USA), which were rehydrated with RPMI media supplemented with 10% FBS. Subsequently, suspensions of either B16F10 or B16F10QDs-GSH-10NAC cells (2×10⁵) prepared in serum-free RPMI medium were seeded into the upper transwell chamber. After 24 hours, inserts were collected and cells remaining in the upper chamber were removed. Cells that invaded the matrigel and then attached to the lower membrane surface were fixed in cold methanol for 2 minutes and then stained with 1% Toluidine Blue for 2 hours. Membranes were then gently washed, dried at room temperature, mounted in Mowiol, and observed under a light microscope. At least seven fields were evaluated per experiment to determine the number of cells that invaded the matrigel.
rQDs-GSH cell labeling persistence and proliferation assay
This assay was performed using 1×10⁵ viable cells (B16F10 cells and B16F10QDs-GSH-10NAC). Cells were seeded in 60 mm plates and cultured with RPMI-supplemented media. Afterwards, cells were detached with trypsin-EDTA 0.5% and centrifuged at 150× g for 5 minutes. Cell pellets were washed in PBS and centrifuged at 150× g for 5 minutes; the supernatants were discarded and cells were resuspended in 200 μL of FBS. Then, the total number of cells 1–5 days post-inoculation was quantified in a Neu-bauer chamber (Marienfeld Superior, Lauda-Königshofen, Germany) after trypan blue staining 0.5% (biological industries). Percentage of viability, labeled viable cells, and MFI were determined by FACS, as previously described.
In vivo metastasis assays
Experiments were done essentially following previously described protocols.Citation25 Briefly, C57BL/6 mice were injected intravenously with 2×10⁵ B16F10 or B16F10QDs-GSH-10NAC cells in 500 μL of physiological saline solution. Then, 21 days post-injection, mice were sacrificed. Lungs were fixed in Fekete’s solution. Black lung tumor was separated from the rest of the lung tissue and weighed. Metastasis was expressed as black tissue mass/total lung mass percentage (%) post-fixation.
Mouse imaging
C57BL/6 mice were injected intravenously with 2×10⁵ B16F10 or B16F10QDs-GSH-10NAC cells, in 500 μL of physiological saline solution. Mice were observed for 6 hours using the in vivo imaging system (IVIS; In-Vivo FX PRO; Bruker, Billerica, MA, USA). Excitation and emission wavelengths were 410 and 600 nm, respectively. Afterwards, mice were euthanized and lungs were collected for ex-vivo imaging.
In vivo imaging
C57BL/6 mice were injected intravenously with 2×10⁵ B16F10Control and B16F10QDs-GSH-10NAC cells in 500 μL of physiological saline solution. Mice were sacrificed at 5 minutes, 30 minutes, 2 hours, 6 hours, and 24 hours post-injection. Lungs, heart, spleen, thymus, liver, and kidneys were harvested and fixed in Fekete’s solution for 1 week. Fluorescence present at the different time points was quantified using IVIS, and are shown as the average of relative optical intensity (ROI). Fluorescence data are presented as percentages, considering the baseline fluorescence of unla-beled organs as 100%.
Immunohistochemical analysis
The organs obtained from C57BL6 mice 6 and 24 hours after injection of B16F10QDs-GSH-10NAC, B16F10Calcein, or B16F10Control cells were fixed for 24 hours in pH7-buffered formalin (10%) and then paraffin-embedded. For tissue samples, 5 μm-thick serial paraffin sections were collected on silanized slides (DAKO) and deparaffinized in two consecutive 5-minute incubations with xylene. One section was then stained with hematoxylin and eosin (H&E). The others were rehydrated in two consecutive 3-minute incubations with 98% and 90% ethanol each, followed by a single incubation in Diethyl pyrocarbonate (DEPC)-treated distilled water for 5 minutes. Sections were then incubated in 2.5 μg/mL of Proteinase K (Invitrogen) at room temperature for 20 minutes and then rinsed twice for 3 minutes in DEPC-treated water. Nuclei were stained with DAPI for 5 minutes and washed. The samples were then mounted on cover slips and embedded with fluorescence mounting medium (DAKO). The images were captured using a fluorescence microscope (Olympus, Tokyo, Japan).
Proof-of-concept
B16F10 cells stably transfected with either the empty pLacIOP vector [B16F10(Mock)] or the vector containing the Caveolin-1 (CAV1)-encoding insert [B16F10(CAV-1)] have been described previously.Citation25,Citation28 These cells were then labeled with rQDs-GSH as described earlier (B16F10QDs-GSH-10NAC). C57BL/6 mice were injected intravenously with 2×10⁵ of the respective cells in 500 μL of physiological saline solution. Mice were sacrificed 6 hours post-injection of cells and lungs were fixed in Fekete’s solution for 1 week. Then, fluorescence was quantified (average ROI) using the IVIS system.
Statistical analysis
Data shown are the average±SEM of at least three independent experiments. Statistical significance was determined at a 95% CI using the nonparametric Mann–Whitney test, for the comparison of two groups.
All in vivo assays were performed as blind studies (in vivo metastasis assays and in vivo images) or double-blind studies (mice and lung images, immunohistochemistry assay, and proof-of-concept). All in vivo experiments were performed following the protocols of management and care of animals established by the CICUA of the University of Chile. CICUA approval code: CBA # 0837 FMUCH.
Results and discussion
Synthesis and characterization of QDs-GSH
In this study, green and red QDs-GSH were synthesized using the biomimetic method developed by our laboratory.Citation8,Citation9,Citation22 Data summarizing the size distribution, zeta potential, and emission peak wavelengths of QDs-GSH are shown in . For gQDs-GSH, zeta potential values were greater than those of rQDs-GSH. GSH is a tripeptide, with a thiol and two carboxyl-terminal groups, which confer negative charges to the molecule.Citation17 Thus, the elevated zeta potential is indicative of a higher GSH content in the gQDs-GSH. We previously characterized by X-ray photoelectron spectroscopy (XPS) the GSH-QD capping and reported a lower GSH content in rQDs-GSH than gQDs-GSH.Citation23 Importantly, differences in QDs size (gQDs-GSH vs rQDs-GSH) and charge have previously been shown to affect cell viability.Citation7,Citation9,Citation15,Citation21,Citation29 In addition, we have previously reported that green biomimetic QDs-GSH contain less Cd2+ than rQDs-GSH (18% and 30%, respectively).Citation8,Citation9 Therefore, in vitro assays were performed to evaluate cell behavior after incorporation of gQDs-GSH and rQDs-GSH.
Table 1 Size (hydrodynamic diameter), Z potential, and emission peaks of green and rQDs-GSH
Characterization of QDs-GSH internalization and effects in B16F10 cells
B16F10 murine melanomas are cancer cells with an elevated metastatic potential that specifically accumulate in the lungs following tail vein injection of syngeneic C57BL/6 recipient animals, where they form readily detectable, pigmented metastatic nodules 15–21 days post-injection.Citation24,Citation25 This is a well-established preclinical model that is employed to evaluate the metastatic potential of cancer cells.Citation24,Citation25 To label the B16F10 cells, they were incubated with gQDs-GSH or rQDs-GSH at concentrations ranging from 0 (control) to 50, 100, 200, or 400 μg/mL, in the presence of 4 μL/mL of lipofectamine, for 24 hours. Lipofectamine was used to promote cell internalization of QDs-GSH, following a previously described protocolCitation8 (Patent No US 20130284979).Citation22 Then, cell viability, percentage of viable labeled cells, and the MFI of cells transfected with different concentrations of QDs-GSH were determined by flow cytometry (). For gQDs-GSH, cell viability in general and viability of labeled cells were substantially reduced at concentrations of 50 μg/mL or higher (). In this respect, rQDs-GSH were significantly less toxic and also the MFI for labeled cells was higher in comparison to those obtained with gQDs-GSH (). Note that rQDs-GSH only induced significant decreases in cell viability when used at higher concentrations (400 μg/mL). These observations are consistent with reports by Lovrić et al,Citation30 who showed that smaller sized QDs more readily crossed intracellular membranes to enter the nucleus and other subcellular compartments, like mitochondria.Citation8,Citation31 The nuclear pore complex permits entry of small molecules up t│9 nm in diameter by passive diffusion.Citation32 Our results show that gQDs-GSH and rQDs-GSH possess a hydrodynamic diameter of ~1.8 and ~5.1 nm (), respectively, indicating that both QDs-GSH probably can cross the nuclear membrane, although gQDs-GSH are likely do so more efficiently. However, QDs toxicity may also relate to the differences in zeta potential between gQDs-GSH and rQDs-GSH, given that greater negative zeta potential values, as is the case for gQDs-GSH, are known to reduce cell survivalCitation31 ().
Figure 1 B16F10 cells viability after rQDs-GSH and gQDs-GSH incorporation.
Notes: (A) Dot plot of B16F10 cells labeled with gQDs-GSH or rQDs-GSH (100 μg/mL), and B16F10 control cells. Events were gated to show B16F10 gQDs-GSH+ or rQDs-GSH+ cells and live or dead B16F10 cells. (B) Effects on B16F10 cell viability of treatments with lipofectamine and gQDS-GSH or rQDs-GSH. (C) Comparison of viable labeled cells treated with either rQDs-GSH or gQDs-GSH, and lipofectamine. (D) Comparison of MFI associated with either rQDs-GSH or gQDs-GSH in viable B16F10 cells. Results were averaged from 3 to 4 independent experiments (n=3–4). Data were analyzed using the nonparametric Mann–Whitney test. Statistically significant differences compared with the controls and different treatments are indicated.
Abbreviations: GSH, glutathione; gQDs-GSH, green QDs-GSH; MFI, mean fluorescence intensity; QDs, quantum dots; rQDs-GSH, red QDs-GSH.
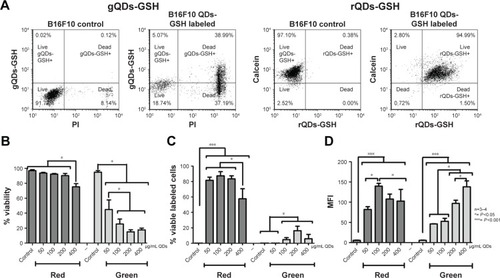
Of note, the detrimental effects observed in B16F10 cells incubated with gQDs-GSH were significantly elevated in comparison to the toxic effects of biomimetic QDs previously reported for MKN45 cells.Citation8,Citation9,Citation23 This may simply reflect cell-specific parameters of predisposition to QDs-GSH toxicity, as has been reported previously in different cell lines exposed to inorganic NPs.Citation33 Alternatively, it is well established that the generation of ROS represents one of the main mechanisms by which QDs induce damage to biological systems.Citation13–Citation15,Citation19 Intracellular thiols (RSH) play an important role as mediators of tolerance to intracellular ROS.Citation17,Citation18 Thus, we hypothesized that the differences in sensitivity to QDs-GSH observed for B16F10 and MKN45 cells may be due to different levels of RSH. To evaluate this possibility, intracellular RSH levels were determined in each cell type. As suspected, significantly lower RSH levels were observed in B16F10 cells than in MKN45 cells, suggesting that B16F10 cells may, for this reason, tolerate to a lesser extent QD-induced oxidative damage than MKN45 cells ().
NAC treatment reduces rQDs-GSH effects in B16F10 cells and increases cell labeling
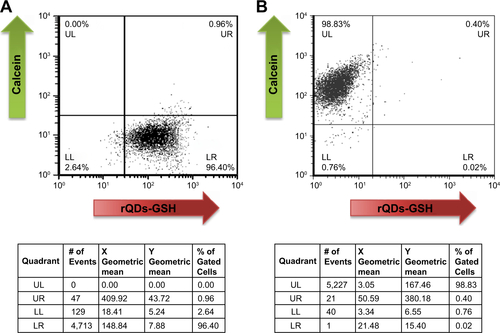
QDs increase ROS in biological systems,Citation14 and ROS, on the other hand, affects migration and invasion of metastatic cells.Citation34 Therefore, we hypothesized that NAC should ameliorate detrimental QDs-GSH effects on metastatic cells, given that NAC increases intracellular RSH levels.Citation17 Moreover, NAC is generally beneficial and protects cells against organic stress induced by inorganic NPs,Citation33 as well as provides greater protection against QDs damage than other non-thiol anti-oxidants, such as trolox.Citation30 Given our results showing that incubation of cells with 100 μg/mL of rQDs-GSH resulted in >80% viable labeled cells, similar to the percentage of viable labeled cells reported by Voura et al,Citation12 with the best mean MFI values (), as well as the fact that fluorescence emission at longer wavelengths is absorbed to a lesser extent by tissues,Citation4 we focused on characterizing the behavior of B16F10 cells after labeling with 100 μg/mL rQDs-GSH.
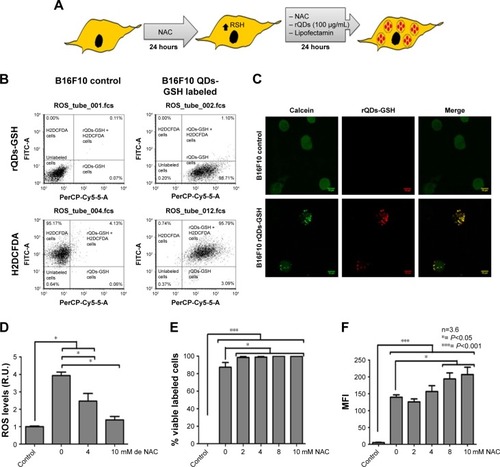
To assess the benefits of NAC, B16F10 cells were cultured as previously mentioned, but this time different concentrations of NAC were added in both culture steps (). Afterwards, cell viability, ROS levels, viable labeled cells, and MFI associated with QDs-GSH presence in viable cells were detected by flow cytometry (). rQDs-GSH were incorporated by B16F10 cells and intracellular distribution was similar () to that described in previous studies.Citation8,Citation9,Citation23 ROS levels were lower when cells were co-incubated with rQDs-GSH in the presence of NAC (). Nearly 100% viable labeled B16F10 cells were obtained when incubated with 10 mM NAC (). Also, a general increase in MFI values after exposure to 8 and 10 mM NAC was observed (). Because fluorescence is proportional to the QDs-GSH concentration,Citation8 this suggests that addition of NAC to cell cultures promotes QDs-GSH internalization, possibly by reducing ROS formation upon QDs uptake.Citation30 Finally, NAC treatments allowed obtaining nearly 100% viable labeled cells with increased fluorescence signal and ROS levels similar to unlabeled cells.
Figure 2 Effects of NAC treatment on ROS levels, viability, and incorporation of rQDs-GSH into B16F10 cells.
Notes: (A) Schematic summarizing the labeling assays in the presence of NAC. (B) Dot plot of B16F10 cells labeled with H2DCFDA or rQDs-GSH (100 μg/mL) and B16F10 control cells. Events were gated to show B16F10 H2DCFDA+ or rQDs-GSH+ B16F10 cells. (C) Confocal imaging of viable B16F10 cells (Calcein labeled) with or without rQDs-GSH. (D) ROS levels of B16F10 cells labeled with 100 μg/mL of rQDs-GSH in the presence of 0, 4, or 10 mM NAC during the labeling process. (E) Percentage of viable rQDs-GSH-labeled B16F10 cells in the presence of different NAC concentrations. (F) MFI associated with QDs-GSH fluorescence in viable rQDs-GSH-labeled B16F10 cells in the presence of different NAC concentrations. Results were averaged from 3 to 6 independent experiments (n=3–6). Data were analyzed using the nonparametric Mann–Whitney test. Statistically significant differences compared with the controls and different treatments are indicated.
Abbreviations: GSH, glutathione; H2DCFDA, dichlorodihydrofluorescein; hrs, hours; MFI, mean fluorescence intensity; NAC, N-acetylcysteine; QDs, quantum dots; rQDs-GSH, red QDs-GSH.
Effects of rQDs-GSH and NAC treatment on functional parameters of B16F10 cells
To compare NAC effects, cells were incubated with 100 μg/mL of rQDs-GSH in the presence of either 4 (maximum NAC concentration that did not significantly increase the MFI) or 10 mM NAC (upper limit NAC concentration used for treatment) to generate B16F10QDs-GSH-4NAC and B16F10QDs-GSH-10NAC, respectively. Subsequently, cells were evaluated in vitro in migration and invasion assays.
Migration was 2.8 times higher for B16F10QDs-GSH-4NAC than control cells (). On the other hand, no differences in migration were observed when B16F10QDs-GSH-10NAC cells were compared with control cells. This suggests that B16F10 cells with internalized rQDs-GSH increase migration at lower NAC concentrations, likely as the consequence of increased intracellular ROS levels () that are known to promote cancer cell migration.Citation34 Therefore, NAC pretreatment permitted ameliorating undesirable effects observed following QDs-GSH internalization related to intracellular ROS levels, and allowed obtaining QDs-GSH-labeled B16F10 cells that migrated like the unlabeled cells.
Figure 3 Migration and invasion of B16F10 cells labeled with rQDs-GSH in the presence of NAC.
Notes: (A) Images obtained by epifluorescence optical microscopy of migratory B16F10 control, B16F10QDs-GSH-4NAC, and B16F10QDs-GSH-4NAC cells. In circles, migratory cells; white arrows: fluorescent cells; black arrows: migratory rQDs-GSH-labeled cells. (B) Quantification of the migration of B16F10QDs-GSH-4NAC, B16F10QDs-GSH-10NAC, and control cells. (C) Images obtained by epifluorescence optical microscopy of invading B16F10 control, B16F10QDs-GSH-4NAC, and B16F10QDs-GSH-4NAC cells. In circles, migratory cells; white arrows: fluorescent cells; black arrows: migratory rQDs-GSH-labeled cells. (D) Confocal microscopy of invading B16F10QDs-GSH-4NAC and B16F10 cells. (E) Quantification of the invasiveness of B16F10QDs-GSH-4NAC, B16F10QDs-GSH-10NAC, and control cells. Results were averaged from three independent experiments (n=3). Data were analyzed using the nonparametric Mann–Whitney test. Statistically significant differences compared with the controls and different treatments are indicated.
Abbreviations: B16F10QDs-GSH-4NAC, B16F10 cells labeled with rQDs-GSHin presence of 4 mM of NAC; B16F10QDs-GSH-10NAC, B16F10 cells labeled with rQDs-GSH in presence of 10 mM of NAC; GSH, glutathione; NAC, N-acetylcysteine; QDs, quantum dots; rQDs-GSH, red QDs-GSH.
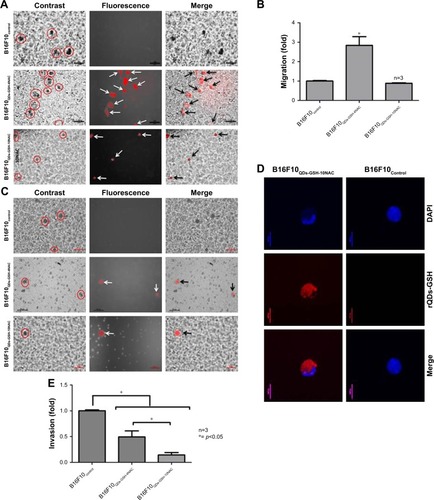
Likewise, rQDs-GSH-labeled B16F10 cells were still able to invade in a matrigel invasion assay (), maintaining the labeling associated with QDs-GSHr (), but did so much less effectively. rQDs-GSH presence significantly decreased invasion for both B16F10QDs-GSH-4NAC and B16F10QD-sQDs-GSH-10NAC, to 41% and 6%, respectively (). These results suggest that greater amounts of internalized rQDs-GSH () correlate with a reduction in cell invasiveness. Thus, because augmenting intracellular ROS levels increases cell metastasis,Citation34 our results indicate that internalization of rQDs-GSH in B16F10 cells decreases invasiveness in a ROS-independent fashion. A possible explanation might be that Cd2+ in rQDS-GSH reduces the activity of matrix metalloproteinases (MMPs), which are zinc-containing endopeptidases capable of degrading extracellular matrix (ECM) proteins.Citation35 MMPs are exocytosed by metastatic cells and mediate tumor microenvironment changes during cancer progression, favoring metastatic cell invasion.Citation36 B16F10 exposure to Cd+2 has been shown to reduce cell invasiveness due to upregulation of tissue inhibitor of metal-loproteinase-1 (TIMP-1) expression, which is Cd+2-dependent.Citation37 In addition, our results show that the methodology employed here permits obtaining rQDs-GSH-labeled B16F10 cells that migrate similarly to unlabeled cells, but display dramatically reduced invasiveness. These results suggest that the invasiveness of rQDs-GSH-labeled cells is reduced by a cadmium-dependent mechanism, but further experimentation beyond the scope of this study is required to confirm this possibility.
Therefore, rQDs-GSH-labeled cells can be useful for in vivo studies of metastasis steps where migration is relevant (ie, distribution of metastatic cells throughout the body and transendothelial migration). With this in mind, we envisioned that B16F10QDS-GSH-10NAC cells might be useful to monitor early steps in metastasis. To this end, viability, proliferation, and QD-clearance were evaluated for 5 days after labeling using B16F10QDS-GSH-10NAC cells.
Proliferation of B16F10QDS-GSH-10NAC and persistence of labeling
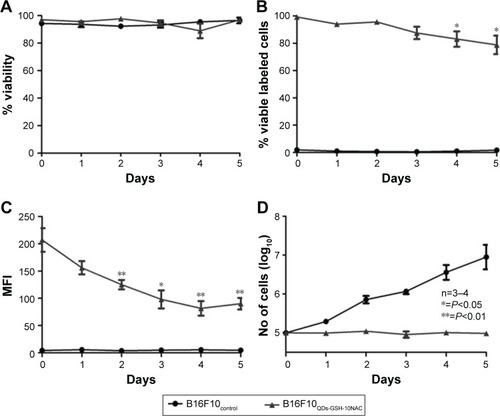
Intracellular NP content may be reduced by different mechanisms, such as cell death, cell proliferation, NP diffusion, lysosomal degradation, and/or transcytosis and exocytosis.Citation38 For example, D-penicillamine-coated QDs (DPA-QDs) were not degraded in the lysosomal compartment during the first 24 hours post-internalization,Citation39 but rather were rapidly exocytosed (half-life of 21 minutes). Therefore, it was important here to determine rQD-GSH persistence in B16F10 cells prior to the subsequent evaluation in in vivo metastasis assays. B16F10QDs-GSH-10NAC cells were cultured in RPMI supplemented with 10% BFS for 5 days and the total cell number (quantification of proliferation), cell viability, percentage of viable labeled cells, and MFI were determined after cell labeling (). B16F10QDs-GSH-10NAC viability was not substantially reduced during a 5-day period post-labeling (), although a slight decline in viability was observed after the third day (to 79%), which then remained stable up to day 5. A significant reduction in MFI was observed from the second day onwards, which resulted in a reduction of the fluorescence intensity by 43% after 5 days (). The data obtained suggest that B16F10QDs-GSH-10NAC cells remain viable with a stable percentage of viable labeled cells for at least 3 days (), and that the MFI does not vary significantly until the second-day post-labeling. Thus, the labeling methodology described here employing biomimetic QDs-GSH allows for more prolonged cell labeling than other QDs-based methodologies described in the literature (on the order of minutes).Citation39 Interestingly, B16F10QDs-GSH-10NAC cells appear unable to proliferate, since no increase in the total number of cells was observed during the 5 days of the assay (). For rQDs-GSH-labeled B16F10 cells, in the absence of NAC treatments (lower case labeling in ), the total number of cells was found to increase 24 hours post-labeling in a manner similar to unlabeled cells (), whereby viability, percentage of labeled cells, and MFI were maintained (). These results are in agreement with previous publications indicating that NP internalization may affect cellular proliferationCitation40 and that Cd2+ inhibits cell proliferation in a dose-dependent manner.Citation41,Citation42 Thus, the methodology described here has the potential to be used as a cell-labeling strategy to study early steps in vivo involved in accumulation/distribution of metastatic cells in distant organs.
Figure 4 Effects of QDs-GSH labeling on B16F10 cell proliferation and QDs-GSH signal persistence.
Notes: (A) B16F10QDs-GSH-10NAC and control cell viability. (B) Percentage of viable B16F10QDs-GSH-10NAC cells. (C) MFI of viable B16F10QDs-GSH-10NAC cells. (D) Total number of B16F10QDs-GSH-10NAC cells. Results were obtained over a 5-day period after labeling and averaged from 3 to 6 independent experiments (n=3–6). Data were analyzed using the nonparametric Mann–Whitney test. Statistically significant differences compared with the controls and different treatments are indicated.
Abbreviations: B16F10QDs-GSH-10NAC, B16F10 cells labeled with rQDs-GSH in presence of 10 mM of NAC; GSH, glutathione; MFI, mean fluorescence intensity; NAC, N-acetylcysteine; QDs, quantum dots; rQDs-GSH, red QDs-GSH.
In vivo metastasis assays
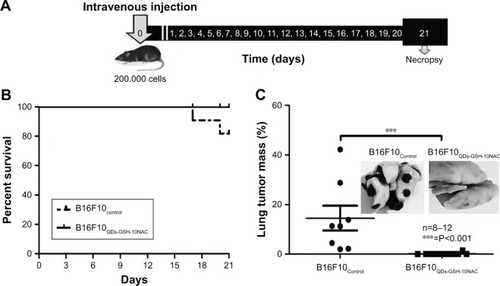
For the in vivo studies, we employed a syngeneic metastasis model in C57BL/6 mice with an intact immune system. B16F10QDs-GSH-10NAC cells were injected into the tail vein of mice and 21 days post-injection mouse survival and tumor mass in the lungs were determined (). Administration of B16F10QDs-GSH-10NAC cells did not alter mouse survival (). After necropsy, metastasis remained undetectable in over 90% of the B16F10QDs-GSH-10NAC treated mice; lung tumor mass in the only mouse with metastasis was equivalent to only 1.4% of total lung mass. To the contrary, metastatic lung nodules were detected in all control mice injected with the same number of B16F10 cells () and accounted for 14.5% of lung mass, similar to what we have described in our previous publications.Citation25,Citation28 These results show that incorporating QDs into B16F10 cells, as is the case for B16F10QDs-GSH-10NAC, significantly reduces the ability of these cells to form metastatic nodules in vivo 21 days post-injection. This is in agreement with the in vitro data showing that labeled cells neither invade nor proliferate ( and ). On the other hand, the use of B16F10 cells labeled with CdSe/ZnS QDs capped with dihydrolipoic acid (DHLA) was reported using lipofectamine-aided transfection for internalization of QDs-DHLA. However, in those experiments, the authors observed that B16F10 cells formed metastatic nodules 40 days post-injection.Citation12 These differences may be attributable to variations in the amount of QDs-GSH present and Cd2+ release inside B16F10QDs-GSH-10NAC cells. Thus, using our methodology, QDs-GSH-labeled cells were obtained that migrated similarly to unlabeled cells, but were unable to invade and proliferate.
Figure 5 In vivo metastasis assays using rQDs-GSH-labeled B16F10 cells.
Notes: B16F10QDs-GSH-10NAC and control cells were injected into the tail vein of C57BL/6 mice. After 21 days, mice were sacrificed and lungs were collected. (A) Scheme summarizing the time course of metastasis assays. (B) C57BL/6 mouse survival up to 21 days post-injection of B16F10 (dashed line) or B16F10QDs-GSH-10NAC (solid line) cells. (C) Determination of tumor mass present in lungs from C57BL/6 mice at 21 days post-injection of B16F10 control or B16F10QDs-GSH-10NAC cells. Results were averaged from
8 (B16F10 control cells) or 12 (B16F10QDs-GSH-10NAC cells) independent experiments in mice (n=8–12). Data were analyzed using the nonparametric Mann–Whitney test. Statistically significant differences compared with the controls and different treatments are indicated. Note that the data shown were obtained in a double-blind study.
Abbreviations: B16F10QDs-GSH-10NAC, B16F10 cells labeled with rQDs-GSH in presence of 10 mM of NAC; GSH, glutathione; NAC, N-acetylcysteine; QDs, quantum dots; rQDs-GSH, red QDs-GSH.
Over the last 30 years, the repertoire of compounds containing transition metals with anti-tumor properties has expanded to include compounds containing Zn, Co, Ni, Sn, Ag, and Cd.Citation43–Citation49 Among these elements, cadmium has been ascribed elevated anti-tumor effects in comparison with other transition metals.Citation43 In 2016, Sreekanth et al reported that cadmium oxide (CdO) NPs inhibited the proliferation of normal and tumor cell lines, whereby the tumor cells were more severely affected by CdO NPs.Citation44 Our study shows that QDs-GSH have potent anti-tumor effects, as evidenced by the dramatic inhibition of cell proliferation and invasion following internalization of QDs-GSH. Moreover, the ability of such QD-GSH-labeled cells to form metastatic nodules in C57BL/6 mice was ablated within the time frame analyzed. Data from the literature favor the notion that these anti-metastatic effects are related to the presence of cadmium in the QDs-GSH core. Our results highlight the need to further investigate the anti-tumor effects of QDs-GSH, bearing in mind that selective tumor accumulation should permit using these QDs-GSH both as diagnostic agents and in anti-tumor therapy (theranostics).
Here, however, we focused on evaluating the utility of B16F10QDs-GSH-10NAC in metastatic cells tracking at early stages post-injection, since they were able to migrate, but did not invade or proliferate.
In vivo distribution of B16F10QDs-GSH-10NAC cells
Previously, studies have shown that QDs can be followed by fluorescence microscopy in vitro and also to track interactions between different cell populations in vivo.Citation12,Citation50 For instance, this approach has permitted visualizing the clogging of blood vessels produced by B16-BL6 melanoma cells during metastasis.Citation45 However, it was still not possible to track the accumulation or distribution of metastatic cells by in vivo fluorescence imaging.
To assess the potential utility of B16F10QDs-GSH-10NAC cells in recording early steps of metastasis by in vivo fluorescence imaging, cells were injected () into the tail vein of C57BL/6 mice and whole animal images were obtained using the IVIS. After injection of the cells into mice, the fluorescence signal was not detectable (), likely because a number of biological molecules, including hemoglobin, absorb light between 400 and 600 nm, thereby interfering with the B16F10QDs-GSH-10NAC signal. Thus, animals were sacrificed and after necropsy at the indicated time points, organs were placed in Fekete’s solution to eliminate blood traces and then fixed as described.Citation46 Examples of lungs from C57BL/6 mice obtained after 6 hours inoculation with B16F10QDs-GSH-10NAC cells are shown (). Fluores cence due to B16F10QDs-GSH-10NAC presence in lungs was clearly distinguishable from the background fluorescence of controls (), suggesting the presence of B16F10QDs-GSH-10NAC in the lungs of C57BL/6 mice.
Figure 6 In vivo B16F10QDs-GSH-10NAC cell tracking.
Notes: B16F10QDs-GSH-10NAC cells were injected into the tail vein of C57BL/6 mice. rQDs-GSH signals were followed and quantified by imaging the signal in lungs. Organs were collected at 5 minutes, 30 minutes, 2 hours, 6 hours, and 24 hours post-injection. (A) A scheme summarizing the time course of early metastasis assays. (B) Eppendorf tubes containing B16F10control and B16F10QDs-GSH-10NAC cells used for injection in C57BL/6 mice. (C) Image showing lungs collected from C57BL/6 mice 6 hours post-injection with either control or labeled cells (duplicate). (D) Fluorescence images of lungs collected from C57BL/6 mice 6 hours post-injection with either control or labeled cells. (E–J) Quantification of rQDs-GSH-associated fluorescence in lungs, heart, kidneys, liver, spleen, and thymus of C57BL/6 mice at different time points after injection of B16F10control or B16F10QDs-GSH-10NAC cells. Results were averaged from 12 independent experiments (n=12) for lung, heart, kidney, liver, spleen, and 4–10 independent experiments (n=4–10) for thymus. Data were analyzed using the nonparametric Mann–Whitney test. Statistically significant differences compared with the controls and different treatments are indicated. Note that the data shown were obtained in a double-blind study.
Abbreviations: B16F10QDs-GSH-10NAC, B16F10 cells labeled with rQDs-GSH in presence of 10 mM of NAC; GSH, glutathione; IVIS, in vivo imaging system; NAC, N-acetylcysteine; QDs, quantum dots; rQDs-GSH, red QDs-GSH.
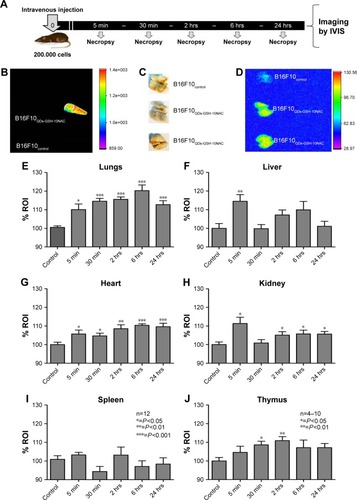
Using this approach, we determined the kinetics of B16F10 accumulation, particularly in the lungs of C57BL/6 mice. To this end, 2×10⁵ B16F10QDs-GSH-10NAC cells were injected into the tail vein of mice and then the following organs were analyzed: 1) lungs (metastatic cell target); 2) spleen, liver, and kidneys (principal QD storage organs post-intravenous injection) and; 3) heart and thymus (organs where no extensive accumulation of QDs has been previously described).Citation47,Citation48 Mice were sacrificed and organs were harvested at 5 minutes, 30 minutes, 2 hours, 6 hours, and 24 hours post-injection, and the fluorescence was detected by direct imaging of the organs (). The greatest difference was observed in lungs harvested 6 hours after B16F10QDs-GSH-10NAC injection (). Although a significant increase in fluorescence was detectable as soon as 5 minutes post-injection, the intensity increased until reaching a maximum 6 hours post-injection. B16F10 cells preferentially metastasize to the lungs of C57BL/6 mice, possibly due to their preference for laminin and/or fibronectin, two ECM proteins present surrounding small vessels of the lung, in the basal membrane and alveolar epithelium.Citation28 These data correlate with previous studies, using QDs and fluorescence microscopy, indicating that 5 minutes after administration of B16-BL6 cells into the blood stream, these cells accumulated in small lung vessels.Citation45
Several studies have shown that the majority of QDs present in the blood stream of mice rapidly accumulate in reticuloendothelial system organs (liver and spleen) and are excluded from heart and thymus.Citation51–Citation54 Nevertheless, no significant fluorescence increase in the spleen was detected when B16F10QDs-GSH-10NAC cells were injected (), while fluorescence accumulation in the thymus was detected between 30 minutes and 2 hours post-injection (). These results suggest that rQDs-GSH remain confined within B16F10 cells and are in agreement with a previous report by Voura et al, showing that QDs were not released from QDs-DHLA-labeled B16F10 cells.Citation12
The thymus is a lymphatic, endocrine, and immune organ where T cells mature and are released to the circulation.Citation53 The cytotoxic T-cells, as well as natural killer T-cells, specifically participate in the early clearance of tumor cells from the blood stream.Citation54,Citation55 Given that the blood–thymus barrier prevents direct contact between the thymus and components of the blood stream,Citation56,Citation57 the observed pronounced accumulation of fluorescence in the thymus suggests that B16F10QDs-GSH-10NAC are being rapidly recognized by T cells.
Our results indicated that B16F10QDs-GSH-10NAC cells were rapidly distributed (5 minutes) to the heart, liver, kidneys, and lungs of C57BL/6 mice and likely accumulated there by an embolic arrest process.Citation24 However, despite the initial generic distribution, fluorescence intensity decreases in the other organs and a selective enrichment of B16F10QDs-GSH-10NAC cells in lungs is observed within the first few hours post-injection. This suggests that B16F10QDs-GSH-10NAC cells maintain the “homing” reported previously,Citation24,Citation25,Citation45 and thus have the potential to be used as a tool for assessing early accumulation/distribution of metastatic cells.
To confirm the presence of B16F10QDs-GSH-10NAC cells in the lungs of C57BL/6 mice, lung sections obtained 6 hours post-injection of cells into the tail vein of C57BL/6 mice were analyzed by immunohistochemistry (). Fluorescence due to B16F10QDs-GSH-10NAC presence was observed in histological slices from mice and was clearly distinguishable from the background fluorescence of controls (), confirming the presence of B16F10QDs-GSH-10NAC cells in the lungs of C57BL/6 mice. During colonization of distant organs, the extravasation process is crucial.Citation58 Given that B16F10 cells specifically target the lung in metastasis assays, it was important to determine whether B16F10QDs-GSH-10NAC cells were capable of transmigrating through the vascular endothelium and colonizing the lungs in vivo. With this in mind, B16F10QDs-GSH-10NAC and Calcein AM-labeled B16F10 (B16F10Calcein) cells were compared by histological analysis of lung sections 6 and 24 hours post-injection of cells into the tail vein of C57BL/6 mice. Specifically, we determined the fluorescence associated with B16F10QDs-GSH-10NAC and B16F10Calcein cells in the endothelial vasculature, alveolae, and bronchi (). B16F10QDs-GSH-10NAC and B16F10Calcein cells were mostly found in the perialveolar area, after 6 and 24 hours (). In addition, the number of cells present in those areas increased after 24 hours (), suggesting that the B16F10QDs-GSH-10NAC cells transmigrated to the same extent as B16F10Calcein cells. These results are consistent with previously published studies indicating that QDs-DHLA-labeled B16F10 cells transmigrate in a manner similar to non-labeled B16F10 cells. However, the mechanism by which transmigration of QDs-labeled cells occurs had not been elucidated yet.
Figure 7 Presence and distribution of B16F10QDs-GSH-10NAC and B16F10Calcein cells in the lungs of C57BL/6 mice.
Notes: B16F10QDs-GSH-10NAC, B16F10Calcein, and control cells were injected into the tail vein of C57BL/6 mice. Fluorescence signals due to either rQDs-GSH or Calcein were determined in lungs at 6 and 24 hours post-injection. (A) Confocal images of histological sections from lungs collected at 6 hours post-injection of B16F10QDs-GSH-10NAC or B16F10Control cells. (B) Confocal images of histological sections from lungs collected at 6 hours post-injection of B16F10QDs-GSH-10NAC or B16F10Calcein cells. (C) Confocal images of histological sections from lungs collected at 24 hours post-injection of B16F10QDs-GSH-10NAC or B16F10Calcein cells. White arrows show fluorescence due to presence of B16F10QDs-GSH-10NAC or B16F10Calcein cells. Note that the data shown were obtained in a double-blind study.
Abbreviations: B16F10QDs-GSH-10NAC, B16F10 cells labeled with rQDs-GSH in presence of 10 mM of NAC; GSH, glutathione; NAC, N-acetylcysteine; QDs, quantum dots; rQDs-GSH, red QDs-GSH.
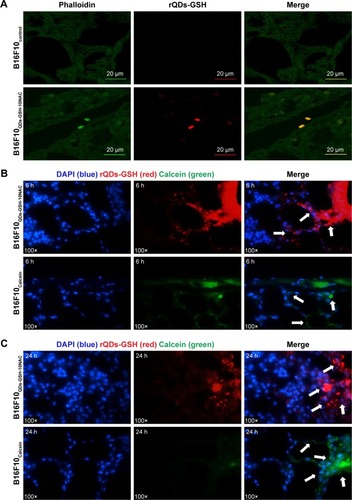
In this context, it is worth noting that transmigration can occur by at least three different processes or combinations of thereof: 1) mesenchymal cell invasion (protease dependent), 2) collective cell invasion (protease dependent), and 3) amoe-boid cell invasion (protease independent).Citation58 Melanoma cells can invade using all three mechanisms and/or may switch from protease-dependent to amoeboid cell invasion.Citation58,Citation59 Amoeboid invasion may explain why B16F10QDs-GSH-10NAC cells, that are non-invasive in a protease-dependent invasion assay (), display the same in vivo transmigration ability as B16F10Calcein control cells ().
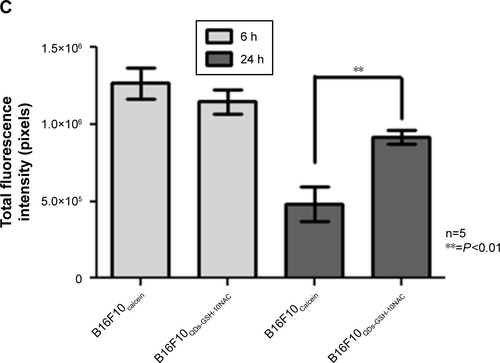
As shown in , B16F10QDs-GSH-10NAC cells (, Quadrant LR) and B16F10Calcein cells (, Quadrant UL) exhibit similar MFI. Therefore, a similar intensity would be expected when these cells are present in organs. A decrease in fluorescence intensity was observed between 6 and 24 hours for rQDs-GSH and Calcein-labeled cells (). This result could explain the decrease in fluorescence observed in lungs after 24 hours () and indicates that B16F10QDs-GSH-10NAC cells are still present in the lungs at this time but with decreased fluorescence intensity. Also, these results indicate that 6 hours post-injection represents the optimal time point for the tracking of organ-specific B16F10 cell accumulation and permits avoiding the possible loss of signal due to decreases in B16F10 cell fluorescence during the tracking process.
Of note, the fluorescence intensity due to rQDs-GSH was significantly higher than that associated with Calcein after 24 hours (), suggesting that the rQDs-GSH labeling is more stable over time than fluorescence labeling using Calcein.
Finally, these results demonstrate that our methodology of QDs-GSH-labeling cells allows obtaining nearly 100% viable labeled cells with increased fluorescence signal. In addition, these cells can migrate, transmigrate, and maintain their “homing,” similar to the unlabeled B16F10 cells. Thus, B16F10QDs-GSH-10NAC cells can be used to track the early distribution/accumulation of B16F10 cells in C57BL/6 organs by in vivo fluorescence imaging, without the need for fluorescence microscopy and, in doing so, monitor early steps involved in the colonization of distant organs.
Proof of concept
According to Sahai 2007, “the development of imaging studies can be important for preclinical evaluation of drugs that target steps in the metastatic process.”Citation4 Our results showed that B16F10QDs-GSH-10NAC cells can be used to track in vivo migration and the accumulation/distribution of metastatic cells in C57BL/6 mice independently of the invasion process. We believe that this model has the potential to be used as a tool to determine more specifically how expression of different proteins in these cells and/or the application of drugs affect migration, accumulation, and/or distribution of B16F10QDs-GSH-10NAC cells in C57BL/6 mice.
CAV-1 is an integral membrane protein, which has been shown to increase the migration, invasion, and metastasis of B16F10 cells.Citation25,Citation60 With this in mind, we performed a proof-of-concept experiment, using B16F10 cells stably transfected with either the empty pLacIOP vector [B16F10(Mock) cells] or the vector containing the CAV1-encoding insert [B16F10(CAV-1) cells] that were then labeled with rQDs-GSH as described in (B16F10QDs-GSH-10NAC). For the sake of simplicity, such labeled cells are referred to here as B16F10(Mock) and B16F10(CAV1) cells. Following labeling, we found that overall viability (), as well as the viability of labeled cells (), as determined by flow cytometry, were similar for B16F10(Mock) and B16F10(CAV1) cells. Moreover, the MFI was also similar () for both types of cells as determined by flow cytometry. These results indicate that overexpression of CAV-1 in B16F10 cells neither altered the labeling with rQDs-GSH nor the viability of labeled B16F10 cells. B16F10 cells do not express PTRF/Cavin-1,Citation28,Citation61 and also lack the presence of caveolae-like structures at the cell surface. Moreover, immunofluorescence studies have shown that the large majority of the CAV1 protein in B16F10(CAV1) cells is intracellular, predominantly in a perinuclear location,Citation28 consistent with the notion that the presence of CAV1 in B16F10(CAV1) cells does not modulate QDs-GSH internalization.
Figure 8 Proof-of-concept experiment to evaluate the effect of CAV1 expression in labeled B16F10 cells following injection into C57BL/6 mice.
Notes: B16F10(Mock) and B16F10(CAV-1) cells were labeled with rQDs-GSH and used in this proof-of-concept experiment. (A) Schematic summarizing the labeling assays of B16F10(Mock) or B16F10(CAV-1) cells used in proof of concept. (B) Total viability of B16F10(Mock) and B16F10(CAV-1) cells after labeling with rQDs-GSH. (C) Viability rQDs-GSH-labeled B16F10(Mock) and B16F10(CAV-1) cells. (D) MFI of viable rQDs-GSH-labeled B16F10(Mock) and B16F10(CAV-1) cells. (E) In vivo imaging of lungs collected from C57BL/6 mice 6 hours post-injection with viable rQDs-GSH-labeled B16F10(Mock) and B16F10(CAV-1) cells. Results were averaged from three independent experiments (n=3). Data were analyzed using the nonparametric Mann–Whitney test. Treated cells that did not show statistically significant differences are indicated. Note that the data shown were obtained in a double-blind study.
Abbreviations: CAV-1, Caveolin-1; GSH, glutathione; MFI, mean fluorescence intensity; QDs, quantum dots; rQDs-GSH, red QDs-GSH.
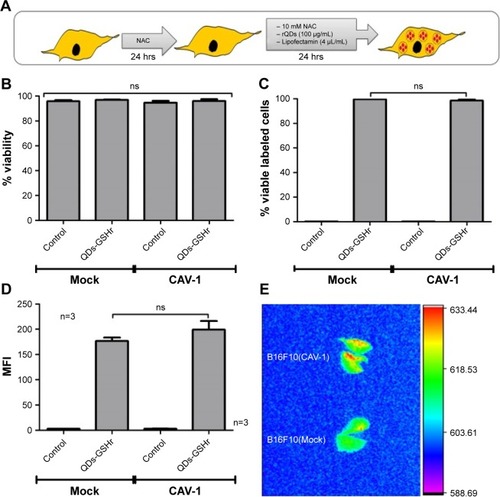
Subsequently, 2×10⁵ viable and rQDs-GSH-labeled B16F10(Mock) or B16F10(CAV-1) cells were injected into the tail vein of C57BL/6 mice, and 6 hours post-injection lungs from those recipient mice were collected for ex vivo fluorescence tracking using IVIS. As shown in , fluorescence intensity observed in lungs was greater for mice injected with B16F10(CAV-1) cells than those that received B16F10(Mock) cells. This result suggests that enhanced expression of CAV-1 in B16F10 melanoma cells promotes experimental lung metastasis described previously by our group by enhancing the accumulation of B16F10 cells in the lungs of recipient mice. In doing so, these experiments validate the potential of using rQDs-GSH-labeled cells to monitor early steps in metastasis.
Conclusion
In the present study, we describe for the first time the effects of biomimetic QDs-GSH incorporation on the viability and metastatic behavior of B16F10 cells. Also, we define a novel methodology that permits ameliorating detrimental consequences of QDs-GSH uptake. QDs-GSH’ incorporation augments ROS and cell migration in B16F10 cells; however, these effects can be corrected by NAC treatment. In addition, NAC treatment allows increasing significantly the viability and fluorescence intensity of rQDs-GSH-labeled cells. However, proliferation and invasiveness of B16F10 cells, as well as the formation of metastatic lung nodules, were all attenuated by QDs-GSH internalization, probably as a consequence of cadmium present in the QDs-GSH core. Moreover, we show that QDs-GSH-labeled B16F10 cells can be used to track the in vivo migration and early distribution/accumulation of these cells in C57BL/6 organs. Our study reveals that these cells preferentially accumulated in lungs of C57BL/6 mice as early as 5 minutes post-injection. Thus, although QDs-GSH internalization blocks the ability of B16F10 cells to form nodules in the lung, QDs-GSH-labeled B16F10 cells can be successfully tracked during the early steps involved in the colonization of distant organs.
Finally, our study provides a cell-labeling methodology that should be useful for characterizing the early steps of tissue-specific accumulation and distribution of B16F10 cells in C57BL/6 mice, as well as help to evaluate the effects of drugs and/or different biological factors (cytokines, signaling proteins, etc.) on these processes and, in doing so, improve our understanding of these events. With this in mind, we propose that QDs-GSH can be expected to have considerable potential for future use in cancer theranostics.
Author contributions
All authors contributed toward data analysis, drafting and critically revising the paper and agree to be accountable for all aspects of the work.
Acknowledgments
The authors appreciate the support of Cellular Communication Laboratory, Faculty of Medicine, Universidad de Chile; The BioNanotechnology and Microbiology Laboratory, Faculty of Biological Sciences, Universidad Andres Bello; The Department of Pharmacological and Toxicological Chemistry, Faculty of Chemical and Pharmaceutical Sciences, Universidad de Chile and Fundación Ciencia y Vida, Santiago, Chile. The authors also appreciate the personal support of the Díaz-García family (VMDG) and Erika Elcira Donoso Lopez (JMPD). The study was funded by CONICYT-FONDAP 15130011 (AQ), FONDECYT 1130250, 1170925 (AQ), Anillo ACT 1111 (AQ, JMPD), FONDECYT 1151255 (JMPD), INACH RT-25–16 (JMPD), AFOSR FA9550-15-1-0140 (JMPD), and Basal de FCV PFB-16 (LLG). A post-doctoral CONICYT award 3140463 (SG) and a CONICYT PhD fellowship 21120816 (VMDG) are also acknowledged.
Supplementary materials
Figure S1 TEM image of rQDs-GSH.
Notes: rQDs-GSH were observed by TEM microscopy and the core size was determined using ImageJ software. (A) TEM image of rQDs-GSH. (B) A threefold amplification of square shown in image A. (C) Quantification of electron-dense granule size (core of rQDs-GSH).
Abbreviations: GSH, glutathione; QDs, quantum dots; rQDs-GSH, red QDs-GSH; TEM, transmission electron microscopy.
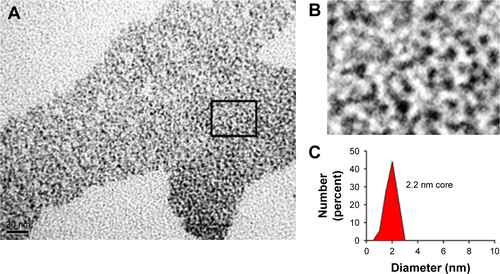
Figure S2 Intracellular reduced thiol levels in MKN45 and B16F10 cells.
Notes: Intracellular RSH levels in MKN45 and B16F10 cells were measured by Ellman’s assay. Results were averaged from three independent experiments (n=3). Data were analyzed using the nonparametric Mann–Whitney test. Statistically significant differences are indicated.
Abbreviation: RSH, reduced thiols.
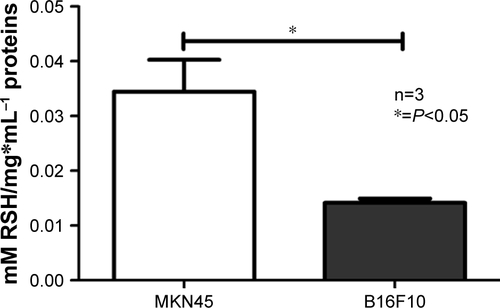
Figure S3 Effects of QDs-GSH incorporation on B16F10 cell proliferation and evaluation of QDs-GSH signal after 24 hours.
Notes: 1×10⁵ B16F10 cells (white bars) and B16F10 cells labeled with rQDs-GSH (gray bars) were cultured in RPMI supplemented with 10% FBS for 24 hours, and cell viability, percentage of viable labeled cells, MFI, and the total cell number (quantification of proliferation) were determined after cell labeling. (A) Cell viability at 0 or 24 hours post-labeling. (B) Percentage of viable B16F10 cells at 0 or 24 hours post-labeling. (C) MFI of viable B16F10 cells at 0 or 24 hours post-labeling. (D) Total number of B16F10 cells at 0 or 24 hours post-labeling. Results were averaged from three independent experiments (n=3). Data were analyzed using the nonparametric Mann–Whitney test. The n.s. significant differences compared with the controls and different treatments are indicated.
Abbreviations: GSH, glutathione; MFI, mean fluorescence intensity; n.s., non-statistically; QDs, quantum dots; rQDs-GSH, red QDs-GSH.
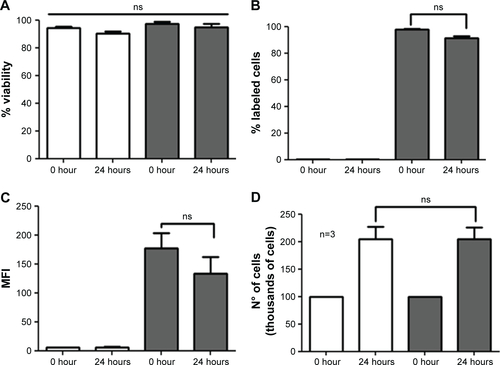
Figure S4 In vivo imaging of C57BL/6 mice treated with B16F10QDs-GSH-10NAC and B16F10 control cells.
Notes: B16F10QDs-GSH-10NAC (1 and 3) and B16F10 control cells (2) were injected into C57BL/6 mice. Fluorescence signals for rQDs-GSH were followed in mice for 6 hours. Imaging shows no differences in fluorescence signals between the mice.
Abbreviations: B16F10QDs-GSH-10NAC, B16F10 cells labeled with rQDs-GSH in presence of 10 mM of NAC; GSH, glutathione; MFI, mean fluorescence intensity; NAC, N-acetylcysteine; QDs, quantum dots; rQDs-GSH, red QDs-GSH.
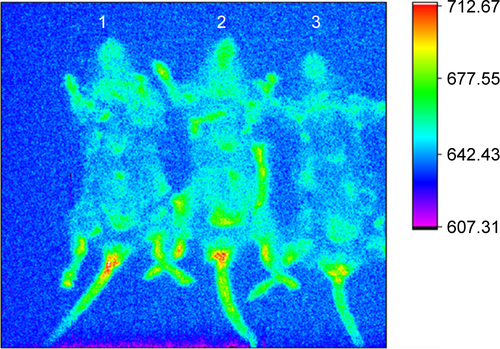
Figure S5 Controls of histological assays: fluorescence signals due to rQDs-GSH or Calcein were followed in lungs 6 hours post-injection of unlabeled B16F10 cells. Notes: (A) Light microcopy images of histological sections from lungs collected 6 hours post-injection of unlabeled B16F10 cells and stained with hematoxylin and eosin. Images show various tissue areas where B16F10 cells were identified. (B) Confocal images of histological sections from lungs collected 6 hours post-injection of unlabeled B16F10 cells. Phalloidin green, red, and DAPI were used as a contrast media. No signals related to rQDs-GSH or Calcein were observed.
Abbreviations: GSH, glutathione; QDs, quantum dots; rQDs-GSH, red QDs-GSH.
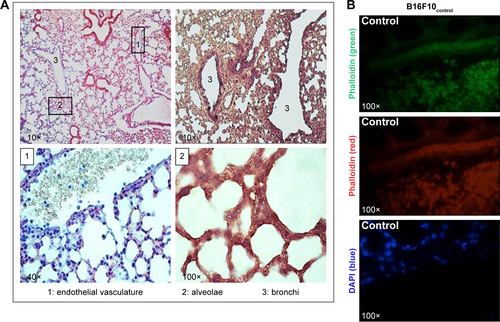
Figure S6 Fluorescence intensity of B16F10QDs-GSH-10NAC and B16F10Calcein cells at 6 and 24 hours post-injection: dot plot obtained by flow cytometry and the respective quantification of mean fluorescence intensity in each quadrant.
Notes: (A) B16F10QDs-GSH-10NAC cells. (B) B16F10Calcein cells. (C) Fluorescence due to the presence of B16F10QDs-GSH-10NAC and B16F10Calcein cells in histological slices was measured with ImageJ 1.47 v software (National Institutes of Health, USA). Results were averaged from five independent experiments (n=5). Data were analyzed using the nonparametric Mann–Whitney test. Statistically significant differences are indicated.
Abbreviations: B16F10QDs-GSH-10NAC, B16F10 cells labeled with rQDs-GSH in presence of 10 mM of NAC; GSH, glutathione; NAC, N-acetylcysteine; QDs, quantum dots; rQDs-GSH, red QDs-GSH.
Disclosure
The authors report no conflicts of interest in this work.
References
- FerlayJShinHRBrayFFormanDMathersCParkinDMEstimates of worldwide burden of cancer in 2008: GLOBOCAN 2008Int J Cancer2010127122893291721351269
- ChafferCLWeinbergRAA perspective on cancer cell metastasisScience201133160241559156421436443
- ValastyanSWeinbergRATumor metastasis: molecular insights and evolving paradigmsCell2011147227529222000009
- SahaiEIlluminating the metastatic processNat Rev Cancer200771073774917891189
- ChinenABGuanCMFerrerJRBarnabySNMerkelTJMirkinCANanoparticle Probes for the Detection of Cancer Biomarkers, Cells, and Tissues by FluorescenceChem Rev201511519105301057426313138
- FangMPengCWPangDWLiYQuantum dots for cancer research: current status, remaining issues, and future perspectivesCancer Biol Med20129315116323691472
- ChenCPengJSunSRPengCWLiYPangDWTapping the potential of quantum dots for personalized oncology: current status and future perspectivesNanomedicine20127341142822385199
- Pérez-DonosoJMMonrásJPBravoDBiomimetic, mild chemical synthesis of CdTe-GSH quantum dots with improved biocompatibilityPLoS One201271e3074122292028
- DíazVRamírez-MaureiraMMonrásJPSpectroscopic properties and biocompatibility studies of CdTe Quantum Dots capped with biological thiolsSci Adv Mater201245609616
- ZhengYGaoSYingJYSynthesis and Cell-Imaging Applications of Glutathione-Capped CdTe Quantum DotsAdv Mater2007193376380
- RosenblumLTKosakaNMitsunagaMChoykePLKobayashiHIn vivo molecular imaging using nanomaterials: general in vivo characteristics of nano-sized reagents and applications for cancer diagnosisMol Membr Biol201027727428520455640
- VouraEBJaiswalJKMattoussiHSimonSMTracking metastatic tumor cell extravasation with quantum dot nanocrystals and fluorescence emission-scanning microscopyNat Med200410999399815334072
- DerfusAMChanWCWBhatiaSNProbing the Cytotoxicity Of Semiconductor Quantum DotsNano Lett200441111828890669
- HardmanRA toxicologic review of quantum dots: toxicity depends on physicochemical and environmental factorsEnviron Health Perspect2006114216517216451849
- RzigalinskiBAStroblJSCadmium-containing nanoparticles: perspectives on pharmacology and toxicology of quantum dotsToxicol Appl Pharmacol2009238328028819379767
- OchiTOtsukaFTakahashiKOhsawaMGlutathione and metal-lothioneins as cellular defense against cadmium toxicity in cultured Chinese hamster cellsChem Biol Interact19886511143345570
- AndersonMEGlutathione: an overview of biosynthesis and modulationChem Biol Interact1998111–112114
- ValkoMMorrisHCroninMTMetals, toxicity and oxidative stressCurr Med Chem200512101161120815892631
- PengLHeMChenBQiaoYHuBMetallomics Study of CdSe/ZnS Quantum Dots in HepG2 CellsACS Nano2015910103241033426389814
- LooGRedox-sensitive mechanisms of phytochemical-mediated inhibition of cancer cell proliferation (review)J Nutr Biochem2003142647312667597
- XuGZengSZhangBSwihartMTYongKTPrasadPNNew Generation Cadmium-Free Quantum Dots for Biophotonics and Nano-medicineChem Rev201611619122341232727657177
- Pérez-DonosoJMMonrásJPOsorio-RomanIOVásquezCCUniversidad de Santiago de ChileSynthesis of Highly Fluorescent GSH-CdTe Nanoparticles (Quantum Dots)United States patentUS201302849792017815
- GautierJLMonrásJPOsorio-RománIOSurface characterization of GSH-CdTe quantum dotsMater Chem Phys20131401113118
- FidlerIJBiological behavior of malignant melanoma cells correlated to their survival in vivoCancer Res19753512182241109790
- Lobos-GonzálezLAguilarLDiazJE-cadherin determines Caveolin-1 tumor suppression or metastasis enhancing function in melanoma cellsPigment Cell Melanoma Res201326455557023470013
- EllmanGLTissue sulfhydryl groupsArch Biochem Biophys1959821707713650640
- RienerCKKadaGGruberHJQuick measurement of protein sulfhydryls with Ellman’s reagent and with 4,4′-dithiodipyridineAnal Bioanal Chem20023734–526627612110978
- OrtizRDíazJDíazNExtracellular matrix-specific Caveolin-1 phosphorylation on tyrosine 14 is linked to augmented melanoma metastasis but not tumorigenesisOncotarget2016726405714059327259249
- YildirimerLThanhNTLoizidouMSeifalianAMToxicology and clinical potential of nanoparticlesNano Today20116658560723293661
- LovrićJBazziHSCuieYFortinGRWinnikFMMaysingerDDifferences in subcellular distribution and toxicity of green and red emitting CdTe quantum dotsJ Mol Med200583537738515688234
- SchaeublinNMBraydich-StolleLKSchrandAMSurface charge of gold nanoparticles mediates mechanism of toxicityNanoscale20113241042021229159
- PantéNKannMNuclear pore complex is able to transport macromolecules with diameters of about 39 nmMol Biol Cell200213242543411854401
- Catalan-FigueroaJPalma-FlorezSAlvarezGFritzHFJaraMOMoralesJONanomedicine and nanotoxicology: the pros and cons for neurodegeneration and brain cancerNanomedicine (Lond)201611217118726653284
- WuWSThe signaling mechanism of ROS in tumor progressionCancer Metastasis Rev200625469570517160708
- VermaRPHanschCMatrix metalloproteinases MMPs: chemical-biological functions and (Q)SARsBioorg Med Chem20071562223226817275314
- KessenbrockKPlaksVWerbZMatrix metalloproteinases: regulators of the tumor microenvironmentCell20101411526720371345
- KhokhaRZimmerMJGrahamCHLalaPKWaterhousePSuppression of invasion by inducible expression of tissue inhibitor of metalloproteinase-1 (TIMP-1) in B16-F10 melanoma cellsJ Natl Cancer Inst19928413101710221318976
- FröhlichECellular elimination of nanoparticlesEnviron Toxicol Pharmacol201646909427442891
- JiangXRöckerCHafnerMBrandholtSDörlichRMNienhausGUEndo- and exocytosis of zwitterionic quantum dot nanoparticles by live HeLa cellsACS Nano20104116787679721028844
- MahmoudiMAzadmaneshKShokrgozarMAJourneayWSLaurentSEffect of nanoparticles on the cell life cycleChem Rev201111153407343221401073
- YangPMChiuSJLinKALinLYEffect of cadmium on cell cycle progression in Chinese hamster ovary cellsChem Biol Interact20041492–312513615501434
- BertinGAverbeckDCadmium: cellular effects, modifications of biomolecules, modulation of DNA repair and genotoxic consequences (a review)Biochimie200688111549155917070979
- KareemAZafarHSherwaniAMohammadOKhanTASynthesis, characterization and in vitro anticancer activity of 18-membered octaazamacrocyclic complexes of Co(II), Ni(II), Cd(II) and Sn(II)J Mol Struct201410751725
- SreekanthTVPanduranganMDillipGRKimDHLeeYRToxicity and efficacy of CdO nanostructures on the MDCK and Caki-2 cellsJ Photochem Photobiol B201616417418127689742
- SaitohYTeradaNOhnoNImaging of thrombosis and micro-circulation in mouse lungs of initial melanoma metastasis with in vivo cryotechniqueMicrovasc Res201491738324316421
- WexlerHAccurate identification of experimental pulmonary metastasesJ Natl Cancer Inst19663646416454160686
- ChoiHSLiuWMisraPRenal clearance of quantum dotsNat Biotechnol200725101165117017891134
- YeLYongKTLiuLA pilot study in non-human primates shows no adverse response to intravenous injection of quantum dotsNat Nanotechnol20127745345822609691
- SchipperMLChengZLeeSWMicroPET-based biodistribution of quantum dots in living miceJ Nucl Med20074891511151817704240
- SmithAMDuanHMohsAMNieSBioconjugated quantum dots for in vivo molecular and cellular imagingAdv Drug Deliv Rev200860111226124018495291
- SchipperMLIyerGKohALParticle size, surface coating, and PEGylation influence the biodistribution of quantum dots in living miceSmall20095112613419051182
- HaqueMMImH-YSeoJ-EHasanMWooKKwonO-SEffects of folic acid and polyethylene glycol coated quantum dots on toxicity and tissue uptake to precision-cut spleen slices of ratsJ Pharm Investig2013435375383
- MillerJFThe discovery of thymus function and of thymus-derived lymphocytesImmunol Rev2002185171412190917
- AndersenMHPedersenLOCapellerBBröckerEBBeckerJCthor StratenPSpontaneous cytotoxic T-cell responses against survivin-derived MHC class I-restricted T-cell epitopes in situ as well as ex vivo in cancer patientsCancer Res200161165964596811507035
- WhitesideTLHerbermanRBThe role of natural killer cells in immune surveillance of cancerCurr Opin Immunol1995757047108573315
- KendallMDFunctional anatomy of the thymic microenvironmentJ Anat199117711291769884
- NishinoMAshikuSKKocherONThurerRLBoisellePMHatabuHThe thymus: a comprehensive reviewRadiographics200626233534816549602
- van ZijlFKrupitzaGMikulitsWInitial steps of metastasis: cell invasion and endothelial transmigrationMutat Res20117281–2233421605699
- HegerfeldtYTuschMBröckerEBFriedlPCollective cell movement in primary melanoma explants: plasticity of cell-cell interaction, beta1-integrin function, and migration strategiesCancer Res20026272125213011929834
- Diaz-ValdiviaNBravoDHuertaHEnhanced caveolin-1 expression increases migration, anchorage-independent growth and invasion of endometrial adenocarcinoma cellsBMC Cancer201515146326054531
- HillMMDaudNHAungCSCo-regulation of cell polarization and migration by caveolar proteins PTRF/Cavin-1 and caveolin-1PLoS One201278e4304122912783