Abstract
Background
Single-walled carbon nanotubes (SWCNT) hold promise for applications as contrast agents and target delivery carriers in the field of nanomedicine. When administered in vivo, their biodistribution and pharmacological profile needs to be fully characterized. The tissue distribution of carbon nanotubes and their potential impact on metabolism depend on their shape, coating, and metallic impurities. Because standard radiolabeled or fluorescently-labeled pharmaceuticals are not well suited for long-term in vivo follow-up of carbon nanotubes, alternative methods are required.
Methods
In this study, noninvasive in vivo magnetic resonance imaging (MRI) investigations combined with high-resolution magic angle spinning (HR-MAS), Raman spectroscopy, iron assays, and histological analysis ex vivo were proposed and applied to assess the biodistribution and biological impact of intravenously injected pristine (raw and purified) and functionalized SWCNT in a 2-week longitudinal study. Iron impurities allowed raw detection of SWCNT in vivo by susceptibility-weighted MRI.
Results
A transitional accumulation in the spleen and liver was observed by MRI. Raman spectroscopy, iron assays, and histological findings confirmed the MRI readouts. Moreover, no acute toxicological effect on the liver metabolic profile was observed using the HR-MAS technique, as confirmed by quantitative real-time polymerase chain reaction analysis.
Conclusion
This study illustrates the potential of noninvasive MRI protocols for longitudinal assessment of the biodistribution of SWCNT with associated intrinsic metal impurities. The same approach can be used for any other magnetically-labeled nanoparticles.
Introduction
Single-walled carbon nanotubes (SWCNT), with their unique nanometer-scale structure based on a single layer of carbon atoms arranged in a series of condensed benzene rings rolled up into a tubular structure, and their fascinating mechanical, electric, and thermal properties, are being used more and more extensively for a variety of applications in nanotechnology.Citation1 With their distinct architecture which allows them to penetrate selectively across biological barriers and their novel physicochemical properties, in particular, their high aspect ratio and propensity for functional modification, SWCNT hold promise for applications in the field of nanomedicine as contrast agents and target delivery carriers to improve the distribution and performance of drug molecules.Citation2,Citation3 For example, SWCNT have been shown to shuttle various biomolecules into cells effectively, including drugs, peptides, proteins, plasmid DNA, and small interfering RNA.Citation4
The biodistribution and pharmacological profile of carbon nanotubes in vivo have yet to be fully characterized for safe biomedical application. Chemical modifications or functionalization of their surfaces render carbon nanotubes more hydrophilic, which can improve their biocompatibility profile and reduce aggregation of individual tubes through van der Waals forces.Citation5,Citation6 In addition, in vitro studies of well-dispersed SWCNT have reported less cytotoxicity when compared with the same SWCNT present in an agglomerated form.Citation7,Citation8 Finally, the tissue distribution of carbon nanotubes and their potential impact on metabolism depends on their shape, coating, and metallic impurities.Citation9
Rather than relying on radiolabels or spectroscopic tags for indirect detection of carbon nanotubes, which may gradually dissociate from the materials they are attached to, decay, and lose activity over time, direct detection of carbon nanotubes can be performed based on their intrinsic physical properties, ie, intrinsic Raman scattering intensityCitation10 and intrinsic near infrared photoluminescence,Citation11,Citation12 which allow for their specific and direct detection. However, these techniques are more adapted to ex vivo or in vivo surface investigations due to poor penetration of these detection methods inside the body.
In a previous study, we proposed an in vivo follow-up method to detect SWCNT noninvasively, based on their metal impurity at the surface or inside raw SWCNT (depending on the manufacturer and synthesis methods) using susceptibility-weighted magnetic resonance imaging (MRI).Citation13 MRI has potential advantages over other noninvasive modalities with respect to high soft-tissue resolution deep inside the body and discrimination in any imaging plane, and the lack of repeated exposure to ionizing radiation during longitudinal studies.
Among techniques to evaluate biological impact, nuclear magnetic resonance (NMR) spectroscopy is unique in its ability to obtain pertinent metabolic information about the target organs and biomarker metabolites.Citation14 However, in vivo NMR spectroscopy is often limited by its poor spectral resolution and sensitivity, resulting in ambiguity in metabolite assignment and quantification. High-resolution magic angle spinning (HR-MAS) enables setting up of richer metabolite profiles for ex vivo tissues (biopsies) by providing much higher spectral resolution and sensitivity.
MAS NMR spectroscopy is a nondestructive technique requiring small amounts and minimal sample preparation. This technique has been successfully applied to the analysis of biological samples, including the brain, liver, kidney, intestine, cardiac tissue, and prostate. Pattern recognition methods (ie, multivariate statistical methods) enable convenient visualization of spectral changes in NMR data, and are useful for the detection of specific biomarkers of toxicity and for diagnosis of disease.Citation15–Citation17
Quantitative real-time polymerase chain reaction (RT-PCR) was performed to confirm results obtained by MAS NMR spectroscopy. We used this powerful tool to identify and characterize changes in gene expression associated with toxicity.
In a previous study, after intrapulmonary instillation in a rat model, raw SWCNT were found to produce granulomatous and inflammatory reactions in a time- and dose-dependent manner assessed by multiscale imaging techniques combining noninvasive hyperpolarized 3He and proton lung MRI with ex vivo light (histopathological analysis) and transmission electron microscopy.Citation18
In this two-week follow-up study, we investigated the biodistribution of various SWCNT in blood and target tissues after their intravenous administration by longitudinal in vivo systemic MRI and their potential effect on liver metabolism by HR-MAS spectroscopy and quantitative RT-PCR analysis after liver biopsy. Ex vivo Raman spectroscopy, iron assay, and histological analysis were performed to correlate with the MRI readouts.
Materials and methods
Nanoparticle suspension
Three different types of SWCNT were used in this study. Raw and purified pristine SWCNT were purchased from Carbon Nanotechnologies Inc (Buckytubes, Houston, TX). They have an individual diameter of 0.8 to 1.2 nm and an individual length of 0.1 to 1 μm, according to the manufacturer. Pristine SWCNT were well-dispersed in NaCl in the presence of bovine serum albumin after at least 20 minutes sonication in an ultrasonic bath.Citation19 Functionalized SWCNT were purchased from Sigma-Aldrich (Lyon, France). They have an individual diameter of 1 to 2 nm and an individual length of 0.5 to 2 μm. The functionalization was achieved by suspending 60 mg of SWCNT in 20 mL of concentrated HNO3 (15 M) and 60 mL of concentrated H2SO4 (18 M). The mixture was stirred at 70°C for 2 hours. It was then filtered, washed with distilled water until the pH of the aqueous phase was neutral, and dried at 120°C for 12 hours. The oxidized materials were redispersed in water at a concentration of 3 mg/mL. This protocol was adapted from Liu et al.Citation20
An ultrasmall supermagnetic iron oxide (USPIO) contrast agent, Sinerem® (Ferumoxtran-10) kindly provided by Guerbet (Paris, France), was also included in this study as a positive control for contrast MRI. It has a mean particle diameter of 30 nm and consists of an iron oxide core coated with low molecular weight dextran.Citation21
Physicochemical characteristics
SWCNT have been previously characterized using transmission electron microscopy.Citation13 Prior to administration in vivo, their physicochemical properties were carefully characterized by Raman spectroscopy, superconducting quantum interference device (SQUID) magnetization measurement, and inductively coupled plasma-optical emission spectrometry (ICP-OES) for iron impurity.
Raman spectroscopy
Raman spectroscopy is a technique used to study vibrational, rotational, and other low-frequency modes in a system. It tells us about the quality of the nanotubes and their microscopic structure. Volumes as low as 10 μL of each sample were used to obtain the Raman signatures (RBM and G-band) of SWCNT using a labRAM ARAMIS microspectrometer Raman instrument (HORIBA Jobin Yvon Inc, Edison, NJ). The Raman spectrum was recorded using a laser spot of 2 μm2 (6 mW power on the sample, laser excitation wavelength 632.5 nm), 50× objective, and a 10-second collection time.
SQUID measurements
SQUID is a very sensitive magnetometer used to measure extremely weak magnetic fields. The magnetic properties of the samples were characterized with a Quantum Design MPMS-XL magnetometer based on a SQUID. For the zero-field-cooled measurements, the sample is first cooled from 300 to 5 K in a zero magnetic field. After applying a 50 Oe magnetic field, the magnetization is measured in a warming cycle. For the field-cooled measurements, SWCNT samples were cooled in the magnetic field from room temperature to 5 K, and then the magnetization was measured in the warming cycle while keeping the field on. Samples were encapsulated in diamagnetic cellulose for measurements and run in duplicate.
Iron dosage
Iron metal impurities were measured in the different SWCNT solutions prior to their in vivo administration, and 1 mL of each solution was analyzed. Samples were centrifuged (30 minutes, 10,000 rpm) and then mineralized at 200°C for 45 minutes with 7 mL of nitric acid in a microwave oven (MarsXpress, Matthews, NC). Digested samples were diluted to 250 mL with ultrapure water (18 MΩ) and analyzed by ICP-OES using a JY138 Ultrace instrument (HORIBA Jobin Yvon Inc) transformed into an axial view prototype, operating at 1075 W and equipped with a Meinhard-type nebulizer and a Scott spray chamber. Detection was performed at 259.94 nm.
Experimental protocol
Six- to eight-week-old male Sprague-Dawley rats (n = 40) were obtained from Charles River (L’Arbresle, France). The animals were housed in the Lyon-1 University animal care unit, a facility accredited by the local veterinary authority. They had free access to a conventional laboratory diet and water, and were handled in accordance with official French guidelines for the care and use of laboratory animals. The animals were anesthetized by intramuscular administration of 0.12 mL/100 g of a mixture of 3.5 mL of ketamine (1000 mg/mL), 3 mL of xylazine (2%), and 1 mL of atropine (1 mg/mL).
They were divided in five groups of eight rats each, ie, two control groups injected with either saline (negative control) or USPIO (positive control), and three groups injected with raw, purified, or functionalized SWCNT. Nanoparticle solutions (the different SWCNT and USPIO) were intravenously injected as a single bolus via the vein tail (0.5 mg/animal in a 150 μL volume) and the MRI protocol was performed 1 hour before injection and at 5 hours, 24 hours (day 1), 48 hours (day 2), 7 days (day 7), and 14 days (day 14) after injection of nanoparticles.
MRI protocol
MRI was performed on a 10 cm bore actively-shielded 4.7 T Bruker magnet (Bruker Biospin GmbH, Rheinstetten, Germany) interfaced to ParaVision software for preclinical MRI research. A Bruker transmission and reception proton volume radiofrequency coil was used for good radiofrequency homogeneity over the volume of interest. A gradient echo sequence with TR/TE = 200/3.6 msec, bandwidth = 50 kHz, flip angle = 30°, FOV = 6 cm, two averages, and a pixel resolution of 234 ×234 μm was used. Axial slices (thickness 2 mm) were positioned so as to image the organs of interest (liver, spleen, and kidneys). A water tube used as a reference was positioned on the rat to enable contrast-to-noise ratio (CNR) measurement and proton NMR signal normalization.
The contrast-to-noise ratio was defined as (SNRROI − SNRref)/SNRref with SNR = (MeanSignal/SDNoise) where ref denotes the water tube reference and SD is the standard deviation of the noise in the image. Within the liver, the regions of interest were drawn around apparent vascular structures and these regions were subtracted out of the map to retain liver parenchyma only. Regions of interest encompassing the whole spleen and the two kidneys were manually selected for signal measurement. All data were expressed as means ± SD. Nonparametric statistical tests (SPSS; SPSS Inc., Chicago, IL) were done, ie, Kruskal–Wallis for unpaired groups and a Friedman test for comparison between different time points. A P value < 0.05 was considered significant for all tests.
Blood Raman measurements
Blood in aliquots of 0.5 mL were sampled from each rat group sacrificed at 24 hours. These were then dissolved in an equal volume of lysis buffer (1% sodium dodecyl sulfate, 1% Triton X-100, 40 mM Tris acetate, 10 mM ethylenediamine tetra-acetic acid, and 10 mM DTT) for detection of SWCNT in the blood samples by Raman spectroscopy.
Surface-enhanced Raman spectroscopy was also used to enhance SWCNT Raman scattering.Citation22,Citation23 Volumes as low as 10 μL of homogenized blood were put on a gold-coated silicon surface (Mesophotonics United, Southampton, UK) to enhance the Raman signal, and the spectra were acquired using the same parameters as described above.
Histopathology
For each rat in each group, a portion of the lung, liver, spleen, and one kidney were removed for histological analysis. The organs were fixed in formaldehyde, dehydrated, and embedded in paraffin. Transverse sections 5 μm in thickness were cut (Leica 2045 microtome) and stained with hematoxylin and eosin. This is a routine staining method which provides excellent contrast between elastic fibers, cytoplasm, and connective tissues, and allows assessment of the integrity of the tissue, and additionally localizing SWCNT aggregates without any specific coloration.
Iron dosage in rat organs
Portions of lung, liver, spleen, and one kidney from the raw SWCNT and Sinerem groups of rats were also removed for iron assay using ICP-OES for comparison with noninvasive MRI measurements. Samples were dried at 80°C, weighed, and then mineralized in 5 mL nitric acid and 2 mL hydrogen peroxide in a microwave oven (same conditions). Iron detection was carried out after dilution of the samples as described above.
HR-MAS NMR spectroscopy
The liver tissue samples were analyzed by 1H MAS NMR spectroscopy using a 9.4 T (proton frequency 400.13 mHz) Bruker DRX Avance spectrometer (Bruker Biospin, Rheinstetten, Germany) equipped with a 4 mm 1H-13C-31P HR-MAS probe head. Approximately 15 mg of frozen liver tissue (duplicate) sampled using a 3 mm biopsy punch was introduced in a 4 mm zirconium oxide rotor and adjusted to 50 μL with 1 mM trimethylsilylpropionate in D2O solution. The rotor was then sealed and transferred into the precooled probe. Samples were spun at 4 kHz, and temperature was maintained at 4°C to prevent tissue degradation. One-dimensional spectra were all acquired using a Carr-Purcell-Meiboom-Gill pulse sequence to attenuate macromolecule and lipid resonances, synchronized with the spinning rate (interpulse delay 250 μsec, total spin echo time 30 msec). Residual water signal was presaturated during the two second relaxation delay time. Total acquisition of one spectrum with 256 scans lasted 16 minutes. Resonance assignment was performed as previously described by Waters et al.Citation24
HR-MAS data statistical analysis
Data preprocessing
A 0.5 Hz line broadening was applied to all data before Fourier transform. Data were phased and aligned on the trimethylsilylpropionate chemical shift (fixed to 0 ppm). All spectral regions between 4.65 and 0.5 ppm were then segmented in 0.02 ppm rectangular buckets using Bruker software AMIX version 35.1 (Bruker, Wissembourg, France). Buckets were normalized to total intensity. The bucket tables (the X matrix) were then loaded in the SIMCA-P software version 10 (Umetrics, Umea, Sweden) and scaled to unit variance before partial least squares-discriminant analysis.
Principal component and partial least squares-discriminant analyses
Unsupervised multivariate principal component analysis was carried out as a first step to determine if NMR variables could discriminate between the SWCNT-injected animals and controls. Partial least squares-discriminant analysis was then run by adding a supplementary data matrix Y, containing our experimental groups for better discrimination of populations. All partial least squares-discriminant models were crossvali-dated to enable evaluation of the statistical significance of the model. Crossvalidation lead to calculation of the Q2Y and R2Y factors. Typically, a robust model has an R2 > 0.5 and a Q2 > 0.4. All results are visualized in this paper by scores plots.
RNA isolation, cDNA synthesis, and quantitative RT-PCR analysis
Total RNAs from the liver were prepared using a total RNA isolation kit (Macherey-Nagel, Düren, Germany), including the DNase treatment step to avoid contamination with genomic DNA. Complementary DNA was synthesized using SuperScript II Reverse Transcriptase (Invitrogen, Cergy Pontoise, France), from 1 μg of total RNA in a final volume of 100 μL. Quantitative RT-PCR for seven genes was performed with the ABI PRISM 7900 sequence detection system and SYBR Green dye (Applied Biosystems, Forster City, CA) according to the manufacturer’s protocol. Primers were designed using Primer Express program (see ). mRNA levels were normalized against reference gene RPLP0 mRNA (the large P0 subunit of the acidic ribosomal phosphoprotein). Amplification of specific transcripts was confirmed by melting curve profiles generated at the end of the PCR program.
Table 1 List of primer sequences for gene expression analyses by quantitative real-time polymerase chain reaction
The fluorescence cycle threshold (Ct) was calculated to quantify the relative amount of gene expression. The mRNA levels of genes of interest (R) were expressed relative to levels of RPLP0, (ΔCt = CtR − CtRPLP0) and the relative amount of R mRNA levels between treated and control rats is given by 2−ΔΔCt, where ΔΔCt = [ΔCt(R) of treated rats group] − [mean of ΔCt(R) of control rat group]. The Student’s t-test for paired data was used for statistical analysis of the results obtained.
Results and discussion
Physicochemical characteristics of SWCNT
Following ICP-OES characterization of the prepared SWCNT solutions, it was found that the raw sample contained 11% (w/w) iron, while the purified and functionalized samples contained 2% and 0.7%, respectively.
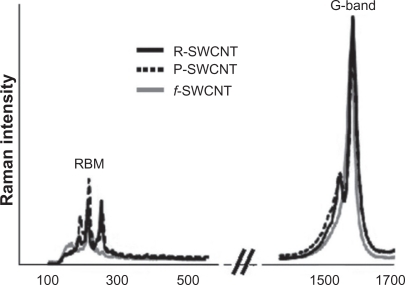
In vitro Raman spectra of the SWCNT suspensions revealed very similar profiles, with the presence of characteristic SWCNT peaks (). Radial breathing mode features (appearing between 190 cm−1 and 254 cm−1) which correspond to the atomic vibration of the C atoms in the radial direction, are very useful for characterizing nanotube diameters.Citation25 The tangential graphene-like G-band (appearing at 1582 cm−1 for raw and purified SWCNT and at 1578 cm−1 for functionalized SWCNT) which gives information about the metallic character of the SWCNT in resonance,Citation26 was used to detect nanotubes in solution and blood because it is relatively insensitive to the diameter and bundling of nanotubes and present a high Raman scattering intensity.Citation10
Figure 1 Normalized Raman spectra of raw, purified, and functionalized SWCNT solutions showing the presence of SWCNT characteristic RBM and G-band features.
Abbreviations: R, raw; P, purified; f, functionalized; SWCNT, single-walled carbon nanotubes; RBM, radial breathing mode.
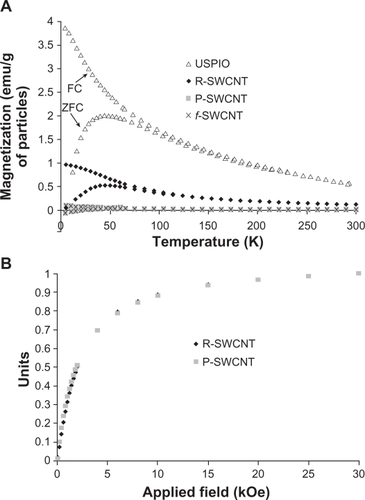
To investigate the magnetic properties of the different SWCNT samples, zero-field-cooled and field-cooled magnetization measurements were performed using a SQUID magnetometer. shows the temperature dependence of zero-field-cooled and field-cooled measurements under the applied magnetic field for pristine raw and purified SWCNT, functionalized SWCNT, and USPIO nanoparticles. The measurements indicate clearly that the magnetization of USPIO nanoparticles is much larger than that of raw SWCNT. Field dependence magnetization measurements were also performed to compare raw and purified SWCNT. When normalizing to the iron percentage found with ICP measurements, comparable curves were observed for raw and purified SWCNT () which indicates that the purification process does not alter the particle size.
Figure 2 Superconducting quantum interference device magnetization measurements. A) Temperature dependence of zero-field-cooled and field-cooled measurements, recorded at a magnetic field of 50 Oe for raw, purified, and functionalized SWCNT compared with USPIO nanoparticles. B) Normalized field dependence magnetization of raw and purified SWCNT recorded at room temperature (300 K).
Abbreviations: R, raw; P, purified; f, functionalized; SWCNT, single-walled carbon nanotubes; USPIO, ultrasmall supermagnetic iron oxide.
Due to their strong magnetic moment, iron particles induce magnetic field inhomogeneities in their vicinity and attenuate the NMR signal of water molecules in surrounding tissues. With these contrast properties, raw SWCNT or iron-labeled SWCNT can be compared with iron-based MRI contrast agents used in noninvasive cellular and molecular MRI characterization for the whole body.Citation13
MRI protocol
To evaluate the presence of SWCNT in systemic organs, a gradient echo imaging sequence sensitive to changes in susceptibility effect was used. CNR measured in the regions of interest, ie, the liver, spleen, and kidneys, was chosen as an index of SWCNT deposition.
In the USPIO-injected group, a 2–3-fold decrease of CNR in the spleen and liver was observed up to 7 days after injection and in the kidneys at the 5-hour imaging time point. This effect decreased gradually over the 2-week investigation period, but CNR values were still significantly lower than those of the control groups in the spleen and liver (). Similarly, in the group injected with raw SWCNT, a 1–2-fold decrease in CNR was detected in the spleen up to 7 days, in the liver up to 2 days, and in the kidneys up to 5 hours after injection. This effect decreased with time, and CNR values became comparable with those in the control groups.
Figure 3 Contrast-to-noise ratio variation of USPIO, raw, purified, and functionalized SWCNT injected groups compared with control values at 5 hours, and days 1, 2, 7, and 14 investigation time points in the A) spleen, B) liver, and C) kidney.
Note: Asterisks indicate statistically different values from the control group (P < 0.05).
Abbreviations: R, raw; P, purified; f, functionalized; SWCNT, single-walled carbon nanotubes; USPIO, ultrasmall supermagnetic iron oxide.
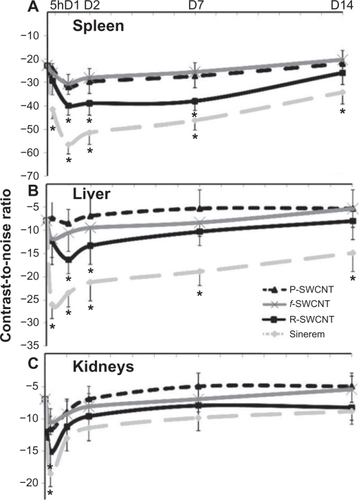
No statistically significant changes in CNR values were measured in the purified and functionalized SWCNT-injected groups during the 2-week investigation () because SWCNT detection using MRI relies mainly on their intrinsic iron impurities. The small variation in CNR may be due to the presence of some paramagnetic sites on the tube wall due to SWCNT purification and functionalization (ie, acid treatment). Although weaker than iron particles in relaxing proton spins, these paramagnetic sites may contribute to MRI contrast. These findings indicate that iron impurities can be used for efficient detection of raw SWCNT or iron containing SWCNT in systemic organs using standard proton MRI techniques.
Controlling the iron impurity dose or specifically labeling SWCNT with iron nanoparticles at different iron percentages (internal versus external labeling) offer the possibility to track the different SWCNTs accurately in vivo and, therefore, future monitoring of novel therapeutic SWCNT in different inflammatory or cancerous organs will be feasible.
Ex vivo analysis
After completion of the imaging studies, the same number of animals was sacrificed (n = 4 per group) at day 1 and day 14 by exsanguination under isoflurane anesthesia. Spleen, liver, kidneys, and blood were removed for a series of ex vivo post-mortem blood Raman measurements, iron assay of rat organs, and histopathological analyses.
Raman spectroscopy measurements performed on homogenized blood samples to detect the presence of nanotubes 24 hours after SWCNT injection did not reveal the presence of the characteristic G-band, with a similar profile as compared with controls (data not shown). To increase the detection sensitivity of the presence of SWCNT in the blood, a surface-enhanced Raman scattering technique was also used. Surface-enhanced Raman spectroscopy is a plasmonic effect whereby molecules adsorbed onto nanoroughened noble metal surfaces show a dramatic increase in the incident electromagnetic field, resulting in high Raman intensities.Citation23 shows the spectra of the different blood samples and confirms the absence of SWCNT in the blood samples.
Figure 4 Surface-enhanced Raman spectra of control, raw, purified, and functionalized SWCNT blood samples at 24 hours after injection.
Abbreviations: R, raw; P, purified; f, functionalized; SWCNT, single-walled carbon nanotubes.
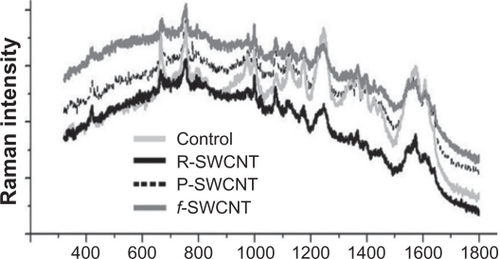
The absence of SWCNT in the blood 24 hours after injection is in accordance with reported studies showing that the blood circulation of SWCNT is limited to a few hours (16 hours maximum), and can vary with the type of nanotubes used and their functionalization.Citation10,Citation27
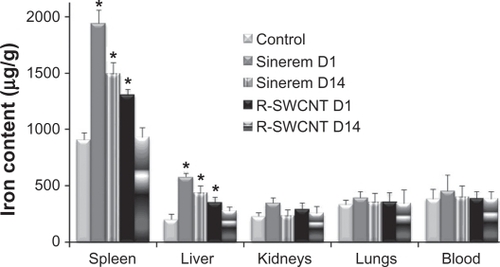
To obtain an estimation of the amount of injected nanoparticles recovered in different organs at the day 1 and day 14 time points and to correlate these with MRI readouts, ex vivo quantification of iron by the ICP-OES technique was used. Due to significant basal endogen iron concentration in organs as compared with the injected dose of iron, an iron assay was only performed for the spleen, liver, kidneys, lungs, and blood for the control, USPIO, and raw SWCNT groups.
A statistically significant increase in iron was measured in the spleen and liver for both the day 1 and day 14 USPIO groups and for the raw SWCNT day 1 group (), which is in accordance with the obtained CNR attenuation in the MRI images ().
Figure 5 Iron content in μg/g of spleen, liver, kidneys, lungs, and blood for control, USPIO (day 1 and day 14) and raw SWCNT (day 1 and day 14) groups.
Note: Asterisks indicate statistically different values from the control group (P < 0.05).
Abbreviations: R, raw; SWCNT, single-walled carbon nanotubes; D1, day 1; D14, day 14.
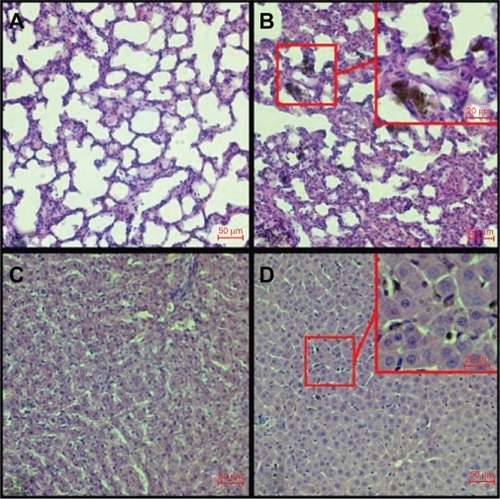
Histopathological analyses were performed at day 1 and day 14 after injection to compare with the MRI readouts and to assess the integrity of the tissue and localize the presence of SWCNT aggregates after injection. Due to van der Waals forces, SWCNT bundle into ropes, which are further associated into loose aggregates, and may be accessible for detection using light microscopy.
No histopathological changes or any signs of acute toxicological effects were observed in the different organs after the injection of both functionalized and well dispersed pristine SWCNT. At day 1 after injection, liver, spleen, and lung slices showed the presence of small SWCNT and USPIO aggregates (). No presence of SWCNT was detected 2 weeks after injection. However, the USPIO nanoparticles were still detectable in liver and spleen slices at that time point.
Figure 6 Hematoxylin and eosin-stained histopathological cuts of lung lobe (A control, B injected) and liver (C control, D injected) showing the presence of black SWCNT aggregates after functionalized SWCNT injection at day 1 investigation time point.
Abbreviation: SWCNT, single-walled carbon nanotubes.
To monitor the general health of the animals, body weight was assessed throughout the experimental schedule. Upon SWCNT injection, and throughout the entire study, no unusual behavior or differences between groups were observed. Starting with a weight of 244 ± 8 g (n = 32), the treated animals had a normal weight gain, weighing 336 ± 7 g at the completion of the 2-week follow-up study, identical to controls (n = 8).
HR-MAS NMR analysis
HR-MAS 1H NMR is a well established technique for studying the endogenous metabolic changes caused by drug toxicity and disease processes.Citation28–Citation30 It was performed in this study to assess the biological impact of SWCNT injection on liver metabolism as a general index of toxicity. HR-MAS 1H NMR spectroscopy of intact tissue enables the simultaneous measurement of both lipids and low molecular weight metabolites, which is important in a toxicological diagnosis. This approach is capable of detecting a wide range of metabolites in intact tissue, circumventing the need for extraction procedures that may introduce artifacts in the quantification of some metabolites and allowing the investigation of metabolic compartmentalization within tissues.
A representative spectrum of intact control liver with the assigned peaks is shown in (bottom). The main peaks arise from glucose, glycogen, trimethylamine-N-oxide, and lipid moieties. Spinning tissue samples at high speed at the magic angle markedly improves spectral resolution and information content.
Figure 7 A) One-dimensional 400 mHz high resolution magic angle spinning 1H nuclear magnetic resonance spectra of liver samples acquired using Carr-Purcell-Meiboom-Gill pulse sequence. The numbers refer to the assignments of different peaks arising from the main metabolites (1 lactate, 2 alanine, 3 acetate, 4 glutamate/glutamine, 5 glutathione, 6 phosphocholine/glycerophosphocholine, 7 trimethylamine oxide, 8 glucose/glycogen, 9 β-glucose, 10 α-glucose). B) Principal component analysis score plot showing no clustering of liver samples from the different groups following high resolution magic angle spinning 1H magnetic resonance spectroscopy. C) Partial least squares-discriminant analysis score plot showing clustering between D1 and D14.
Abbreviations: R, raw; P, purified; f, functionalized; SWCNT, single-walled carbon nanotubes; D1, day 1; D14, day 14.
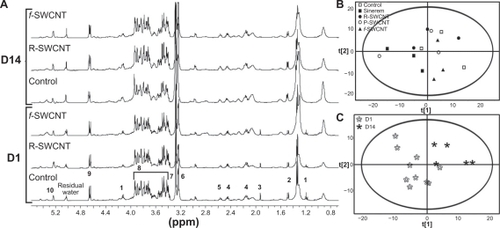
No variation was observed among the analyzed liver samples extracted from the different experimental group. Principal component analysis, the most commonly used statistical method for the discrimination of variations in NMR spectra, did not reveal any differences between the analyzed liver samples, with no clustering in the principal component analysis plot (, R2 = 0.84, Q2 = 0.6).
Partial least squares-discriminant analysis, a technique that generalizes and combines features from principal component analysis and multiple regression, was run to discriminate between populations of rats by adding a supplementary data matrix containing our experimental groups, ie, at day 1 and day 14. Because the groups were relatively small (based upon the kind of nanotubes injected), the sole effect of age could be tested. Therefore, no significant variation in liver metabolites was observed after SWCNT injection, but the classification did allow the clustering of spectra according to age (, R2 = 0.52, Q2 = 0.47). Age metabolic profile evolution is not based on a single metabolic variation, but rather on a global evolution of the spectrum due to age-related organ maturation.Citation31
Quantitative RT-PCR
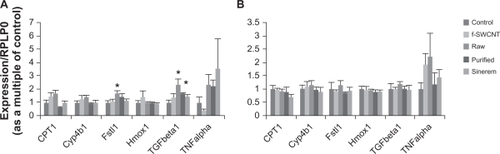
To confirm HR-MAS NMR readouts and validate its sensitivity in detecting endogenous metabolic changes after nanoparticle injection, quantitative RT-PCR was performed on liver samples for different genes. The relative expression of six genes selected for their identified function in steatosis/cirrhosis, fatty acid metabolism, oxidative stress, or transport in the rat liver (Fstl1, Cpt1, Hmox1, and Cyp4b1, respectively)Citation32 was determined, as well as transforming growth factor-β and tumor necrosis factor-α, which serve as chemical mediators in the inflammatory response.
No statistical variation was observed between the treated and control rats, nor between different groups of treated rats with regard to Cpt1, Cyp4b1, Hmox1, and tumor necrosis factor-α expression 24 hours () or 14 days () after injection. Fstl1 and transforming growth factor-β mRNA levels were slightly increased (in the raw pristine SWCNT-treated rats and in raw and purified pristine SWCNT-treated rats, respectively) at 24 hours after injection compared with control rats (), but these two genes recovered expression levels similar to those of control rats 14 days after injection ().
Figure 8 Inflammation and steatosis/fibrosis-specific genes expression in rat liver tissue. Liver tissue from three control rats and three of each of the treated rats with functionalized SWCNT or raw or purified pristine SWCNT or the contrast agent Sinerem®, after 24 hours A) or 14 days after injection B), were used to prepare total RNA according to the experimental procedure. Levels of Cpt1, Cyp4b1, Fstl1, Hmox1, tumor necrosis factor alpha, and transforming growth factor beta, were measured by real-time polymerase chain reaction, normalized to RPLP0 mRNA using the “2−ΔΔCt” formula and expressed in arbitrary units (mean ± standard error of the mean), with control values taken as 1.
Note: *P < 0.05 in treated rats versus control rats using the Student’s t-test.
Abbreviations: f, functionalized; SWCNT, single-walled carbon nanotubes.
These results were found to be totally in accordance with the HR-MAS results, whereby no variation was observed among the analyzed liver samples extracted from the different experimental groups. Injection of SWCNT did not seem to trigger hepatotoxicity, while it has been shown that administration of carbon tetrachloride affected lipid homeostasis in the liver,Citation33 and was responsible for hepatic fibrosis through chemical mediators, such as transforming growth factor-β or tumor necrosis factor-α.Citation33,Citation34 More recently, Chung et alCitation32 have reported that Hmox1, induced as a protective mechanism against oxidative stress, was highly expressed in rat liver 60 days after carbon tetrachloride injection, and Cpt1 expression with other genes responsible for fatty acid degradation were downregulated at 60 days. These authors also showed that Fstl was a fibrosis/cirrhosis-specific gene, and was highly upregulated at 90 days after injection of carbon tetrachloride.
Conclusion
In conclusion, this study illustrates the potential of noninvasive MRI protocols for assessing longitudinally the biodistribution of SWCNT with associated intrinsic metal impurities. The same approach can be used for any other magnetically labeled nanoparticles. A transitional accumulation of raw SWCNT was detected in the spleen (up to day 7), liver (up to day 2), and kidney (up to 5 hours). MRI readouts were correlated and confirmed by ex vivo Raman spectroscopy performed on blood samples, as well as iron assay and histological analysis performed on different body organs.
No acute toxicological effect on liver metabolism was observed after injection of both well dispersed and functionalized SWCNT assessed using ex vivo HR-MAS 1H NMR, with no clustering of NMR spectra using principal component analysis (specific biomarkers of toxicity) as confirmed using quantitative RT-PCR analysis.
Acknowledgements
The authors acknowledge V Martinez for help with Raman spectroscopy, C Richard for SWCNT functionalization, and F Lagarde for ICP measurements. This work was supported by the French ANR through the RESPINTTOX project (SEST program, 2006).
Disclosure
The authors report no conflicts of interest in this work.
References
- BaughmanRHZakhidovAAde HeerWACarbon nanotubes – the route toward applicationsScience2002297558278779212161643
- AjayanPMTourJMMaterials science: Nanotube compositesNature200744771481066106817597753
- LiuYWangHNanomedicine: Nanotechnology tackles tumoursNature Nanotechnol200721202118654199
- LiuZChenKDavisCDrug delivery with carbon nanotubes for in vivo cancer treatmentCancer Res200868166652666018701489
- LacerdaLBiancoAPratoMKostarelosKCarbon nanotubes as nanomedicines: From toxicology to pharmacologyAdv Drug Deliv Rev200658141460147017113677
- SayesCMLiangFHudsonJLFunctionalization density dependence of single-walled carbon nanotubes cytotoxicity in vitroToxicol Lett2006161213514216229976
- WickPManserPLimbachLKThe degree and kind of agglomeration affect carbon nanotube cytotoxicityToxicol Lett2007168212113117169512
- RajaPMConnolleyJGanesanGPImpact of carbon nanotube exposure, dosage and aggregation on smooth muscle cellsToxicol Lett20071691516317275220
- SchipperMLNakayama-RatchfordNDavisCRA pilot toxicology study of single-walled carbon nanotubes in a small sample of miceNature Nanotechnol20083421622118654506
- LiuZDavisCCaiWHeLChenXDaiHCirculation and long-term fate of functionalized, biocompatible single-walled carbon nanotubes in mice probed by Raman spectroscopyProc Natl Acad Sci U S A200810551410141518230737
- WelsherKLiuZDaranciangDDaiHSelective probing and imaging of cells with single walled carbon nanotubes as near-infrared fluorescent moleculesNano Lett20088258659018197719
- O’ConnellMJBachiloSMHuffmanCBBand gap fluorescence from individual single-walled carbon nanotubesScience2002297558159359612142535
- Al FarajACieslarKLacroixGGaillardSCanet-SoulasECrémillieuxYIn vivo imaging of carbon nanotube biodistribution using magnetic resonance imagingNano Lett2009931023102719199447
- FischbachFBruhnHAssessment of in vivo 1H magnetic resonance spectroscopy in the liver: A reviewLiver Int200828329730718290772
- WangYBollardMEKeunHSpectral editing and pattern recognition methods applied to high-resolution magic-angle spinning 1H nuclear magnetic resonance spectroscopy of liver tissuesAnal Biochem20033231263214622955
- HolmesECloarecONicholsonJKProbing latent biomarker signatures and in vivo pathway activity in experimental disease states via statistical total correlation spectroscopy (STOCSY) of biofluids: Application to HgCl2 toxicityJ Proteome Res2006561313132016739983
- RighiVDuranteCCocchiMDiscrimination of healthy and neoplastic human colon tissues by ex vivo HR-MAS NMR spectroscopy and chemometric analysesJ Proteome Res2009841859186919714812
- Al FarajABessaadACieslarKLacroixGCanet-SoulasECremillieuxYLong-term follow-up of lung biodistribution and effect of instilled SWCNTs using multiscale imaging techniquesNanotechnology2010211717510320368681
- ElgrabliDAbella-GallartSAguerre-ChariolOEffect of BSA on carbon nanotube dispersion for in vivo and in vitro studiesNanotoxicology200714266278
- LiuJRinzlerAGDaiHFullerene pipesScience19982805367125312569596576
- JungCWJacobsPPhysical and chemical properties of superpara-magnetic iron oxide MR contrast agents: Ferumoxides, ferumoxtran, ferumoxsilMagn Reson Imaging19951356616748569441
- NieSEmorySRProbing single molecules and single nanoparticles by surface-enhanced Raman scatteringScience19972755303110211069027306
- FauldsKBarbagalloRPKeerJTSmithWEGrahamDSERRS as a more sensitive technique for the detection of labelled oligonucleotides compared to fluorescenceAnalyst2004129756756815213819
- WatersNJHolmesEWaterfieldCJFarrantRDNicholsonJKNMR and pattern recognition studies on liver extracts and intact livers from rats treated with alpha-naphthylisothiocyanateBiochem Pharmacol2002641677712106607
- JorioAPimentaMAFilhoAGSSaitoRDresselhausGDresselhausMSCharacterizing carbon nanotube samples with resonance Raman scatteringNew J Phys20035139
- ShenKCurranSXuHSingle-walled carbon nanotube purification, pelletization, and surfactant-assisted dispersion: A combined TEM and resonant micro-Raman spectroscopy studyJ Phys Chem B2005109104455446316851517
- LiuZCaiWHeLIn vivo biodistribution and highly efficient tumour targeting of carbon nanotubes in miceNat Nanotechnol200721475218654207
- WeiLLiaoPWuHMetabolic profiling studies on the toxicological effects of realgar in rats by (1)H NMR spectroscopyToxicol Appl Pharmacol2009234331432519073202
- ShiCWuCQCaoAMShengHZYanXZLiaoMYNMR-spectroscopy-based metabonomic approach to the analysis of Bay41-4109, a novel anti-HBV compound, induced hepatotoxicity in ratsToxicol Lett2007173316116717826925
- GarrodSHumpherEConnorSCHigh-resolution (1)H NMR and magic angle spinning NMR spectroscopic investigation of the biochemical effects of 2-bromoethanamine in intact renal and hepatic tissueMagn Reson Med200145578179011323804
- EspandiariPZhangJSchnackenbergLKAge-related differences in susceptibility to toxic effects of valproic acid in ratsJ Appl Toxicol200828562863717994530
- ChungHHongDPKimHJDifferential gene expression profiles in the steatosis/fibrosis model of rat liver by chronic administration of carbon tetrachlorideToxicol Appl Pharmacol2005208324225416239168
- WeberLWBollMStampflAHepatotoxicity and mechanism of action of haloalkanes: Carbon tetrachloride as a toxicological modelCrit Rev Toxicol200333210513612708612
- TahashiYMatsuzakiKDateMDifferential regulation of TGF-beta signal in hepatic stellate cells between acute and chronic rat liver injuryHepatology2002351496111786959