
Abstract
Background
The preparation and biological applications of ultra-small graphene quantum dots (GQDs) with accurate-controlled size are of great significance.
Methods
Here in, we report a novel procedure involving pyrolysis of trisodium citrate and subsequent ultrafiltration for fabricating monolayer GQDs with ultra-small lateral size (1.3±0.5 nm).
Results
The GQDs exhibit blue photoluminescence with peak position independent of excitation wavelength. The quantum yield of GQDs is measured to be 3.6%, and the average fluorescence lifetime is 2.78 ns.
Conclusion
Because of high stability and low toxicity, GQDs are demonstrated to be excellent bioimaging agents. The ultra-small GQDs can not only distribute in the cytoplasm but also penetrate into the nuclei. We ensure that this work will add a new dimension to the application of graphene materials for nanomedicine.
Introduction
Graphene quantum dots (GQDs), a new kind of nanomaterial with the combined properties of graphene and quantum dots, are graphene sheets with lateral dimensions less than 100 nm in single-, double- and few-layer.Citation1–Citation5 As zero dimensional carbon nanomaterials, GQDs have shown numerous wonderful physical and chemical properties due to the pronounced quantum confinement and edge effects.Citation6–Citation8 Compared with organic dyes and semiconductive quantum dots, GQDs are superior in terms of high specific surface area, high photostability against photobleaching and blinking, excellent biocompatibility, and low toxicity.Citation4 In addition, the graphene structure inherent in GQDs endows them with some of the unusual properties of graphene. For these reason, GQDs are proposed to be applicable in various fields, such as biological imaging,Citation9–Citation11 sensing,Citation12 drug delivery,Citation13 catalysis,Citation14,Citation15 and photovoltaics.Citation16
The strategies for the preparation of GQDs can be divided into two major categories: top-down and bottom-up approaches. The top-down splitting method involves exfoliating or breaking down of carbonaceous materials, such as soot, coal, carbon black, graphene, graphene oxide, carbon nanotubes, and carbon fibers, through hydrothermal, electrochemical, concentrated acid oxidation, and microwave or ultrasonic exfoliation methods.Citation17–Citation25 These methods lack precise control of the morphology and size distribution of the products, what’s more, they sometimes require special instruments to operate. The bottom-up organic approach, however, is realized by pyrolysis or carbonization of small organic molecules or by step-wise chemical fusion of small aromatic structures molecules.Citation26–Citation30 These methods allow for excellent control of the properties of the final product.
One of the major areas where GQDs have been used in the biological and health sciences is bioimaging.Citation31 Their intrinsic luminescence offers a very inexpensive option as probes to visualize biological matter both in vivo and in vitro. There have been varying reports on cell imaging based on GQDs with different luminescence and lateral size (2 nm).Citation11,Citation22,Citation24,Citation27,Citation32–Citation34 In these cases, GQDs accumulate mainly in the cytoplasm of cells, but minimally in the nucleus. Cellular uptake and distribution of GQDs have been found to be related to their lateral size.Citation35 Therefore, the preparation and biological applications of ultra-small GQDs with accurate-controlled size are of great significance. Herein, we report a new bottom-up route toward the synthesis of blue-photoluminescent GQDs. The synthesis procedure is simple and fast. Trisodium citrate, which is easily obtained, is directly used as the organic precursor. Monolayer GQDs with ultra-small lateral size (1.3±0.5 nm) were obtained via ultrafiltration. Due to their stable photoluminescence and low cytotoxicity, the GQDs are demonstrated to be excellent probes for cell imaging. The ultra-small monolayer GQDs can not only distribute in the cytoplasm but also penetrate into the nuclei.
Materials and methods
Chemicals and materials
Trisodium citrate dihydrate and dimethyl sulfoxide (DMSO) were purchased from Sinopharm Chemical Reagent Co., Ltd (Shanghai, People’s Republic of China). 3-(4,5-dimethylthiazol-2-yl)–2,5-diphenyl tetrazolium bromide (MTT) and trypsin were bought from Sigma-Aldrich (St Louis, MO, USA). Dulbecco’s Modified Eagle’s Medium (DMEM) was bought from Haikelong Biochemical Products Co., Ltd (Peking, People’s Republic of China). Fetal bovine serum (FBS) was bought from Life Technologies Co., Ltd (Thermo Fisher Scientific, Waltham, MA, USA). Phosphate-buffered saline (PBS) was bought from Kenuo Biotechnology Co., Ltd (Fuzhou, People’s Republic of China). Ultrapure water was used throughout. Unless specified, all other chemicals were of at least analytical reagent grade and used without any further purification.
Preparation of GQDs
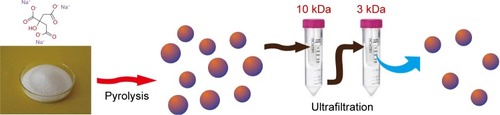
GQDs were synthesized by pyrolyzing trisodium citrate. In a typical procedure, 0.5 g trisodium citrate was directly heated at 200°C for 4 minutes. The white powder turned to deep brown, which implied the formation of GQDs. Then, 6 mL water was added drop by drop into pre-GQDs, followed by vigorous stirring for 10 minutes to get a colloidal solution. The solution was further ultrafiltered in-turn through centrifugal filter devices with a cutoff molecular weight of 10 and 3 kDa. The product with molecular weight of 3~10 kDa was collected for further characterization and use.
Characterization of GQDs
The size and morphology of GQDs was analyzed by using a JEM 2100F transmission electron microscope at an operating voltage of 200 KV. The height distribution of the GQDs was characterized by atomic force microscope (AFM) (Bruker Multimode, Bruker Corporation, Billerica, MA, USA) operating in tapping mode. The X-ray diffraction (XRD) pattern was measured using a Bruker-D8 Advance (Bruker Corporation) and Cu Kα radiation (λ=1.54051 Å) operating at 1 KV. The Fourier transform infrared spectroscopy (FTIR) spectra were measured by a Nicolet iS5 FT-IR (Thermo Nicolet, Thermo Fisher Scientific) spectrometer with the KBr pellet technique. X-ray photoelectron spectroscopy (XPS) was performed using a Thermo Scientific Escalab 250Xi with Al Kα X-ray radiation as the X-ray source for excitation. Binding energies were corrected using the C1s peak at 284.6 eV as the standard. PL spectra of GQDs were recorded using a Cary Eclipse fluorescence spectrophotometer (Agilent Technologies, Santa Clara, CA, USA). The fluorescence lifetime was measured using a photo-counting HORIBA FL-4 system, with a diode laser emitting at 330 nm as the light source.
In vitro cytotoxicity evaluation
The cytotoxicity of GQDs was evaluated by an MTT assay. The human cell lines HeLa were purchased from the Cell Bank of Shanghai Institute of Biochemistry and Cell Biology, Chinese Academy of Sciences (Shanghai, China). HeLa cells were seeded in a 96-well plate at a density of 5×10³ cells per well and cultured in Dulbecco’s Modified Eagle’s Medium (DMEM) with 10% fetal bovine serum (FBS) for 12 hours. Then the cells were incubated with GQDs with different concentrations. After 24 hours, the wells were washed with PBS (pH 7.4), and 200 μL of freshly prepared MTT (0.5 mg/mL) solution was added to each well. The MTT medium solution was removed after 4 hours incubation. 150 μL DMSO was added into each well, and the plate was gently shaken for 30 minutes at room temperature to dissolve all precipitates formed. The absorbance of MTT at 570 nm was recorded by the microplate reader (Thermo Fisher Scientific). Cell viability was expressed by the ratio of absorbance of the cells incubated with GQDs to that of the cells incubated with culture medium only.
Cellular imaging
HeLa cells were maintained in the DMEM supplemented with 10% FBS in 5% CO2 at 37°C. When the cells were grown to the density of 80% confluence, the medium was removed and the adherent cells were washed twice with PBS buffer (pH 7.4). The GQDs solution was then added to the chamber. After incubation for 2 hours, cells were washed with PBS (pH 7.4) and then imaged by a fluorescence microscope (LEICA DMI3000B).
Results and discussion
Characterization of the morphology and composites of the GQDs
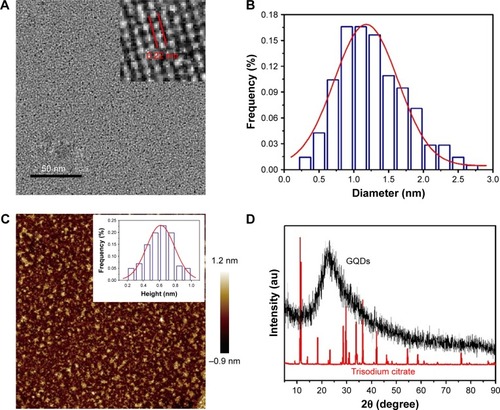
As shown in , the GQDs were synthesized based on pyrolysis of the precursor trisodium citrate and purification by two-stage ultrafiltration. The morphology of the obtained GQDs was characterized by transmission electron microscopy (TEM) and atomic force microscopy (AFM). As shown in , the GQDs are monodispersed and uniformly distributed without apparent agglomeration. The average diameter of the GQDs was 1.3±0.5 nm according to the statistical calculation of more than 200 dots (). They are distinct from other GQDs prepared by bottom-up method, which have relatively large diameter and wide size distribution.Citation26,Citation28,Citation30,Citation32,Citation36 They are also desirably smaller than most macromolecules in a cell. The inset HRTEM image shows high crystallinity of the GQDs and displays a continuous lattice spacing of 0.22 nm, which corresponds to (1120) lattice fringes of graphite.Citation37 Furthermore, the ordered carbon hexagon structures have been readily observed, which implies that the GQDs consist of intact sp2 clusters. The AFM image reveals that the topographic height of the GQD is ~0.6 nm, in good agreement with the thickness of single-layer graphene ().Citation36 To confirm the formation of GQDs, XRD patterns were used to characterize the precursor and the product. As shown in , the XRD pattern of trisodium citrate exhibited a series of sharp peaks, indicating that sodium citrate is of high crystallinity. The pyrolysis products had an obvious diffraction peak at 23.07°, suggesting that carbonizing trisodium citrate would produce graphene structures. The peak is broad due to the small size of the GQDs.
Figure 1 (A) The TEM image of GQDs. Inset: a typical single GQD with a lattice spacing of 0.22 nm. (B) The size distribution of GQDs calculated from 200 dots. (C) AFM image of GQDs. Inset: the height distribution of the GQDs calculated from 100 dots as shown in the AFM image. (D) XRD pattern of trisodium citrate and GQDs.
Abbreviations: TEM, transmission electron microscopy; GQDs, graphene quantum dots; AFM, atomic force microscopy; XRD, X-ray diffraction.
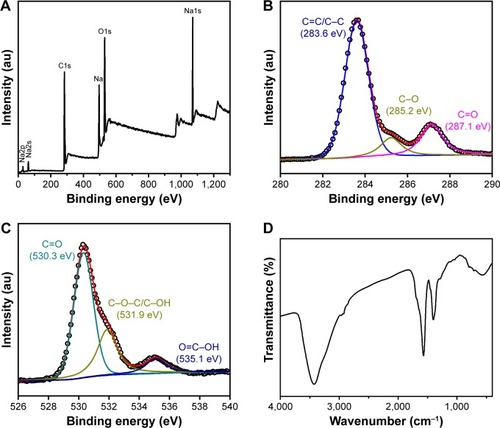
The detailed elemental compositions and functional groups of the GQDs were characterized using XPS and FTIR. As shown in , the GQDs are mainly composed of C, O, Na and H. The high-resolution spectrum of C1s could be deconvoluted into three surface components, corresponding to C=C/C-C (283.6 eV), C-O (285.2 eV), and C=O (287.1 eV), respectively (). The high-resolution spectrum of O1s confirmed the presence of C=O (530.3 eV), C-OH (531.9 eV), and O=C-OH (535.1 eV) bonds (). As shown in the FTIR spectrum (), the absorption peaks centered at 1,402 and 1,591 cm−1 are attributed to the symmetric and antisymmetric vibrations of COO−, respectively. The broad absorption peak centered at 3,428 cm−1 is attributed to O-H stretching vibration. It should be noted that the GQDs exhibit nearly no absorption of C-H and C-O-C, implying that they have few surface defects and main functional group of carboxyl on the edge.Citation28,Citation38 These oxygen-containing functional groups make GQDs soluble in aqueous medium. Even stored for 3 months, there is no precipitation.
Figure 2 (A) XPS survey spectrum of the GQDs. (B) XPS high-resolution spectrum of C1s core levels in the GQDs. (C) XPS high-resolution spectrum of O1s core levels in the GQDs. (D) FTIR spectrum of the GQDs.
Abbreviations: XPS, X-ray photoelectron spectroscopy; GQD, graphene quantum dots; FTIR, Fourier transform infrared spectroscopy.
Fluorescence properties of the GQDs
Luminescence property is one of the important features of GQDs. The GQDs aqueous solution was pale-brown under visible light and showed naked-eye observable blue fluorescence under 302 nm UV lamp irradiation (). As compared with the GQDs prepared by citric acid as the precursor, the GQDs produced by the pyrolysis of sodium citrate had a blue-shifted fluorescence emission peak at 420 nm, corresponding to their smaller size.Citation28,Citation39 Furthermore, excitation-independent fluorescence emission curves were observed (), implying that both the size and the surface state of those sp2 clusters contained in GQDs should be uniform.
Figure 3 (A) PL and PLE spectra of the GQDs. The insert shows the photographs of the GQDs aqueous solution under visible light and 302 nm UV light. (B) PL decay curve at 420 nm for the GQDs.
Abbreviations: PL, photoluminescence; PLE, photoluminescence excitation; GQDs, graphene quantum dots.
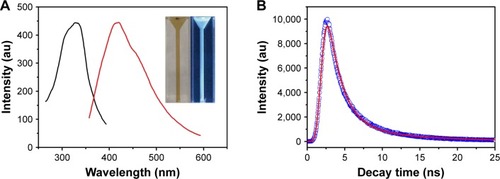
Using quinine sulfate as a reference dye the quantum yield of GQDs was measured to be 3.6% with excitation at 330 nm. The fluorescence lifetime curve of GQDs at 420 nm emission wavelength with 330 nm excitation is shown in . The fluorescence emission exhibited well fitted triple-exponential function. The average fluorescence lifetime was 2.78 ns. The nanosecond lifetime shows the potential applications of GQDs in optoelectronics and biological analysis.
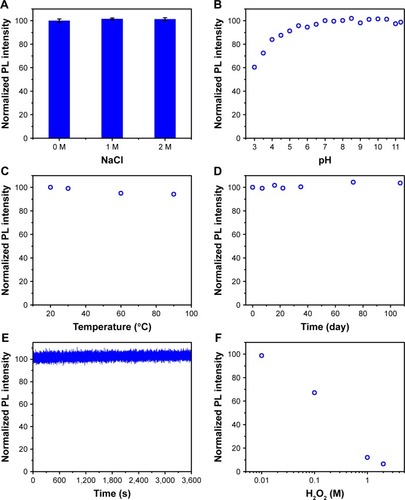
In order to further understand the characteristics of the GQDs, we investigated their fluorescence stability under different conditions. As shown in , the GQDs had good salt tolerance. Even in the presence of 2 M NaCl, the fluorescence intensity could still retain its original value. shows the effect of pH value on the fluorescence of GQDs. It was found that the fluorescence intensity of GQDs increased with the increase of the pH value in acidic pH range 3.0–5.5, which could be ascribed to protonation and deprotonation of the carboxyl groups on the surface of the GQDs. In neutral and alkaline pH range 5.5–11.0, the fluorescence intensity of GQDs was almost kept unchanged. It is worth noting that the GQDs exhibited 60% fluorescence intensity retention when the pH value of the solution was higher than 3.0, implying a great potential application in various pH conditions. shows that GQDs also had excellent thermal stability. The fluorescence intensity could be maintained above 94% when the solution was heated to 90°C. The fluorescence of GQDs remained almost unchanged at room temperature for more than 3 months (). Compared to traditional organic dyes, such as FITC, the GQDs had good photostability. As shown in , the GQDs maintained a stable fluorescence emission when exposed to the ultraviolet light (330 nm) for a long time. This photobleaching resistance feature provides the GQDs with great potential for in vitro and in vivo fluorescence imaging applications. We further investigated the effect of hydrogen peroxide, a common reactive oxygen species in biological systems, on the fluorescence of GQDs. As shown in , although high concentration of hydrogen peroxide quenched the fluorescence, the hydrogen peroxide less than 10 mM did not affect the fluorescence intensity of GQDs.
Figure 4 (A) Effect of ion strength on the fluorescence intensity of GQDs. (B) Effect of pH value on the fluorescence intensity of GQDs. (C) Effect of temperature on the fluorescence intensity of GQDs. (D) Long-term stability of GQDs at room temperature. (E) Fluorescence photostability of GQDs. (F) Effect of hydrogen peroxide on the fluorescence intensity of GQDs.
Abbreviations: PL, photoluminescence; GQDs, graphene quantum dots.
Biotoxicity assay and cell imaging
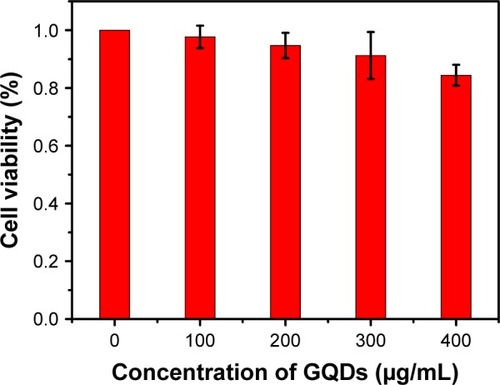
GQDs should show good biocompatibility so that they can be used in bioimaging. The cytotoxicity of as-synthesized GQDs was studied using a standard 3-(4,5-dimethylthiazol-2-yl)-2,5-diphenyltetrazolium bromide (MTT) cell viability assay. HeLa cell viability was evaluated after the cells were exposed to 0–400 μg/mL GQDs for 24 hours. As shown in , when the concentration of GQDs increased to 400 μg/mL, the cell survival rate is more than 80%, suggesting that the fluorescent GQDs can serve as an effective biological imaging probe with low cytotoxicity.
Figure 5 Cell viability of HeLa cancer cells after incubation with GQDs at different concentrations after 24 hours.
Abbreviation: GQDs, graphene quantum dots.
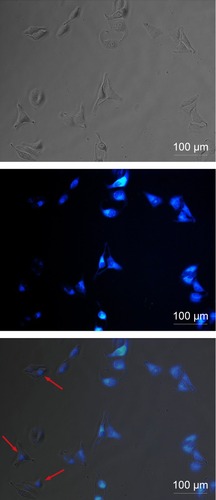
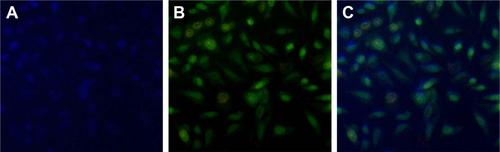
To demonstrate the potential application of the GQDs as a fluorescent probe, we performed in vitro cell imaging experiments using a HeLa cell line as a model. After being incubated with GQDs (100 µg/mL) for 2 hours, the bright-field and fluorescence images were separately recorded. shows that the cells are lit up brightly by internalized GQDs. Simultaneously, it was noticed that the GQDs were distributed not only in the cytoplasm. The GQDs could penetrate into the nuclei probably due to their ultra-small size (as indicated by the red arrows).Citation35 Further experiments were conducted to confirm the nuclear penetration of GQDs. The nucleus of HeLa cell was stained with acridine orange/ethidium bromide (AO/EB) dyes. It can be seen that the localized blue emission from GQDs and green emission from AO/EB dyes show some overlap (). This clearly supports that the blue fluorescent GQDs can enter into the nucleus.
Figure 6 Microscopy images of HeLa cells after incubation with GQDs for 2 hours (from left to right, bright-field image, fluorescence image, and merged image). As indicated by the red arrows, the GQDs can penetrate into the nuclei.
Abbreviation: GQDs, graphene quantum dots.
Scheme 1 Processing diagram for the preparation of photoluminescent GQDs.
Abbreviation: GQDs, graphene quantum dots.
Conclusion
We developed a fast pyrolytic carbonization route to synthesize GQDs using trisodium citrate as precursor. Ultra-small monolayer GQDs (1.3±0.5 nm) with blue-photoluminescence have been obtained via ultrafiltration. The quantum yield of GQDs is measured to be 3.6% with excitation at 330 nm and the average fluorescence lifetime is 2.78 ns. Such GQDs have shown good water solubility, excellent stability, and favorable biocompatibility. The blue fluorescent GQDs have been shown to be effective for bioimaging. It adds a new dimension to the application of graphene materials for nanomedicine.
Acknowledgments
We sincerely acknowledge the financial support of the National Natural Science Foundation of China (81772287), the Program for Innovative leading talents in Fujian Province (2016B016), Joint Project of Major Diseases in Xiamen City of China (3,502Z20179044), and the Natural Science Foundation of Fujian Province (2016J01643).
Supplementary materials
Figure S1 Fluorescence emission spectra of GQDs with different excitation wavelength.
Abbreviation: GQDs, graphene quantum dots.
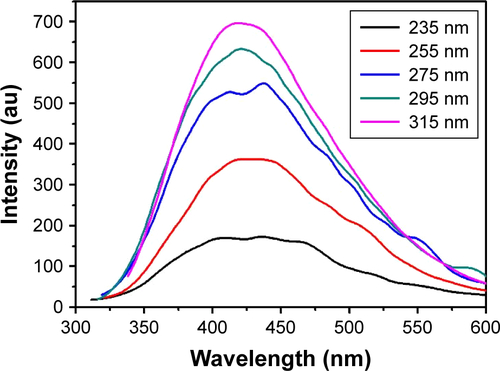
Figure S2 Fluorescent images of HeLa cells (A) after treatment with GQDs; (B) after staining with AO/EB dyes. (C) Merged image of (A and B).
Abbreviations: GQDs, graphene quantum dots; AO/EB, acridine orange/ethidium bromide.
Disclosure
The authors report no conflicts of interest in this work.
References
- BiancoAChengH-MEnokiTAll in the graphene family – a recommended nomenclature for two-dimensional carbon materialsCarbon20136516
- ShenJZhuYYangXZongJZhangJLiCOne-pot hydrothermal synthesis of graphene quantum dots surface-passivated by polyethylene glycol and their photoelectric conversion under near-infrared lightNew J Chem201236197101
- ZhangZZhangJChenNQuLGraphene quantum dots: an emerging material for energy-related applications and beyondEnergy Environ Sci201251088698890
- LiLWuGYangGPengJZhaoJZhuJJFocusing on luminescent graphene quantum dots: current status and future perspectivesNanoscale20135104015403923579482
- PonomarenkoLASchedinFKatsnelsonMIChaotic Dirac billiard in graphene quantum dotsScience2008320587435635818420930
- LsLYanXColloidal graphene quantum dotsJ Phys Chem Lett201011725722576
- JinSHKimDHJunGHHongSHJeonSTuning the photoluminescence of graphene quantum dots through the charge transfer effect of functional groupsACS Nano2013721239124523272894
- ZhuSSongYWangJPhotoluminescence mechanism in graphene quantum dots: quantum confinement effect and surface/edge stateNano Today2017131014
- RoyPPeriasamyAPLinCYPhotoluminescent graphene quantum dots for in vivo imaging of apoptotic cellsNanoscale2015762504251025569453
- ZhengXTThanAAnanthanarayaAKimDHChenPGraphene quantum dots as universal fluorophores and their use in revealing regulated trafficking of insulin receptors in adipocytesACS Nano2013776278628623799995
- WuXTianFWangWChenJWuMZhaoJXFabrication of highly fluorescent graphene quantum dots using L-glutamic acid for in vitro/in vivo imaging and sensingJ Mater Chem C Mater20131314676468423997934
- SunHWuLWeiWQuXXgQRecent advances in graphene quantum dots for sensingMater Today20131611433442
- WangZXiaJZhouCSynthesis of strongly green-photoluminescent graphene quantum dots for drug carrierColloids Surf B Biointerfaces2013112319219623974005
- HanYTangDYangYNon-metal single/dual doped carbon quantum dots: a general flame synthetic method and electro-catalytic propertiesNanoscale20157145955596225771786
- YehTFTengCYChenSJTengHNitrogen-doped graphene oxide quantum dots as photocatalysts for overall water-splitting under visible light illuminationAdv Mater201426203297330324677453
- GuptaVChaudharyNSrivastavaRSharmaGDBhardwajRChandSLuminscent graphene quantum dots for organic photovoltaic devicesJ Am Chem Soc2011133269960996321650464
- LiuHYeTMaoCFluorescent carbon nanoparticles derived from candle sootAngew Chem Int Ed Engl200746346473647517645271
- YeRXiangCLinJCoal as an abundant source of graphene quantum dotsNat Commun20134294324309588
- PanDZhangJLiZWuMMhWHydrothermal route for cutting graphene sheets into blue-luminescent graphene quantum dotsAdv Mater201022673473820217780
- LiL-LJiJFeiRA facile microwave avenue to electrochemiluminescent two-color graphene quantum dotsAdv Funct Mater2012221429712979
- ShinYLeeJYangJMass production of graphene quantum dots by one-pot synthesis directly from graphite in high yieldSmall201410586687024745051
- DongYChenCZhengXOne-step and high yield simultaneous preparation of single- and multi-layer graphene quantum dots from CX-72 carbon blackJ Mater Chem2012221887648766
- LinLZhangSCreating high yield water soluble luminescent graphene quantum dots via exfoliating and disintegrating carbon nanotubes and graphite flakesChem Commun201248821017710179
- PengJGaoWGuptaBKGraphene quantum dots derived from carbon fibersNano Lett201212284484922216895
- LiYHuYZhaoYAn electrochemical avenue to green-luminescent graphene quantum dots as potential electron-acceptors for photovoltaicsAdv Mater201123677678021287641
- TangLJiRCaoXDeep ultraviolet photoluminescence of water-soluble self-passivated graphene quantum dotsACS Nano2012665102511022559247
- ZhuSZhangJQiaoCStrongly green-photoluminescent graphene quantum dots for bioimaging applicationsChem Commun2011472468586860
- DongYShaoJChenCBlue luminescent graphene quantum dots and graphene oxide prepared by tuning the carbonization degree of citric acidCarbon2012501247384743
- ChenGZhuoZNiKRupturing C60 molecules into graphene-oxide-like quantum dots: structure, photoluminescence, and catalytic applicationSmall201511395296530426287442
- LiuRWuDFengXMüllenKBottom-up fabrication of photoluminescent graphene quantum dots with uniform morphologyJ Am Chem Soc201113339152211522321894989
- SchroederKLGorehamRVNannTGraphene quantum dots for theranostics and bioimagingPharm Res201633102337235727207272
- ZhuangQWangYNiYYnNSolid-phase synthesis of graphene quantum dots from the food additive citric acid under microwave irradiation and their use in live-cell imagingLumin2016313746753
- GaoTWangXYangLYRed, yellow, and blue luminescence by graphene quantum dots: syntheses, mechanism, and cellular imagingACS Appl Mater Interfaces2017929248462485628675929
- GokhaleRSinghPBlue luminescent graphene quantum dots by photochemical stitching of small aromatic molecules: fluorescent nanoprobes in cellular imagingPart Part Syst Char2014314433438
- WuCWangCHanTZhouXGuoSZhangJInsight into the cellular internalization and cytotoxicity of graphene quantum dotsAdv Healthc Mater20132121613161923703800
- KimJSuhJSSize-controllable and low-cost fabrication of graphene quantum dots using thermal plasma jetACS Nano2014854190419624689913
- BianSShenCQianYLiuJXiFDongXFacile synthesis of sulfur-doped graphene quantum dots as fluorescent sensing probes for Ag+ ions detectionSens Actuators B Chem2017242231237
- AlizadehTShokriMHanifehpourYJooSWSangWJA new hydrogen cyanide chemiresistor gas sensor based on graphene quantum dotsInt J Environ Anal Chem2016968763775
- WangSChenZ-GColeILiQStructural evolution of graphene quantum dots during thermal decomposition of citric acid and the corresponding photoluminescenceCarbon201582304313