
Abstract
Introduction
Detection of antigen-specific cytotoxic T lymphocytes (CTLs) is the foundation for understanding hepatocellular carcinoma immune pathology and hepatocellular carcinoma immunotherapy. However, the classical method for labeling CTLs, major histocompatibility complex (MHC)–peptide tetramer, has drawbacks and needs further improvement.
Materials and methods
Here, as a new detection probe, a graphene-based MHC–peptide multimer was developed for sensitively and selectively identifying hepatocellular carcinoma-specific T-cells. To assess its detection efficiency, reduced graphene oxide (RGO) was functionalized with hemin and streptavidin to prepare a functionalized HRGO–streptavidin complex. Biotinylated MHC–peptide monomer was subsequently constructed onto HRGO to generate a detection probe for CTL labeling. The number of T-cells was detected through the reaction between HRGO and tetramethylbenzidine.
Results
Using HRGO/MHC–peptide multimers, the number of T-cells was efficiently detected in both the induction system in vitro and in peripheral blood of patients.
Conclusion
HRGO/MHC-peptide multimers methodology has application prospects in the detection of antigen peptide-specific T cells.
Introduction
Cytotoxic T lymphocytes (CTLs) play a critical role in vaccine development and immune disease pathology.Citation1 The evaluation and analysis of CTL levels contribute to understanding the disease pathology, the mechanism of T-cell immune response, and the application of adoptive immunotherapy.Citation2–Citation4 To date, various CTL analytic methods have been developed, such as 51Cr release analysis, cytokine secreted cell counting, T-cell receptor PCR, and major histocompatibility complex (MHC)–peptide (pMHC) tetramer labeling.Citation5–Citation7 Among them, tetramer labeling technology is the most common method. Since light bleaching often occurs after the repeated excitation of fluorescent dyes, the stability of the tetramer labeled with organic fluorescent dyes is not reliable.Citation8,Citation9 In addition, the affinity between pMHC tetramers and some T-cell receptors on the CTL surface is relatively weak.Citation10 Therefore, increasing the number of MHC monomers in the tetramer complex could improve the efficiency of CTL testing.Citation11–Citation13
Due to its unique physical, chemical, and biological properties, graphene is at the frontier of nanotechnology.Citation14–Citation16 With its two-dimensional matrix structure, graphene is considered to be a single layer of stripped graphiteCitation17 and plays multiple roles in biomedical applications through introducing hydroxyl, carbonyl, and epoxy groups,Citation18,Citation19 as well as in antibodies, medicines, and functional nanoparticles.Citation16,Citation20,Citation21 For example, graphene can be loaded with hemin through a π–π conjugation effect,Citation22,Citation23 and the amino groups in streptavidin can be reacted with carboxyl groups on modified graphene.Citation24,Citation25 A biotinylated MHC monomer, thus, can be loaded onto a graphene surface through biotin–streptavidin effect.Citation21,Citation26
Here, based on graphene, a novel CTL detection probe and related detection model were evaluated. The hemin functionalized reduced graphene oxide (HRGO) was first constructed and subsequently loaded with an MHC–peptide complex through the biotin–streptavidin reaction to prepare graphene-based MHC–peptide multimers (HRGO/pMHC multimers). The capture probe was prepared by adding a biotinylated MHC monomer in streptavidin-preincubated plates to bind CTLs. The HRGO/pMHC multimers selectively bound to the T-cells, while the number of T-cells was detected through the catalytic reaction between HRGO and tetramethylbenzidine (TMB)/H2O2. The detection efficiency of this probe was evaluated under different circumstances and compared with phycoerythroprotein (PE)/pMHC tetramers.
Materials and methods
Materials
Graphene was purchased from Nanjing Xianfeng Nano Materials Tech Co. Ltd (Nanjing, China). Biotinylated HLA-A*0201-restricted AFP158–166 MHC monomer and MAGE-A1278–286 MHC monomer were purchased from Beijing Kuangbo Co. Ltd (Beijing, China). Hemin, PE-conjugated streptavidin antibody, and streptavidin ELISA plates were purchased from Sigma Aldrich (St Louis, MO, USA). Antigen peptide SLYN-TVATL (SL9), FMNKFIYE (AFP158–166), and KVLEYVIKV (MAGE-A1278–286) were obtained from Hangzhou Zhongtai Co. Ltd (Hangzhou, China). The TAP-deficient HLA-A2+ cell line (T2 cell line) was obtained from the American Type Culture Collection. T2 cells were grown in RPMI 1640 (Thermo Fisher Scientific, Waltham, MA, USA) supplemented with 15% fetal bovine serum (Hyclone, Logan, UT, USA), 50 U/mL penicillin, and 50 µg/mL streptomycin in 5% CO2 at 37°C in a humidified incubator. All chemicals used were of the highest purity available. The peripheral blood of hepatoma patients and healthy individuals was provided by the Clinical Laboratory of Chun’an First People’s Hospital (Zhejiang, China). All patients and volunteers provided written informed consent. The studies involving blood samples were approved by the Medical Ethics Committee of Chun’an First People’s Hospital.
Synthesis of HRGO
Graphene oxide (GO) solid powder (1 mg) was dissolved in ultra-pure water (ddH2O; 1 mL). The suspension was sonicated to a uniform dispersion. To obtain the hemin functionalized graphene oxide (HGO), 5 mg/mL hemin was added into the suspension which was treated with vortex oscillation. After bathing at 60°C water for 4 hours, the uncombined hemin was washed away using sterile, ultra-pure water (ddH2O). To obtain the HRGO, hydrazine hydrate was added after hemin treatment.
Synthesis of HRGO/MHC–peptide multimers and PE/pMHC tetramers
HRGO (1 mg/mL, 50 µL) and 1-ethyl-3(3-dimethyl amino-propyl) carbodiimide carbodiimide (EDC)/N-hydroxysuccin-imide (NHS) (0.1 M, 10 µL) were mixed and then incubated at room temperature for 1 hour. Streptavidin (1 µM, 10 µL) was added into the solution and stirred. After incubation at 4°C overnight, the uncombined streptavidin was washed away using ddH2O. To obtain HRGO/pMHC multimers, 4 µL of the biotinylated MHC–peptide monomer (1 µM) was added into the streptavidin-HRGO ten times every 10 minutes in a dark environment. Similarly, 5 µL of biotinylated MHC–peptide monomer (1 µM) was added to the PE-conjugated streptavidin antibody solution (1 µM) and stirred in the dark ten times every 10 minutes. The compounds were then purified using a 100 kDa membrane filter to obtain PE/pMHC tetramers. The synthetic reagents were all stored at 4°C.
Characterizations
The optical absorbance characteristic of hemin, HGO, and HRGO, was investigated by ultraviolet (UV)–visible absorption spectra (F-7000, Thermo Fisher Scientific). Fourier transform infrared radiation spectra (TL-8000; Bruker Optik GmbH, Ettlingen, Germany) were used to identify the functional groups on the nanomaterials. The distribution of probe diameters was determined using a laser particle size analyzer (Zeta sizer Nano ZS; Malvern Instruments, Malvern, UK). The zeta potential of samples was measured by zeta potential analyzer (Zeta sizer Nano ZS; Malvern), and all the samples were dispersed in water of pH=7.0. Thermogravimetric analysis (TGA 4000; Perkin Elmer) was performed with a thermogravimetric speed of 4°C/min and automatic cooling to 50°C after heating to 800°C.
Induction of hepatocellular carcinoma-specific T-cells in vitro
T2 cells were incubated with the antigen peptide AFP158–166 (40 µg/mL) for 6 hours. After 200 Gy X-ray irradiation, cells were centrifuged at 1,500 rpm for 5 minutes. Cells were collected and resuspended in serum-free RPMI 1640. Peripheral blood mononuclear cells from clinical blood samples were isolated using the Ficoll–Hypaque gradient method. Peripheral blood mononuclear cells were cultured in tissue culture bottles for 2 hours to obtain adherent T lymphocytes. Subsequently, antigen peptide AFP158–166-loaded T2 cells (T2/AFP158–166) were co-incubated with peripheral T lymphocytes in complete medium. IL-2 (20 U/mL) and IL-7 (5 ng/mL) were added at day 1 and day 4, respectively. These cytokines were supplemented every 3 days. The medium was replaced twice a week and T2/AFP158–166 was added once a week for 3 weeks.
Identification of hepatocellular carcinoma-specific T-cells by HRGO/pMHC multimers
Biotinylated antigen peptide–MHC monomer (1 µM, 10 µL) was incubated in streptavidin 96-well plates in a dark environment for 20 minutes. After repeating ten times, the plates were washed with 0.5% BSA. The induced AFP158–166-specific T-cells (1×10⁶ cells) were added into pMHC monomer-modified plates in a dark environment at 4°C for 1 hour. HRGO/pMHC multimers were added and stirred for 1 hour. To remove the uncombined substances, ultrapure water was used to wash the plate well several times. To reflect the frequency of CTLs, 100 µL TMB substrate and 1 µL H2O2 (500 mM) were added. Then the plates were set on a platform rocker at 37°C for 30 minutes (for optimized data of TMB, H2O2, and colorimetric reaction time, see ). The absorption spectra of the samples at a wavelength of 650 nm were measured by Multiskan Spectrum (Thermo Fisher Scientific).
Identification of hepatocellular carcinoma-specific T-cells by PE/pMHC tetramers
The T-cells were collected by centrifugation and washed three times with PBS. After incubation with both PE/pMHC tetramers and fluorescein isothiocyanate-CD8 in the dark, cells were washed again, collected, and analyzed with flow cytometry (Beckman Coulter, Inc., Brea, CA, USA). The flow cytometry data were analyzed in real time using Expo32 ADC 1.1C (Beckman Coulter, Inc.).
Statistical analysis
All data are given as mean±SD. For statistical evaluation, the independent t-test was used for comparison between groups. GraphPad Prism software version 6.0 (La Jolla, CA, USA) was used for data analysis. P-values <0.05 were considered as statistically significant. Least significant difference, Student–Newman–Keuls, and Bonferroni post hoc tests were used.
Results
The preparation procedure and working principle of HRGO/pMHC multimers for CTL detection
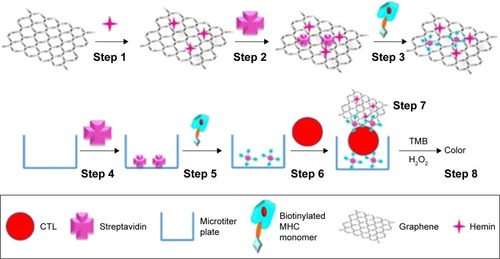
Since graphene can be easily modified with functional groups, or loaded with antibodies, medicines, and other nanoparticles, it has been widely used in the field of biomaterials. As shown in , based on graphene, we created a novel probe for CTL detection. The detection probes were HRGO/pMHC multimers consisting of graphene, hemin, streptavidin, and biotinylated MHC monomers. The capture probes were 96-well plates modified with pMHC multimers consisting of streptavidin and biotinylated MHC monomers. Both probes and CTLs made a sandwich structure: HRGO/pMHC multimers–CTLs–plates. The frequency of CTLs was proportional to the number of hemin molecules in the sandwich structure.
Figure 1 Schematic diagram of the synthesis of HRGO/pMHC multimers as CTL detection probes and the detection process of the new graphene-based assay.
Notes: First, hemin was bound onto GO to create the HRGO through π–π covalent linkage (Step 1). Streptavidin was subsequently bound onto HRGO through the reaction between amino groups from streptavidin and the carboxyl groups on HRGO (Step 2). Next, the biotinylated pMHC monomer was loaded onto streptavidin–HRGO via biotin–streptavidin affinity to create the CTL detection probe (Step 3), graphene based (HRGO/pMHC multimers). The biotinylated pMHC monomer was also added into streptavidin-preincubated plates through biotin–streptavidin (Step 4) to create the capture probe (Step 5), which can selectively catch CTLs (Step 6). Finally, the HRGO/pMHC multimers selectively bound to CTLs (Step 7) were induced to detect the frequency of CTLs through the catalytic reaction between HRGO and TMB/H2O2 (Step 8). The absorption spectrum of the solvent around 650 nm was measured to determine the amount of hemin on HRGO. Sensitive detection, thus, can be achieved by the positive correlation between hemin and CTL amount.
Abbreviations: CTL, cytotoxic T lymphocyte; GO, graphene oxide; HRGO, hemin reduced graphene oxide; MHC, major histocompatibility complex; pMHC, major histocompatibility complex peptide; TMB, tetramethylbenzidine.
Characterization of graphene and composite nanomaterials
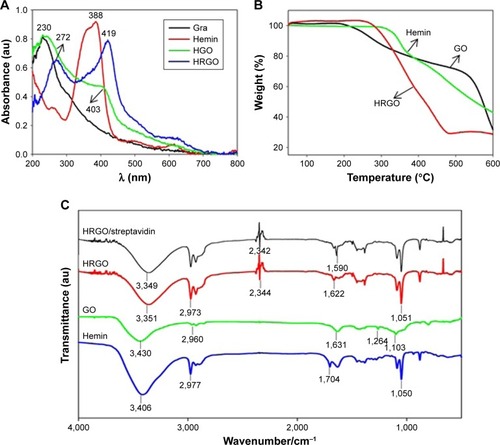
The load of hemin on GO was investigated using UV–vis spectrometry. As shown in , the absorbance peaks of GO and hemin were 230 and 388 nm, respectively. The hemin-conjugated GO (HGO) had nearly the same absorbance characteristics as pristine GO, while the hemin absorbance peak in UV–vis spectra shifted from 388 to 403 nm. While hemin was loaded on reduced graphene oxide (RGO), the peaks of GO and hemin were red-shifted to 272 and 419 nm, respectively. Hemin content on HRGO was higher than that on HGO, which was determined from the relative hemin absorbance peak intensity. TGA results depicted in show two falling inflection points were found in the TGA curve of GO, while one point was observed for hemin. The inflection point of the HRGO fell in between. By a combination of the results above, both HRGO and HRGO/pMHC multimers were successfully prepared. In addition, Fourier transform infrared radiation was used to measure the functional groups on GO, hemin, HRGO, and streptavidin functionalized HRGO (). GO showed the functional groups of C-O (~1,264 cm−1) and C-O-C (~1,103 cm−1). In addition to these peaks, HRGO also showed that a strong characteristic peak existed on hemin (~1,050 cm−1). When HRGO was modified with streptavidin, the absorbance peak which represented –CONH– (1,622 cm−1) shifted to (1,590 cm−1) and the transmittance increased, suggesting a successful connection of RGO, hemin, and streptavidin.
Figure 2 Absorbence peaks of GO and hemin.
Note: (A) Absorption spectra, (B) thermogravimetric analysis, and (C) infrared spectroscopy of nanoparticles. (A) The origin and end of the arrow in represent the absorbance peak position and the value of the absorbance peak respectively. (B) The arrow indicates the corresponding nanomaterial for each absorption spectrum.
Abbreviations: GO, graphene oxide; HGO, hemin functionalized graphene oxide; HRGO, hemin functionalized reduced graphene oxide.
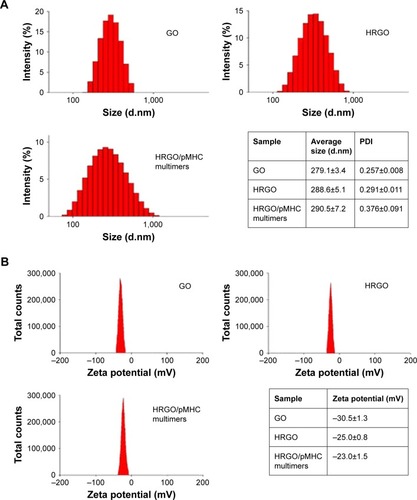
As shown in , after introduction of hemin onto RGO and the subsequent loading of biotinylated pMHC monomers onto HRGO, the average particle size increased from 279.1±3.4 to 288.6±5.1 and 290.5±7.2 nm, respectively. In addition, the zeta potential changed from −30.5±1.3 to −25.0±0.8 and −23.0±1.5 mV, respectively. The increase in particle size can be attributed to the covering of GO with hemin and biotinylated pMHC monomers, which also caused the decrease in negative zeta potential because of the reduction in oxygen-containing functional groups on the surfaces of GO.
Figure 3 Average particle size after introduction of hemin onto RGO and the subsequent loading of biotinylated pMHC monomers onto HRGO.
Notes: (A) Particle size and (B) zeta potential of GO, HRGO, and HRGO/pMHC multimers.
Abbreviations: GO, graphene oxide; HRGO, hemin reduced GO; PDI, polydispersity index; pMHC, major histocompatibility complex peptide.
The efficiency of HRGO catalyzing TMB reaction
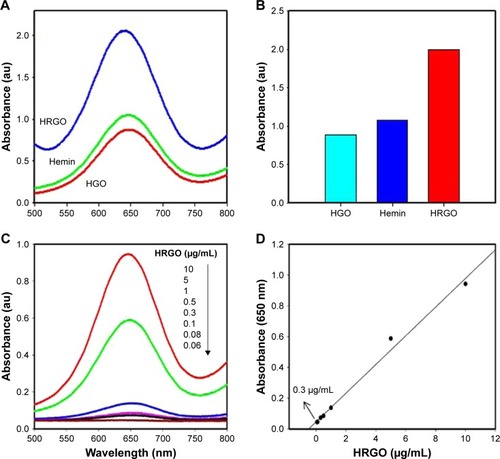
As mentioned above, the frequency of T-cells is determined by the catalytic reaction between the hemin on graphene and TMB. Therefore, it is necessary to evaluate the sensitivity of HGO and HRGO to catalyze the TMB reaction. As shown in , the sensibility of HRGO was higher than HGO, since a higher absorbance peak around 650 nm was obtained (). The reason can be attributed to the higher hemin content on HRGO than that on HGO. More importantly, TMB response signals were detected at different HRGO concentrations (). When HRGO was diluted to as low as 0.3 µg/mL (), the signal was still detectable, demonstrating that HRGO can catalyze the TMB reaction sensitively, and thus can potentially be used as the detection probe.
Figure 4 TMB response signals in response to different HRGO concentrations.
Notes: (A) Absorption spectra of the TMB reaction catalyzed by HGO, hemin, and HGRO. (B) The catalytic activity of the three materials was compared by a histogram. (C) Absorption spectra of the TMB reaction catalyzed by different concentrations of HRGO. (D) HRGO still shows a significant reaction signal at 0.3 µg/mL. The signal to noise ratio is larger than 3.
Abbreviations: HGO, hemin functionalized graphene oxide; HRGO, hemin reduced GO; TMB, tetramethylbenzidine.
Identification of stable HLA-A2 expression on T2 cells pulsed with antigen peptide and on hepatocellular carcinoma-specific T lymphocyte cells in vitro
To ensure the expression of HLA-A2 on T2 cells, expression of HLA-A2 on the surface of T2/AFP158–166 cells was tested by flow cytometry. Antigen peptide AFP158–166 at a concentration of 20 and 40 µg/mL was incubated with T2 cells. Results showed that 7.8% T2 cells expressed HLA-A2 molecules without being pulsed with AFP158–166. Also, 70.6% T2 cells expressed HLA-A2 when pulsed with 20 µg/mL antigen peptide. When T2 cells were loaded with 40 µg/mL antigen peptide AFP158–166, the frequencies increased to 96.3% (), demonstrating that HLA-A2 molecules were expressed stably on T2 cells.
Figure 5 Expression of HLA-A2 molecules on T2 cells.
Notes: (A) The expression of HLA-A2 on the surface of T2/AFP158–166 cells was measured by the monoclonal antibody BB7.2. (B) The frequency of AFP158–166-specific T-cells from in vitro induction was examined using PE/MHC tetramers. HIV virus antigen peptide HIV-gag77–85 (SL9) tetramers were used as the negative control tetramers.
Abbreviations: FITC, fluorescein isothiocyanate; MHC, major histocompatibility complex; PE, phycoerythroprotein.
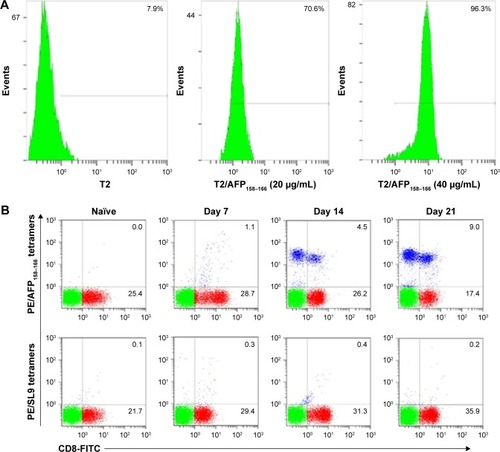
To test the expansion of CTLs in vitro, during cell induction, the frequencies of AFP158–166-specific T-cells were evaluated with conventional PE/pMHC tetramers every week. The results of the flow cytometric assay showed that after in vitro induction for 21 days, the frequencies of antigen peptide AFP158–166-specific T-cells increased (), in comparison with the negative control of HIV-gag77–85 (SL9) tetramers. These results indicated that AFP158–166-specific T-cells were successfully induced in vitro.
Comparison of the detection limit of hepatocellular carcinoma-specific T-cells with HRGO/pMHC multimers and PE/pMHC tetramers
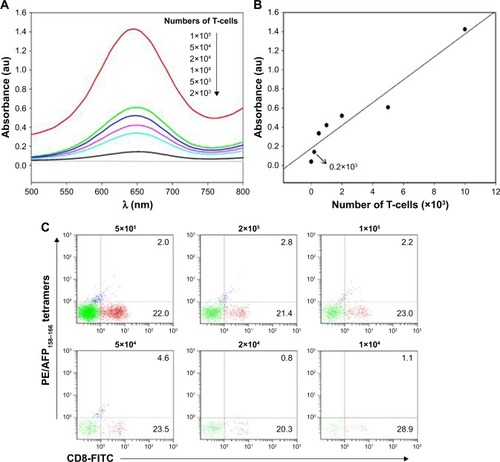
In order to compare the detection efficiency of HRGO/pMHC multimers and PE/pMHC tetramers, T-cells with a detection frequency of 2.2% by flow cytometry were divided into two groups and diluted to different concentrations. One group was tested with HRGO/MHC–peptide multimers using absorption spectrometry, and the other group was detected by the flow cytometry assay. As shown in , when the number of AFP158–166-specific T-cells was diluted to 2×10³ per sample, the detection signal (absorbance peak) of AFP158–166-specific T-cells labeled with HRGO/pMHC multimers was still evident. The linear calibration curve () against T-cells concentration showed 0.14 when the number of T-cells was 2×10³ and 0.04 in the absence of T-cells. The signal-to-background ratio was high (3.5). When the number of T-cells increased, the measured values increased approximately linearly. However, when the cell number was decreased to 5×10³, it was hard to detect the PE/pMHC tetramer-labeled specific T-cells by flow cytometry (). These results indicated that the HRGO/pMHC multimer could be used to detect the target cells when the samples contained very few T-cells, its limit of detection was lower and detection range larger, but flow cytometry needed more T-cells.
Figure 6 Absorbance peak of AFP158–166-specific T-cells labeled with HRGO/pMHC multimers.
Notes: (A) Detection limit of AFP158–166-specific T-cells indicated by UV absorbance spectrum with the HRGO/MHC multimers. (B) The linear calibration curve of the absorbance at 650 nm against T-cells concentration. (C) Detection limit of AFP158–166-specific T-cells indicated by flow cytometry assay. AFP158–166-specific T-cells were diluted to different concentrations and measured with different detection probes.
Abbreviations: FITC, fluorescein isothiocyanate; HRGO, hemin reduced graphene oxide; MHC, major histocompatibility complex; pMHC, major histocompatibility complex peptide; UV, ultraviolet.
Comparison of the frequencies of hepatocellular carcinoma-specific T-cells detected by HRGO/pMHC multimers and PE/pMHC tetramers
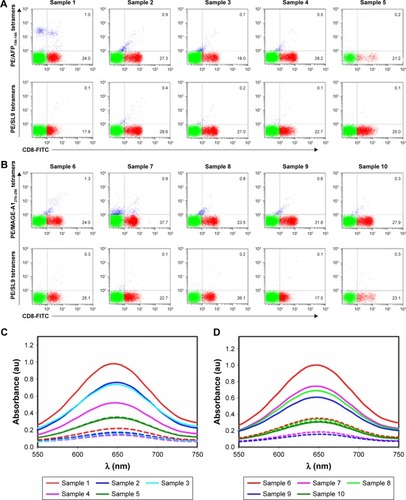
To further evaluate the ability of HRGO/pMHC multimers to detect specific T-cells, the frequencies of AFP158–166 or MAGE-A1278–286-specific T-cells in ten clinical peripheral blood samples from eight hepatocellular carcinoma patients and two healthy persons were evaluated. The frequencies of AFP158–166 and MAGE-A1278–286-specific T-cells were first detected by PE/pMHC tetramers. For the hepatocellular carcinoma-specific T-cells from the eight hepatocellular carcinoma patients, by flow cytometry (), the cells labeled by PE/AFP158–166 tetramers or PE/MAGE-A1278–286 tetramers were little higher in comparison with the negative control based on PE/SL9 tetramers. On the other hand, the absorption peaks representing the number of hepatocellular carcinoma-specific T-cells determined by HRGO/SL9 multimers were lower than the absorption peaks (shown as solid curves) determined by HRGO/AFP158–166 multimers or HRGO/MAGE-A1278–286 multimers (). For the other two samples from two healthy persons, we found the detection results of the new assay display as well as the flow cytometry method to be very similar between positive groups and negative groups. As the number of hepatocellular carcinoma-specific T-cells in healthy people is extremely small, this result supports the conclusion that the new assay has good specificity.
Figure 7 Specific T-cell detection with HRGO/pMHC multimers.
Notes: The frequency of AFP158–166-specific T-cells from ten blood samples (samples from four hepatocellular carcinoma patients and one healthy person) was detected by (A) flow cytometry and (B) the novel graphene-based assay. Similarly, the frequency of MAGE-A1278–286-specific T-cells from separate samples (four hepatocellular carcinoma patients and one healthy person) was identified by (C) flow cytometry and the (D) novel graphene-based assay. Tetramers or multimers based on antigen peptide SL9 were used as the negative control. The result of every blood sample is shown as one solid curve and a dashed curve with the same color. Dashed curves represent the control groups and solid curves represent the experimental groups.
Abbreviations: FITC, fluorescein isothiocyanate; HRGO, hemin reduced graphene oxide; pMHC, major histocompatibility complex peptide.
Statistical comparison of hepatocellular carcinoma-specific T-cells detected by HRGO/pMHC multimers and PE/pMHC tetramers
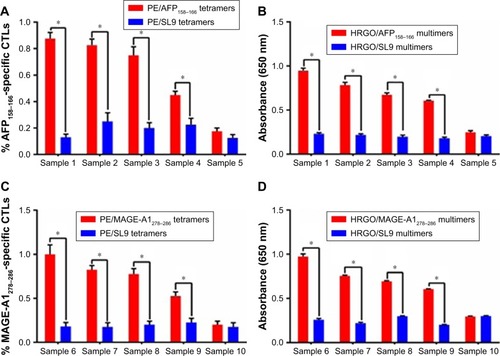
As the statistical data show in , the frequencies of specific T-cells in peripheral blood of hepatocellular carcinoma patients identified by HRGO/MAGE-A1278–286 multimers or HRGO/AFP158–166 multimers were higher than the frequency detected by HRGO/SL9 multimers (P<0.05). On the other hand, HRGO/pMHC multimers showed no difference in the detection of T-cells from two healthy individuals. Every clinical blood sample was tested and analyzed four times. The results of classic flow cytometry analysis and the new absorption spectra assay showed a similar trend: HRGO/pMHC multimers identified hepatocellular carcinoma-specific T-cells with high sensitivity and specificity.
Figure 8 Statistical comparison of the frequency of hepatocellular carcinoma-specific T-cells from the ten clinical blood samples detected by the HRGO/MHC–peptide multimer method compared with the PE/MHC–peptide tetramer method.
Notes: Every clinical blood sample was tested four times. Statistical analysis of the detection of AFP158–166-specific T-cells using (A) flow cytometry and (B) the novel graphene-based assay (n=4). Also, statistical analysis of the detection of MAGE-A1278–286-specific T-cells using (C) flow cytometry and (D) the novel graphene-based assay (n=4). Data represent mean±SD, *P<0.05.
Abbreviations: CTL, cytotoxic T lymphocyte; HRGO, hemin reduced graphene oxide; MHC, major histocompatibility complex; PE, phycoerythroprotein.
Discussion
The aim of this study was to test a new method for the detection of hepatocellular carcinoma-specific T-cells. HRGO/pMHC multimers were constructed as a detection probe for labeling CTLs, that is, the HRGO was first constructed and subsequently loaded with an MHC–peptide complex through biotin–streptavidin to prepare HRGO/pMHC multimers. A biotinylated antigen pMHC monomer was modified on the surface of streptavidin-preincubated plates, while the HRGO/pMHC multimer was used as a detection probe to bind to the captured T-cells to form an “HRGO/pMHC multimer, antigen-specific T-cell, multimer-labeled plate” sandwich structure. In the presence of hydrogen peroxide, the catalysis of the peroxidase substrate color reaction was achieved. Based on the absorbance peak at 650 nm, the hemin involved in the reaction was evaluated. Since the number of CTLs and hemin content was positively correlated, the specificity of CTL-sensitive detection could be achieved. The results demonstrated that the levels of specific CTLs could be detected selectively and sensitively with HRGO/pMHC multimers in both an induction system in vitro and the peripheral blood of patients. The CTL detection efficiency of the HRGO/pMHC multimers was significantly higher than that of PE/pMHC tetramers.
This method has unique advantages over conventional flow detection methods. First, fluorescent-labeled antibodies are not required, eliminating the tedious step of dyeing. Second, expensive flow instruments are not necessary. Efficient detection can be achieved simply from a microplate reader. In addition, the peroxidase substrate can be oxidized to cause color change and is stable compared with the commonly used HRP enzyme.Citation27,Citation28 The multimeric structure makes it compatible with T cell receptors which have more affinity and are more stable than the tetramer.Citation29,Citation30 Last but not least, as the new method allows us to detect batch of samples, a large number of samples can be processed in a short time, while flow cytometry can only detect samples one by one.
The ratio of graphene to hemin needed to be optimized to obtain efficient HRGO/pMHC multimers. In our study, different ratios of graphene and hemin (1:1, 1:3, 1:5, 1:8, and 1:10) were investigated, while the highest load efficiency of hemin on graphene was achieved at the ratio of 1:5. Further increasing the amount of hemin did not enhance the load efficiency. Ensuring good dispersion of graphene in aqueous solution is also the key to this study.Citation31 The particle size evalu ation showed that GO, HRGO, and HRGO/pMHC multimers all possessed their sizes at nanoscale, indicating good dispersion. The single zeta potential peak also demonstrated that negligible impurities existed in the substances.
T-cell analysis by flow cytometry is based on the detection of the frequency of CTLs in the whole cell sample; however, the HRGO/pMHC multimer technique is based on the overall number of CTLs in cell samples rather than the percentage. The signal could be detected even if a small amount of CTLs were present. Therefore, we argued that the detection efficiency of the HRGO/pMHC multimer based assay was more sensitive in the case of a low percentage of specific T-cells. When the number of T-cells was low (<5×10³), flow cytometry was unable to detect the PE/pMHC tetramer-labeled specific T-cells. However, there was still a detection signal at 2×10³ of T-cells when AFP158–166-specific T-cells were labeled with HRGO/pMHC multimers. When the number of specific T-cells was extremely high, flow cytometry might show effective detection on the condition that the overall number of T-cells was sufficient.
In this study, to investigate the potency of HRGO/pMHC multimers for detecting hepatocellular carcinoma-specific T-cells in real clinical blood samples, eight cases of hepatocellular carcinoma and two healthy persons were enrolled. The sensitivity of specific T-cell detection with HRGO/pMHC multimers was relatively high, since the absorption peaks of hepatocellular carcinoma-specific T-cells from the eight cases were higher than the control groups (). For the two healthy samples, both the results of flow cytometry and the absorption spectra method showed similar low signals. A false-positive result appeared with neither method, so the specificity of the novel assay was as good as that of flow cytometry.
We selected the AFP158–166 and MAGE-A1278–286 antigenic peptide epitopes as they have high expression in hepatocellular carcinoma patients. Both are highly expressed in the development and progression of hepatocellular carcinoma and the adoptive immunotherapy for hepatocellular carcinoma.Citation32–Citation34 In fact, the selectivity test was performed with not only the CTLs mentioned in the article, but also the CTLs generated by peptide from human hepatitis B core, HIV, human papilloma virus, and melanoma peptides, as well as influenza matrix peptide. The new method may need more detection of antigen peptide-induced CTL before clinical trials. Here, we just selected hepatocellular carcinoma-specific T-cells as a model. For future studies, however, we might select more antigenic peptide epitopes for analysis.
Recently, the technologies of graphene-based nanomaterials and MHC tetramers are promising tools in biomedical applications and for the detection of antigen peptide-specific CD8+ T-cells.Citation35,Citation36 In this study, based on the graphene and tetramer technologies, HRGO/pMHC multimers were shown to selectively and sensitively detect the hepatocellular carcinoma-specific T-cells in a short time frame. This methodology has unique advantages in the field of medical immunology and will be very useful in the study of T-cell–related immune responses.Citation37,Citation38
Acknowledgments
This work is supported by the Medicine and Health Research Foundation of Zhejiang Province (2018KY147, 2016DTB001), National Natural Science Foundation of China (81772664, 81501824), Fund for Integration of Cloud Computing and Big data, Innovation of Science and Education (2017A11036), Traditional Chinese Medicine Scientific Research Foundation of Zhejiang Province (2018ZY001, 2015ZZ001, 2014ZQ005), Natural Science Foundation of Zhejiang Province (LY15C090004, LQ17H160017), and the Health Science and Technology Project of Hangzhou (2018B072), Hangzhou Bureau of Science and Technology (20140633B67).
Supplementary material
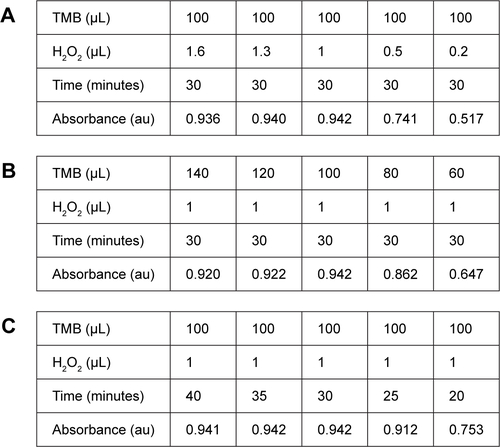
Figure S1 Optimized data for experimental conditions of TMB calorimetric reaction.
Notes: Optimized data of (A) TMB, (B) H2O2, and (C) colorimetric reaction time. For all the experiments, the same volume of HRGO (10 µg/mL) was added. As shown in the figure, the optimal catalytic reaction needed 100 µL TMB substrate, 1 µL H2O2 (500 mM), and incubation for 30 minutes. The value of the absorbance is 0.942 OD.
Abbreviations: HRGO, hemin reduced graphene oxide; TMB, tetramethylbenzidine.
Disclosure
The authors report no conflicts of interest in this work.
References
- BettsMRNasonMCWestSMHIV nonprogressors preferentially maintain highly functional HIV-specific CD8+ T cellsBlood2006107124781478916467198
- BhatMGhaliPDeschenesMWongPPrevention and management of chronic hepatitis BInt J Prev Med20145Suppl 3S200S20726622990
- YangZXuMJiaZA novel antigen delivery system induces strong humoral and CTL immune responsesBiomaterials2017134516328456076
- ZviARotemSZaubermanANovel CTL epitopes identified through a Y. pestis proteome-wide analysis in the search for vaccine candidates against plagueVaccine201735445995600628606812
- LiuQZhengYYuYTanQHuangXIdentification of HLA-A*0201-restricted CD8+ T-cell epitope C64–72 from hepatitis B virus core proteinInt Immunopharmacol201213214114722480777
- MeidenbauerNHoffmannTKDonnenbergADDirect visualization of antigen-specific T cells using peptide–MHC-class I tetrameric complexesMethods200331216017112957574
- ErskineCLHenleAMKnutsonKLDetermining optimal cytotoxic activity of human Her2neu specific CD8 T cells by comparing the Cr51 release assay to the xCELLigence systemJ Vis Exp20126666e3683
- WuCLiuJZhangPA recognition-before-labeling strategy for sensitive detection of lung cancer cells with a quantum dot–aptamer complexAnalyst2015140176100610726200911
- ZhaoXXuLSunMGold–Quantum dot core–satellite assemblies for lighting up microRNA in vitro and in vivoSmall201612344662466826849492
- DoltonGLissinaASkoweraAComparison of peptide–major histocompatibility complex tetramers and dextramers for the identification of antigen-specific T cellsClin Exp Immunol20141771476324673376
- BelokiLCiáurrizMMansillaCThe abrogation of TCR-independent interactions with human serum ensures a selective capture of therapeutic virus-specific CD8+ T-cells by multimer technology in adoptive immunotherapyJ Immunol Methods20133961–216817223933324
- BatardPPetersonDADevêvreEDextramers: new generation of fluorescent MHC class I/peptide multimers for visualization of antigen-specific CD8+ T cellsJ Immunol Methods20063101–213614816516226
- KangBHMinHSLeeYJAnalyses of the TCR repertoire of MHC class II-restricted innate CD4+ T cellsExp Mol Med201547e15425813222
- Abdullah-Al-NahainLeeJEInITarget delivery and cell imaging using hyaluronic acid-functionalized graphene quantum dotsMol Pharm201310103736374424007260
- AmeriSKSinghPKSonkusaleSUtilization of graphene electrode in transparent microwell arrays for high throughput cell trapping and lysisBiosens Bioelectron20146162563024967752
- BatraKNayakSBehuraSKJaniOOptimizing performance parameters of chemically-derived graphene/p-Si heterojunction solar cellJ Nanosci Nanotechnol20151574877488226373050
- CasaluciSGemmiMPellegriniVdi CarloABonaccorsoFGraphene-based large area dye-sensitized solar cell modulesNano-scale20168953685378
- ChenYWLiuTYChenPJChangPHChenSYA High-sensitivity and low-power theranostic nanosystem for cell SERS imaging and selectively photothermal therapy using anti-EGFR-conjugated reduced graphene oxide/mesoporous silica/AuNPs nanosheetsSmall201612111458146826814978
- ChaCShinSRGaoXControlling mechanical properties of cell-laden hydrogels by covalent incorporation of graphene oxideSmall201410351452324127350
- BegumPFugetsuBInduction of cell death by graphene in Arabidopsis thaliana (Columbia ecotype) T87 cell suspensionsJ Hazard Mater20132601032104123892171
- BehuraSKMahalaPNayakSFabrication of bi-layer graphene and theoretical simulation for its possible application in thin film solar cellJ Nanosci Nanotechnol20141443022302724734728
- LingYChenLXDongJXLiNBLuoHQA simple and rapid method for direct determination of Al(III) based on the enhanced resonance Rayleigh scattering of hemin-functionalized graphene-Al(III) systemSpectrochim Acta A Mol Biomol Spectrosc2016156222726641282
- LvXWengJTernary composite of hemin, gold nanoparticles and graphene for highly efficient decomposition of hydrogen peroxideSci Rep20133328524257652
- GuoYDengLLiJHemin-graphene hybrid nanosheets with intrinsic peroxidase-like activity for label-free colorimetric detection of single-nucleotide polymorphismACS Nano2011521282129021218851
- GuCJKongFYChenZDReduced graphene oxide–Hemin–Au nanohybrids: facile one-pot synthesis and enhanced electrocatalytic activity towards the reduction of hydrogen peroxideBiosens Bioelectron20167830030726638039
- ColeDKPumphreyNJBoulterJMHuman TCR-binding affinity is governed by MHC class restrictionJ Immunol200717895727573417442956
- OpreaRPeteuSFSubramanianPPeroxynitrite activity of hemin-functionalized reduced graphene oxideAnalyst2013138154345435223730686
- WeiWZhangDMYinLHPuYPLiuSQColorimetric detection of DNA damage by using hemin–graphene nanocompositesSpectrochim Acta A Mol Biomol Spectrosc201310616316923376271
- Casalegno-GarduñoRSchmittAYaoJMultimer technologies for detection and adoptive transfer of antigen-specific T cellsCancer Immunol Immunother201059219520219847424
- DoltonGTungattKLloydAMore tricks with tetramers: a practical guide to staining T cells with peptide-MHC multimersImmunology20151461112226076649
- ZhouHZhangYYLiuJXuJJChenHYEfficient quenching of electrochemiluminescence from K-doped graphene-CdS:Eu NCs by G-quadruplex-hemin and target recycling-assisted amplification for ultrasensitive DNA biosensingChem Commun (Camb)201349222246224823396566
- LiuHXuYXiangJTargeting alpha-fetoprotein (AFP)–MHC complex with CAR T-cell therapy for liver cancerClin Cancer Res201723247848827535982
- MongkhouneSXieYAWangYQA constructed HLA-A2-restricted pMAGE-A1(278–286) tetramer detects specific cytotoxic T lymphocytes in tumour tissues in situJ Int Med Res20134161811182424071590
- SunLGuoHJiangREngineered cytotoxic T lymphocytes with AFP-specific TCR gene for adoptive immunotherapy in hepatocellular carcinomaTumour Biol201637179980626250457
- WangXCPangHXuXStreptamer versus tetramer-based selection of functional cytomegalovirus-specific T cellsJ Formos Med Assoc2013112633834523787011
- TungattKBianchiVCrowtherMDAntibody stabilization of peptide–MHC multimers reveals functional T cells bearing extremely low-affinity TCRsJ Immunol2015194146347425452566
- ChenHZhangJGaoYSensitive cell apoptosis assay based on caspase-3 activity detection with graphene oxide-assisted electrochemical signal amplificationBiosens Bioelectron20156877778225682507
- ChenLZhouYTuWEnhanced photovoltaic performance of a dye-sensitized solar cell using graphene-TiO2 photoanode prepared by a novel in situ simultaneous reduction-hydrolysis techniqueNanoscale2013583481348523483083