
 ?Mathematical formulae have been encoded as MathML and are displayed in this HTML version using MathJax in order to improve their display. Uncheck the box to turn MathJax off. This feature requires Javascript. Click on a formula to zoom.
Abstract
Background
The development of T1–T2 dual contrast agent (CA) favors the visualization of the lesion in a more accurate and reliable manner by magnetic resonance imaging (MRI). The relaxivity and the interference between T1 and T2 CA are the main concerns for their design.
Methods
In this work, we constructed an Fe3O4@mSiO2/PDDA/BSA-Gd2O3 nanocomplex where BSA-Gd2O3 NPs and Fe3O4 NPs were chosen as T1 and T2 MRI CAs and a 20 nm mesoporous silica (mSiO2) nanoshell was introduced to reduce the interference between them. We performed transmis sion electron microscopy, X-ray powder diffraction, UV-vis absorption spectra, and Fourier transform infrared absorption (FTIR) spectra to characterize the prepared nanocom-plex and MRI scanning to evaluate their MRI behaviors. Furthermore, 3-(4,5-Dimethylthiazol-2-yl)-2,5-diphenyltetrazolium bromide (MTT) assay and hematologic and biochemical analyses were introduced to evaluate their in vitro and in vivo toxicity. Finally, the specific MRI of 786-0 cells with Fe3O4@mSiO2/PDDA/BSA-Gd2O3-AS1411 nanoprobe in vitro was realized. In vivo biodistribution of Fe3O4@mSiO2/PDDA/BSA-Gd2O3 nanocomplex in the mouse was determined by the quantification of the Gd element by inductively coupled plasma-mass spectrometry.
Results
The prepared Fe3O4@mSiO2/PDDA/BSA-Gd2O3 nanocomplex possessed high longitudinal (r1=11.47 mM s−1 Gd) and transverse (r2=195.1 mM s−1 Fe) relaxivities, enabling its use as a T1–T2 dual contrast agent for MRI. MTT testing and hematologic and biochemical analysis indicated the good biocompatibility of Fe3O4@mSiO2/PDDA/BSA-Gd2O3 nanocomplex in vitro and in vivo. After further conjugation with AS1411 aptamer, they could target tumor cells successfully by T1 and T2 MRI in vitro. The possible metabolic pathway of the tail vein-injected Fe3O4@mSiO2/PDDA/BSA-Gd2O3 nanocomplex in mouse was mainly via kidney.
Conclusion
A T1–T2 dual-mode contrast agent, Fe3O4@mSiO2/PDDA/BSA-Gd2O3 nano-complex, was developed and its good performance for tumor cell targeting in vitro and kidney contrast-enhanced MRI in mice indicated its promising potential as an effective T1–T2 dual-mode contrast agent for in vivo MRI with self-confirmation.
Introduction
Among the various biomedical imaging modalities, magnetic resonance imaging (MRI) – which provides high-resolution anatomical images in a noninvasive manner – is one of the most powerful tools.Citation1,Citation2 In 40%–50% cases of clinical application, magnetic resonance (MR) contrast agents (CAs) are introduced to enhance the contrast, presenting improved sensitivity and quality of the images for more accurate diagnosis.Citation3 MRI CAs, generally in the form of T1-positive and T2-negative CAs, greatly improve the sensitivity of MRI by affecting the rate of water proton relaxation. For T1-weighted CAs, paramagnetic complexes containing gadolinium (Gd3+) and manganese (Mn2+) ions are commonly used to effectively accelerate the T1 relaxation process to produce a brighter image.Citation4–Citation9 In contrast, T2-weighted CAs, such as the superparamagnetic iron oxide nanoparticles (SPIOs), exhibit strong magnetization when an external magnetic field is applied. This causes microscopic field inhomogeneity and activates the dephasing of protons to produce decreased signal intensity in T2- and T2*-weighted MR images.Citation10,Citation11 However, each modal CA has its own unique advantages and limitations. For example, the commonly used T1 CAs are relatively small molecules, which are fast excreted by the kidneys, thereby resulting in difficulty with high-resolution image acquisition. Moreover, the functionalization of paramagnetic complexes with targeting molecules is hampered by the arduous and complex modification process.Citation12–Citation14 On the other hand, SPIOs as T2 MR CAs are very useful for biomedical applications because they are not subject to strong magnetic interactions in dispersion and are readily stabilized under physiological conditions.Citation15 However, the biggest issue with using T2 CAs is that it is difficult to distinguish the signal from an air bubble or image artifact. Due to the negative contrast effect and susceptibility artifacts, it is difficult to distinguish the region of signals induced by SPIOs from low-level background MR signals, such as signals arising from adjacent tissues, bone, or vasculature.Citation11 Furthermore, independent T1 or T2 MR imaging suffers from false-positive signals that are ubiquitously observed in tissues. Last but not the least, T1–T2 dual imaging displays obvious advantages over single imaging with regard to water and fat molecules in tissue. For example, some tissue components such as the bone and fiber components present low signals on T1WI similar to water. Moreover, some tissue components such as bleeding and mucus present high signals on the T1WI similar to fat. It is difficult to distinguish water and fat with single imaging. However, with T1–T2 dual imaging, these issues can be addressed. Water presents a low signal on T1WI and a high signal on T2WI. Fat presents a high signal on both T1WI and T2WI. Thus, it is easy to recognize water and fat with dual imaging. Therefore, the development of T1–T2 dual CAs is emerging attractively because they have the ability to validate reconstruction and visualization of the data in a more accurate and reliable manner, and to acquire complementary and self-confirmed information to permit meaningful interpretation.Citation16 Several kinds of dual CAs have been reported to improve the diagnostic accuracy of diseases.Citation17–Citation24 Choi et al developed a nanoparticle (NP)-based dual CA – MnFe2O4@SiO2@Gd2O(CO3)2 – which not only possessed superior MR contrast effects, but also had the unique capability of displaying “AND” logic signals in both T1 and T2 modes.Citation22 Bae et al synthesized Gd-labeled Fe3O4 NPs and demonstrated their capability as dual CAs for T1- and T2-weighted MRI.Citation21
Table S1 T1 and T2 relaxation time of the Fe3O4@mSiO2/PDDA/BSA-Gd2O3 nanocomplex prepared with different concentrations of Fe3O4 nanoparticles (n=4)
Table S2 T1 and T2 relaxation time of the mSiO2/PDDA/BSA-Gd2O3 nanocomplex, Fe3O4@mSiO2/PDDA/BSA-Gd2O3 nanocomplex and Fe3O4@mSiO2 nanocomplex (n=4)
Table S3 T1 relaxation time of NIH-3T3 mouse fibroblast cells and 786-0 renal carcinoma cells treated with 1 mg mL−1 Fe3O4@mSiO2/PDDA/BSA-Gd2O3 nanocomplex (−) and Fe3O4@mSiO2/PDDA/BSA-Gd2O3-AS1411 nanoprobe (+) (n=4)
Table S4 T2 relaxation time of NIH-3T3 mouse fibroblast cells and 786-0 renal carcinoma cells treated with 1 mg mL−1 Fe3O4@mSiO2/PDDA/BSA-Gd2O3 nanocomplex (−) and Fe3O4@mSiO2/PDDA/BSA-Gd2O3-AS1411 nanoprobe (+) (n=4)
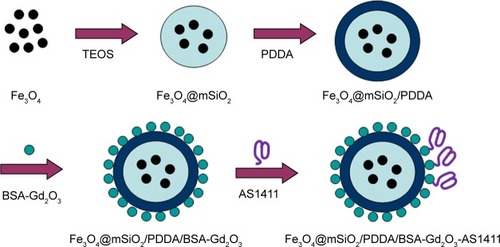
For the design of T1–T2 dual CAs, two main aspects should be concerned. Firstly, to obtain high sensitivity, the T1 and T2 CAs themselves should possess good MRI relaxivities. High relaxivity is the primary requisite for the development of molecular imaging MR probes and targeting probes.Citation25–Citation27 Several strategies for increasing the sensitivity (relaxivity) of MRI CAs have been well reviewed.Citation28–Citation30 Secondly, the undesirable T1 signal quenching of the paramagnetic T1 CA by the magnetic field generated by a superparamagnetic T2 CA when they are in proximity should be avoided. To address these issues, in this study, we aimed to synthesize the Fe3O4@mSiO2/PDDA/BSA-Gd2O3 nanocomplex () and explore its potential as a T1–T2 dual CA to obtain better MRI contrast enhancement and specific tumor cell targeting. BSA-Gd2O3 NPs and Fe3O4 NPs were chosen as T1 and T2 MRI CAs. High-Gd density paramagnetic ultrasmall gadolinium oxide nanoparticles (Gd2O3 NPs) have emerged to present larger T1 relaxivity, good biocompatibility, and easy conjugation with other biomolecules or imaging agents for molecular MRI (mMRI) and multimodal molecular imaging.Citation18,Citation31,Citation32 The mesoporous silica nanoshell was introduced to coat Fe3O4 NPs and load BSA-Gd2O3 NPs as well as to act as a spacer to minimize the magnetic spin interactions between T1 and T2 CAs. It has been proved that the magnetic field generated by a superparamagnetic T2 CA could perturb the electronic spins of paramagnetic T1 CA when they are in close proximity (<12 nm).Citation22 Furthermore, to realize the specific tumor cell imaging, an AS1411 aptamer, which can selectively bind with nucleolin overexpressed on a variety of cancer cells, was employed as the tar geting molecule for the fabrication of the mMRI nanoprobe – Fe3O4@mSiO2/PDDA/BSA-Gd2O3-AS1411.Citation33–Citation35 Its ability for the specific targeting of renal cell carcinoma (RCC) was confirmed by the T1–T2-weighted MRI.
Materials and methods
Materials and reagents
Bovine serum albumin (BSA) was obtained from Solarbio (Beijing, People’s Republic of China). Gd(NO3)3·6H2O, hexadecyl trimethyl ammonium bromide (CTAB), and dimethyl sulfoxide (DMSO) were purchased from Sinopharm Chemical Reagent Co. Ltd., Beijing, People’s Republic of China Tetraeth-ylorthosilicate (TEOS), poly(dimethyl diallyl ammonium chloride) (PDDA), 1-ethyl-3-(3-dimethylaminopropyl) carbodiimide hydrochloride (EDC·HCl), and N-hydroxysuccinimide (NHS) were purchased from Sigma-Aldrich (Saint Louis, MO, USA). DNA oligos were synthesized and purified by Shanghai Sangon Biotechnology Co. Ltd. (Shanghai, People’s Republic of China); 3-(4,5-Dimethylthiazol-2-yl)-2,5-diphenyltetrazolium bromide (MTT) was obtained from Sunshine Biotech. Co. Ltd. (Nanjing, People’s Republic of China). Cell culture media including HDMEM, RPMI 1640, and fetal calf serum were obtained from Kangmei Biotechnology Co. Ltd (Xuzhou, People’s Republic of China). All other reagents were of analytical grade and used without purification. All aqueous solutions were prepared using ultrapure water from a Milli-Q system (Millipore, Boston, MA, USA). The DNA sequence is listed as follows.
COOH-AS1411:
5′-COOH-GGTGGTGGTGGTTGTGGTGGTGGTGG-3′.
Apparatus and characterization
The size and morphology of NPs were observed by transmission electron microscopy (TEM; TECNAI G2, FEI Company, Hillsboro, OR, USA). Fourier transform infrared absorption (FTIR) spectra were obtained through FTIR spectroscopy (Bruker, Billerica, MA, USA). Zeta potentials were determined by Nano ZS90 (Malvern Panalytical Ltd, Malvern, England). X-ray powder diffraction (XRD) patterns were obtained by using a X-ray powder diffractometer (D8 ADVANCE, Bruker). The determinations of Gd and iron ion concentrations were undertaken with inductively coupled plasma-mass spectrometry (ICP-MS) (Optima 5300DV, PerkinElmer, San Diego, CA, USA). The absorbances for MTT assay were determined by a microplate reader (Multiskan MK3, Thermo Fisher Scientific, Waltham, MA, USA) at 490 nm. MRI scanning was conducted on a Signa HDxt 3.0T, General Electric Company, Boston, Massachusetts, USA. Hematologic and biochemical analysis was carried out with a hematology analyzer (Mindray BC-5390, Mindray Bio-Medical Electronics Co., Ltd., Shenzhen, People’s Republic of China) and cobas connection modules (Roche Diagnostics, Basel, Switzerland), respectively.
Cells and cell culture conditions
The 786-0 renal carcinoma cells and NIH-3T3 mouse fibroblast cells were purchased from the Cell Bank of the Chinese Academy of Sciences (Shanghai, People’s Republic of China). The 786-0 renal carcinoma cells were cultured in a 10% FBS-containing RPMI 1640 medium (Sijiqing, People’s Republic of China) supplemented with penicillin (100 mg/mL) and streptomycin (100 mg/mL). NIH-3T3 cells were propagated in 10% FBS-containing Dulbecco’s Modified Eagle’s Medium (Gibco, Grand Island, NY, USA) supplemented with penicillin (100 mg/mL) and streptomycin (100 mg/mL). All cells were grown in a humidified incubator (Thermo Fisher Scientific) at 37°C under 5% CO2 atmosphere.
Preparation of Fe3O4 NPs
The Fe3O4 NPs were synthesized using a previously reported method.Citation36 In brief, approximately 10 mL water containing 1.0 mol/L Fe3+ and 0.5 mol/L Fe2+ ions (molar ratio 2:1) was stirred at 400 rpm on a stir plate for 20 min. Then, 30 mL ammonium hydroxide was slowly added to the solution and the speed was increased to 900 rpm in order to uniformly precipitate magnetic NPs. Fe3O4 NPs were obtained 30 min later. They were washed with distilled water until the pH value decreased to 7.0. Finally, the obtained Fe3O4 NPs were dispersed in distilled water at a concentration of 0.24 mg/mL until further use.
Synthesis of Fe3O4@mSiO2 core-shell NPs
In a typical procedure,Citation37 CTAB (50 mg) was dissolved in 20.8 mL distilled water. In total, 4.2 mL Fe3O4 and NaOH solution (2.00 M, 160 µL) were added to the above CTAB solution sequentially. Then, the mixture was heated to 70°C with stirring, and 250 µL TEOS and 500 µL ethylacetate were added to the reaction solution in sequence. The mixture was stirred for 3 h at 70°C. The resultant precipitate was washed 3 times with ethanol to remove the unreacted species and then dispersed in 20 mL ethanol. To extract CTAB, 20 µL HCl was added to the dispersion mixture (pH>1.0) and stirred for 3 h at 60°C. To obtain hollow mesoporous silica, more HCl was used for extraction (pH <1.0). After washing three times with ethanol, the Fe3O4@mSiO2 NPs were dried at 50°C.
Preparation of BSA-Gd2O3 NPs
BSA-Gd2O3 NPs were synthesized according to the methods specified in the literature with some modifications.Citation38 In total, 0.25 g BSA was dissolved in 9 mL distilled water. Then, 1 mL 50 mM Gd(NO3)3 was added to the above solution slowly under vigorous stirring. After the introduction of 1 mL 2 M NaOH 5 min later, the mixture was allowed to react under vigorous stirring at 37°C for 12 h. Finally, the BSA-Gd2O3 thus prepared was dialyzed against distilled water (1:1,000, v/v) to remove excess precursors.
Fabrication of Fe3O4@mSiO2/PDDA/BSA-Gd2O3-AS1411 mMRI nanoprobe
The Fe3O4@mSiO2/PDDA/BSA-Gd2O3 was prepared through electrostatic interaction.Citation39 Initially, Fe3O4@mSiO2 (3 mg) and PDDA solution (2 mL, 2 mg/mL, 0.2 M NaCl) were mixed under sonication for 40 min, and the excess polyelectrolyte was removed by washing with water. Then, the positively charged magnetic particles were dispersed in distilled water (500 µL), and BSA-Gd2O3 (50 µL, 1.06 µM Gd) was added and sonicated for 40 min. After washing with water, the Fe3O4@mSiO2/PDDA/BSA-Gd2O3 were dispersed in 2 mL water for MRI scanning. Meanwhile, to obtain the best MRI behavior, different concentrations of BSA-Gd2O3 NPs (0.212, 0.636, 1.06, 1.484, and 1.908 µM Gd) and Fe3O4 (1, 3, and 5 mg) were tested. At the optimized condition, the AS1411 aptamer was functionalized onto the surface of Fe3O4@mSiO2/PDDA/BSA-Gd2O3 NPs by covalent coupling between the amino group of BSA-Gd2O3 and the carboxyl group modified at the 5′ end of AS1411 aptamer with the help of EDC and NHS.Citation40 Briefly, 100 µM COOH-AS1411 (50 µL) was mixed with EDC (100 µL, 10 mg mL−1) in 300 µL PBS (10 mM, pH 7.4) and incubated at 37°C for 15 min to form an active carboxyl group. Then, NHS (100 µL, 10 mg mL−1) and Fe3O4@mSiO2/PDDA/BSA-Gd2O3 (500 µL, 5.0 mg mL Citation1) were added to the mixture and reacted at 37°C for 2 h. The unreacted biomolecules were removed by two centrifugation/washing cycles. Finally, the Fe3O4@mSiO2/PDDA/BSA-Gd2O3-AS1411 nanoprobes were dispersed in 1 mL PBS (10 mM) at pH 7.4 for further use.
Relaxivity calculation of Fe3O4 NPs, BSA-Gd2O3 NPs, Gd-DTPA, and Fe3O4@mSiO2/PDDA/BSA-Gd2O3 nanocomplex
The MRI behavior test of BSA-Gd2O3 and Fe3O4 was conducted with a 3.0 T human MR scanner (General Electric Company). Various concentrations of BSA-Gd2O3 and Fe3O4 solution were prepared before MRI scanning, which varied from 0.212 to 1.908 µM with a volume of 600 µL for BSA-Gd2O3 NPs, and 1–5 mg for Fe3O4 NPs. The following parameters were adopted in data acquisition. 1) T1-weighted images: echo time (TE)=16.5 ms, repetition time (TR)=420 ms, field of view (FOV)=14×14 cm, matrix=384×256, slice thickness=2.0 mm, spacing=0.2 mm; and 2) T2-weighted images: echo time (TE)=90.7 ms, repetition time (TR)=4,500 ms, field of view (FOV)=14×14 cm, matrix=384×256, slice thickness=2.0 mm, spacing=0.2 mm. Quantitative T1 and T2 relaxation maps were reconstructed from datasets using function software at a workstation (ADW 4.2). The signal intensities of the samples were measured, and the T1 and T2 values were calculated accordingly. MRI scanning of Gd-DTPA and the Fe3O4@mSiO2/PDDA/BSA-Gd2O3 nanocomplex with different concentrations was carried out in the same way.
The T1 relaxivity values of the BSA-Gd2O3, Gd-DTPA, and Fe3O4@mSiO2/PDDA/BSA-Gd2O3 nanocomplex were determined by measuring longitudinal proton relaxation time (T1) as a function of Gd concentration. The T2 relaxivity values of the Fe3O4 and Fe3O4@mSiO2/PDDA/BSA-Gd2O3 nanocomplex were determined by measuring the lateral proton relaxation time (T2) as a function of Fe concentration.
MTT assay
The 786-0 cells and NIH-3T3 cells were cultured on 96-well plates at a density of 104 cells each well. After 24-h incubation, the medium was substituted with 100 µL fresh medium containing different concentrations of the Fe3O4@mSiO2/PDDA/BSA-Gd2O3 nanocomplex (0, 200, 400, 600, 800, 1,000, 1,200, and 1,400 µg mL−1). After 24-h incubation, the medium was removed, and fresh medium (100 µL) containing MTT (20 µL, 5 mg mL−1) was added into each well. Four hours later, the culture medium was carefully removed and washed, and 100 mL DMSO was added to each well to dissolve the formazan crystals for 10 min. The absorbance at 490 nm was measured by a microplate reader (Multiskon MK3, USA).
Stability test
The Fe3O4@mSiO2/PDDA/BSA-Gd2O3 nanocomplex was dispersed in RPMI 1640 culture medium. At different time points (0, 2, 4, 6, 8, 12, 24, 48, and 72 h), 100 µL samples were collected and centrifuged at 25,000 rpm for 30 min to obtain the supernatant. The concentrations of Fe and Gd ions in the supernatant were determined by ICP-MS. For the pH stability test, the Fe3O4@mSiO2/PDDA/BSA-Gd2O3 nanocomplex was dispersed in solutions of different pHs (pH 4, 5, 6, 7, 8, 9, and 10) and incubated for 24 h. The concentrations determined for Fe and Gd ions were the same as mentioned earlier.
Specific MR imaging of 786-0 cells with Fe3O4@mSiO2/PDDA/BSA-Gd2O3-AS1411 mMRI nanoprobe in vitro
The 786-0 cells and NIH-3T3 cells were seeded into six-well plates at a density of 105 cells/well and cultured for 24 h in a humidified incubator at 37°C under 5% CO2 atmosphere, respectively. Then, the culture media was removed and the cells were washed with PBS twice. In total, 500 µL of different concentrations of Fe3O4@mSiO2/PDDA/BSA-Gd2O3-AS1411 nanoprobe (0.5, 1, and 2.5 mg mL−1) and Fe3O4@mSiO2/PDDA/BSA-Gd2O3 nanocomplex (0.5, 1, and 2.5 mg mL−1) were added into the well and incubated for 1 h at 37°C. After discarding the nanoprobe, the cells were washed and lysed by trypsin. The harvested cells were fixed with 600 µL 1% agarose for MRI scanning. The untreated cells that were incubated with PBS were taken as the control.
Biodistribution of the Fe3O4@mSiO2/PDDA/BSA-Gd2O3 nanocomplex in the mouse
The residual nanocomplex in heart, liver, kidneys, and lungs after 1 h and 24 h post-injection of the Fe3O4@mSiO2/PDDA/BSA-Gd2O3 nanocomplex was determined by the quantification of the Gd element by ICP-MS. Briefly, six Kunming mice were divided into two groups: 1-h post-injection and 24-h post-injection. Each mouse was injected with the same concentration of the Fe3O4@mSiO2/PDDA/BSA-Gd2O3 nanocomplex (0.16 mmol Gd per kg body weight). The mice were sacrificed and the major organs, including heart, liver, kidneys, and lungs, were collected at 1 h and 24 h post-injection. To these organs, 2 mL aqua regia (HCl:HNO3=3:1) was added and the organs in aqua regia were heated to 200°C for 1 h. After being cooled to room temperature, 2 mL H2O was added and a 0.22-µm filter was introduced to remove undigested tissues.Citation41 The Gd concentrations were then analyzed by ICP-MS.
In vivo toxicity evaluation of Fe3O4@mSiO2/PDDA/BSA-Gd2O3 nanocomplex
Hematologic and biochemical analyses were introduced to evaluate the in vivo toxicity of the Fe3O4@mSiO2/PDDA/BSA-Gd2O3 nanocomplex. In total, six Kunming mice were divided into two groups: the normal saline group and the Fe3O4@mSiO2/PDDA/BSA-Gd2O3 nanocomplex group. The mice were injected with normal saline and the Fe3O4@mSiO2/PDDA/BSA-Gd2O3 nanocomplex (0.16 mmol Gd per kg body weight) via tail vein, respectively. After 1 week, blood was harvested by cardiac puncture. Hematologic analysis including platelets (PLT), hematocrit (HCT), hemoglobin (HGB), red blood cells (RBC), white blood cells (WBC), mean corpuscular volume (MCV), mean corpuscular hemoglobin (MCH), and mean corpuscular hemoglobin concentration (MCHC) was undertaken on a hematology analyzer. The biochemical effects of the Fe3O4@mSiO2/PDDA/BSA-Gd2O3 nanocomplex for alanine transaminase (ALT), aspartate transaminase (AST), blood urea nitrogen (BUN), creatinine (CREA), total protein (TP), albumin (ALB), and total biliru-bin (TBIL) were evaluated by cobas connection modules.
In vivo MRI
Animal experiments were conducted in accordance with the National Institutes of Health guidelines on the use of animals in research, and were approved by the Animal Care Committee of Xuzhou Medical University. Healthy BALB/c mice weighing 20–30 g were chosen for in vivo MRI study. The mice were anesthetized by intraperitoneal injection of 2% mebumalnatrium (4 µL/g bodyweight), followed by tail-vein administration of the Fe3O4@mSiO2/PDDA/BSA-Gd2O3 nanocomplex (0.16 mmol Gd per kg body weight). Then, at scheduled intervals, T1WI images and T2WI images were acquired by a 3.0 T MR imaging system (GE Discovery 750W, USA) with the animal T/R coil (Magtron Inc., Jiangyin, People’s Republic of China). The sequences for T1-weighted images were set as follows: TE=12 ms; TR=400 ms; FOV=80×80 mm; slice thickness=2 mm; spacing=0.2 mm; and matrix=256×256. The sequences for T2-weighted images were set as follows: TE=58 ms; TR=300 ms; FOV=80×48 mm; slice thickness=2 mm; spacing=0.2 mm; and matrix=256×256. To compare the signal intensity at different time points, the same protocols, prone position, and the same scanning landmark of MRI were required. The relative intensity changes of the same region of interest on the same slice in the same window width and window level were recorded by software in the workstation GE AW4.6.
Results
Characterization of Fe3O4@mSiO2/PDDA/BSA-Gd2O3-AS1411 mMRI nanoprobe
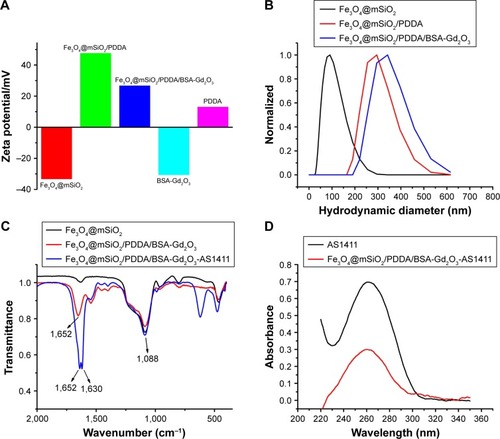
For the fabrication of the T1–T2 dual CA, 10.7-nm-sized-Fe3O4 NPs as T2 CA were first encased with an mSiO2 nanoshell (). An approximately 20-nm nanoshell could reduce the quenching effect of Fe3O4 NPs on the T1 signal to the extent that was possible. Then, BSA-Gd2O3 NPs were deposited onto the Fe3O4@mSiO2 surface through layer-by-layer assembly with the help of polyelectrolytes and PDDA. Driven by the electrostatic force, a uniform monolayer of positively charged PDDA and negatively charged BSA-Gd2O3 NPs were alternatively adsorbed onto the negatively charged Fe3O4@mSiO2 NPs. This assembly process was monitored by the determination of the changes of zeta potentials. As shown in , the potential value of Fe3O4@mSiO2 NPs was −33.5 mV and changed to 47.8 mV with PDDA assembly. The zeta potential of the Fe3O4@mSiO2/PDDA/BSA-Gd2O3 nanocomplex was 26.9 mV, which might derive from the negatively charged BSA. The corresponding hydrodynamic diameters of Fe3O4@mSiO2, Fe3O4@mSiO2/PDDA and Fe3O4@mSiO2/PDDA/BSA-Gd2O3 were changed from 100.2 to 297.4 and 345.6 nm, accordingly (). From XRD patterns in , the typical diffraction peaks of Fe3O4 were observed. The amorphous hump of SiO2 at around 26° and the characteristic peaks of Fe3O4 could be observed in Fe3O4@mSiO2 and Fe3O4@mSiO2/PDDA/BSA-Gd2O3, indicating the successful fabrication of the nanocomplex.Citation42 Then, the further conjugation of the AS1411 aptamer with the Fe3O4@mSiO2/PDDA/BSA-Gd2O3 nanocomplex through a covalent coupling reaction was confirmed by the FTIR absorption spectrum and UV-vis absorption spectrum. The emerging absorption peak at 1,630 and 1,652 cm−1 was ascribed to acyl-amide vibration in the FTIR absorption spectrum (), and a characteristic UV-vis absorbance peak of the AS1411 aptamer could be observed in the Fe3O4@mSiO2/PDDA/BSA-Gd2O3-AS1411 nanoprobe (), both indicating the successful preparation of the mMRI nanoprobe.
Figure 1 Characterization of the assembly process of Fe3O4@mSiO2/PDDA/BSA-Gd2O3 with zeta potential (A), hydrodynamic diameter determination (B), and the fabrication of the Fe3O4@mSiO2/PDDA/BSA-Gd2O3-AS1411 nanoprobe with fourier transform infrared absorption (FTIR) spectra (C) and UV-vis spectra (D).
MRI behavior of Fe3O4@mSiO2/PDDA/BSA-Gd2O3 nanocomplex
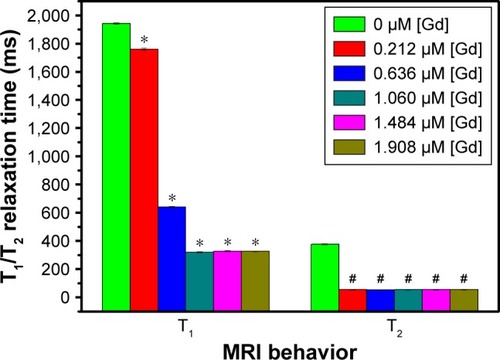
To explore its potential as an mMRI nanoprobe, the MRI behavior of our synthesized Fe3O4@mSiO2/PDDA/BSA-Gd2O3 nanocomplex was first evaluated. With different concentrations of BSA-Gd2O3 NPs, the T1 and T2 relaxation times of the Fe3O4@mSiO2/PDDA/BSA-Gd2O3 nanocomplex varied. As shown in and , with the increase of the BSA-Gd2O3 NP concentration, the T1 relaxation time of the Fe3O4@mSiO2/PDDA/BSA-Gd2O3 nanocomplex was enhanced and reached a maximum of approximately 320 ms in the presence of 1.06 µM Gd. However, the further increased concentration of BSA-Gd2O3 NPs (1.484 and 1.908 µM Gd) influenced the T1 relaxation time of the Fe3O4@mSiO2/PDDA/BSA-Gd2O3 nanocomplex non-obviously. Unlike the T1 relaxation time, the T2 relaxation time of Fe3O4@mSiO2/PDDA/BSA-Gd2O3 nanocomplex changed irregularly with the increase in the concentration of BSA-Gd2O3 NP. However, when the BSA-Gd2O3 NP concentration was 1.06 µM Gd, the T2-map color image was darkest. The influence of Fe3O4 concentrations on the T1 and T2 relaxation times were not as strong as that of BSA-Gd2O3 NPs. As shown in and , with the increase of the Fe3O4 concentration, the T1 relaxation time of the Fe3O4@mSiO2/PDDA/BSA-Gd2O3 nanocomplex was weakened; however, its T2 relaxation time changed little. For overall consideration, 50 µL 1.06 µM BSA-Gd2O3 and 1 mg Fe3O4 NPs were chosen for the fabrication of the Fe3O4@mSiO2/PDDA/BSA-Gd2O3 nanocomplex in the following experiments.
Figure 2 T1-weighted magnetic resonance (MR) images and T1-map images as well as T2-weighted MR images and T2-map images of the Fe3O4@mSiO2/PDDA/BSA-Gd2O3 nanocomplex prepared with different concentrations of BSA-Gd2O3 NPs. 3.0 T human magnetic resonance scanner was used.
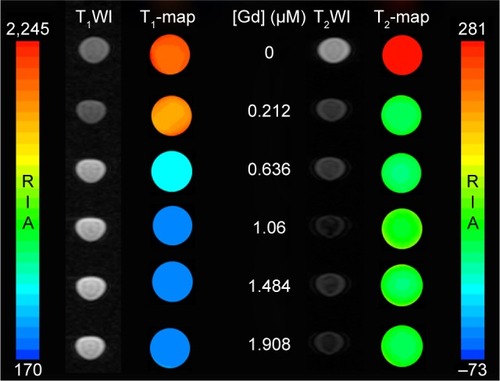
Figure 3 T1 and T2 relaxation time of the Fe3O4@mSiO2/PDDA/BSA-Gd2O3 nanocomplex prepared with different concentrations of BSA-Gd2O3 NPs. BSA-Gd2O3 NPs (0 µM) were treated as the control group, and other groups were all compared with the control group with one-way ANOVA. *Refers to statistically significant differences compared with the control group with one-way ANOVA (p<0.05). #Refers to statistically significant differences compared with control group with one-way ANOVA (p<0.05). A 3.0 T human magnetic resonance scanner was used.
To testify the influence of BSA-Gd2O3 NPs of our nano-complex on T2WI, we also synthesized the Fe3O4@mSiO2 nanocomplex and the mSiO2/PDDA/BSA-Gd2O3 nanocom-plex. As shown in and , the T2 signals of the Fe3O4@mSiO2/PDDA/BSA-Gd2O3 nanocomplex and the Fe3O4@mSiO2 nanocomplex were all less than the T2 signal of the mSiO2/PDDA/BSA-Gd2O3 nanocomplex; however, there was little change between the T2 signal of the Fe3O4@mSiO2/PDDA/BSA-Gd2O3 nanocomplex and the T2 signal of the Fe3O4@mSiO2 nanocomplex. Thus, in our prepared nanocomplex, the BSA-Gd2O3 NPs had no obvious effect on T2WI, and Fe3O4 NPs influenced the T2 signal obviously. From the above results, we can conclude that, for the synthesis of T1–T2 dual MRI CA Fe3O4@mSiO2/PDDA/BSA-Gd2O3, T1 and T2 signals are ascribed to the BSA-Gd2O3 NPs and Fe3O4 core, respectively.
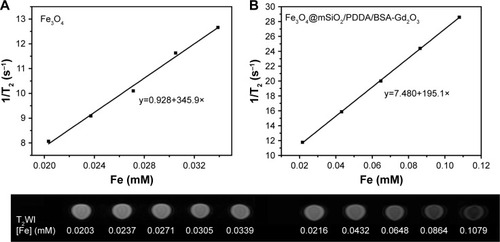
Then, the T1 relaxivity values of Gd-DTPA, BSA-Gd2O3 NPs, and the Fe3O4@mSiO2/PDDA/BSA-Gd2O3 nanocomplex were determined and compared by measuring longitudinal proton relaxation time (T1) as a function of Gd concentration. As shown in , the r1 value of BSA-Gd2O3 was 12.2 s−1 mM−1, which was three times that of the commercial MRI CAs, Gd–DTPA (r1=4.3 s−1 mM−1). The T1 relaxivity of Fe3O4@mSiO2/PDDA/BSA-Gd2O3 nanocomplex was 11.5 s−1 mM−1. For the determination of the T2 relaxivity values of Fe3O4 and the Fe3O4@mSiO2/PDDA/BSA-Gd2O3 nanocomplex, lateral proton relaxation times (T2) as a function of Fe concentration were measured. The T2 relaxivity of the Fe3O4@mSiO2/PDDA/BSA-Gd2O3 (195.1 s−1 mM− Fe) was lower than that of Fe3O4 (345.9 s−1 mM−1 Fe), but higher than the clinically used Feridex (108 s−1 mM−1 Fe)Citation1 and the relaxivity reported for Fe3O4 @mSiO2NPs (171.6 s−1 mM−1 Fe; ).Citation43,Citation44 Such excellent MR imaging behavior indicated the ability of the Fe3O4@mSiO2/PDDA/BSA-Gd2O3 nano-complex (the molar value of Fe/Gd equals 0.539; r1/r2 equals 0.0567) as a promising T1–T2 dual MRI CA for the fabrication of an mMRI nanoprobe to specifically image tumor cells.
Figure 4 T1 relaxivity curves (A) and T1-weighted magnetic resonance (MR) images (B) of Gd-DTPA (1), BSA-Gd2O3 NPs (2), and Fe3O4@mSiO2/PDDA/BSA-Gd2O3 nanocomplex (3) with various Gd concentrations. A 3.0 T human MR scanner was used.
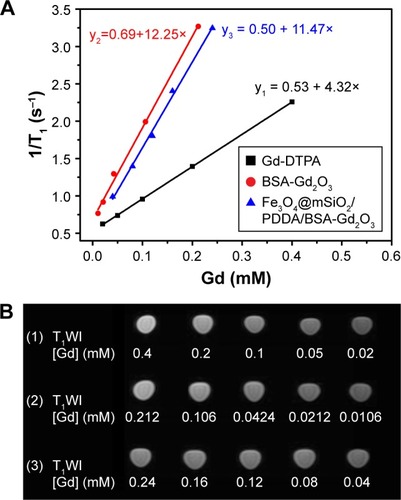
Figure 5 T2 relaxivity curves and T2-weighted magnetic resonance (MR) images of the Fe3O4 (A), and Fe3O4@mSiO2/PDDA/BSA-Gd2O3 nanocomplex (B) with various Fe3O4 nanoparticle concentrations. A 3.0 T human MR scanner was used.
In vitro cytotoxicity test
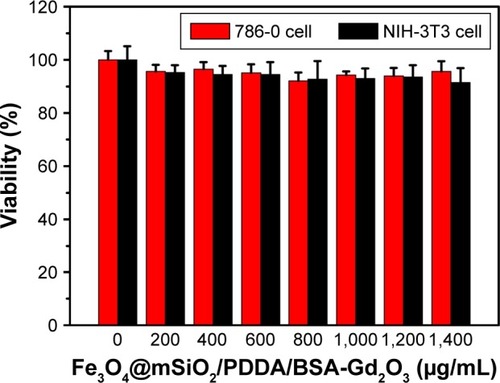
Before the use of the Fe3O4@mSiO2/PDDA/BSA-Gd2O3 nanocomplex for specific tumor cell imaging, it is vital to assess its safety in vitro. The MTT assay was conducted to evaluate the cell toxicity of the nanocomplex and identify potentially safe concentrations for the following targeting experiments. The Fe3O4@mSiO2/PDDA/BSA-Gd2O3 nano-complex with eight different concentrations, ranging from 0 to 1,400 µg/mL, was incubated with 786-0 and NIH-3T3 cells for 24 h, respectively. As shown in , the Fe3O4@mSiO2/PDDA/BSA-Gd2O3 nanocomplex displayed good bio-compatibility, and no significant cytotoxicity was observed both on 786-0 renal carcinoma or NIH-3T3 cells.
Figure 6 Cell viability of 786-0 renal carcinoma cells and NIH-3T3 mouse fibroblast cells after exposure to various concentrations of the Fe3O4@mSiO2/PDDA/BSA-Gd2O3 nanocomplex, determined by 3-(4,5-Dimethylthiazol-2-yl)-2,5-diphenyltetrazolium bromide (MTT) assay.
Stability test
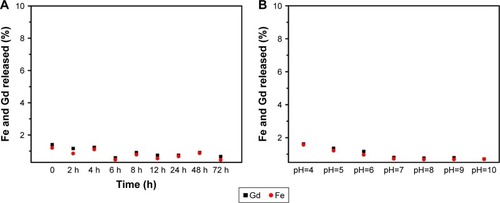
The leaching of metallic ions is a potential harmful effect of their biological application. To test the possibility of Gd and Fe ions leaching from the nanocomplex in biological media, we determined the concentrations of Gd and Fe ions in the supernatant with the passage of time from when the nanocomplex was dispersed in the cell culture medium and in different pH solutions incubated for 24 h. As shown in , no obvious Gd and Fe ion leaching could be observed with time in the cell culture medium or different pH solutions, indicating the good stability of our fabricated nanocomplex.
Figure 7 Iron and gadolinium ions released from the Fe3O4@mSiO2/PDDA/BSA-Gd2O3 nanocomplex in cell culture medium over time (A) and in different pH solutions incubated for 24 h (B).
In vitro specific T1–T2 dual MR imaging of tumor cells
Finally, the specific cellular targeting of the Fe3O4@mSiO2/PDDA/BSA-Gd2O3-AS1411 mMRI nanoprobe was evaluated by T1–T2 MRI. AS1411 is a nucleolus of specific nucleic acid aptamers, which can specifically combine with nucleolin on the surface of the tumor cell. As shown in , the AS1411 modification did not produce a significant influence on the MRI behavior of the Fe3O4@mSiO2/PDDA/BSA-Gd2O3 nanocomplex, indicating the potential use of the Fe3O4@mSiO2/PDDA/BSA-Gd2O3-AS1411 as an mMRI nanoprobe.
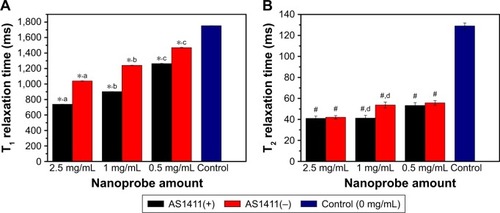
To validate the specific targeting ability of the Fe3O4@mSiO2/PDDA/BSA-Gd2O3-AS1411 mMRI nanoprobe, the 786-0 cells were incubated with the Fe3O4@mSiO2/PDDA/BSA-Gd2O3 nanocomplex and Fe3O4@mSiO2/PDDA/BSA-Gd2O3-AS1411 mMRI nanoprobes, respectively. For the achievement of the best signal-to-noise value, 0.5, 1, and 2.5 mg mL−1 nanoprobes were introduced and compared. As shown in and , the higher the concentration of the Fe3O4@mSiO2/PDDA/BSA-Gd2O3-AS1411 nanoprobe, the brighter the T1 signal intensity and the darker the T2 signal intensity from 786-0 cells. Furthermore, the presence of the AS1411 aptamer could facilitate more of the Fe3O4@mSiO2/PDDA/BSA-Gd2O3-AS1411 nanoprobe to bind with 786-0 cells and present a brighter T1 signal and a darker T2 signal at all three concentrations. However, when the concentration of the nanoprobe reached 2.5 mg mL−1, the nonspecific adsorption obviously increased. Thus, 1 mg mL−1 of the Fe3O4@mSiO2/PDDA/BSA-Gd2O3-AS1411 nanoprobe was chosen for the specific MRI finally. To further confirm such AS1411 aptamer-based specific targeting, NIH-3T3 cells were introduced as the control and treated with 1 mg of the mL−1 Fe3O4@mSiO2/PDDA/BSA-Gd2O3-AS1411 nano-probe, Fe3O4@mSiO2/PDDA/BSA-Gd2O3 nanocomplex, respectively. No significant difference existed between these two groups in both T1 and T2 signal, indicating the specific MRI ability of our synthesized nanoprobe to ccRCC in vitro (, and ).
Figure 8 T1-weighted magnetic resonance (MR) images and T1-map images (A) as well as T2-weighted MR images and T2-map images (B) of 786-0 renal carcinoma cells treated with different concentrations of the Fe3O4@mSiO2/PDDA/BSA-Gd2O3 nanocomplex (−) and Fe3O4@mSiO2/PDDA/BSA-Gd2O3-AS1411 nanoprobe (+) (0, 0.5, 1, 2.5 mg/mL−1). A 3.0 T human MR scanner was used.
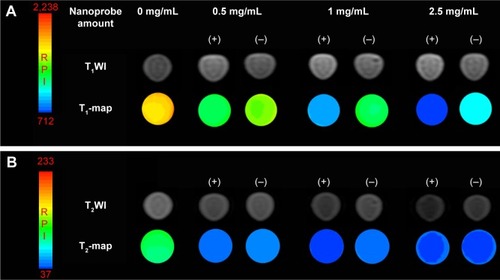
Figure 9 T1 (A) and T2 relaxation time (B) of 786-0 renal carcinoma cells treated with different concentrations of the Fe3O4@mSiO2/PDDA/BSA-Gd2O3 nanocomplex (−) and Fe3O4@mSiO2/PDDA/BSA-Gd2O3-AS1411 nanoprobe (+).
Notes: *Refers to statistically significant differences compared with the control group using one-way ANOVA (p<0.05). #Refers to statistically significant differences compared with the control group with one-way ANOVA (p<0.05). aRefers to statistically significant differences within group with LSD Duncan (p<0.05). bRefers to statistically significant differences within group with LSD Duncan (p<0.05). cRefers to statistically significant differences within group with LSD Duncan (p<0.05). dRefers to statistically significant differences within group with LSD Duncan (p<0.05). A 3.0 T human magnetic resonance scanner was used.
Biodistribution of the Fe3O4@mSiO2/PDDA/BSA-Gd2O3 nanocomplex in the mouse
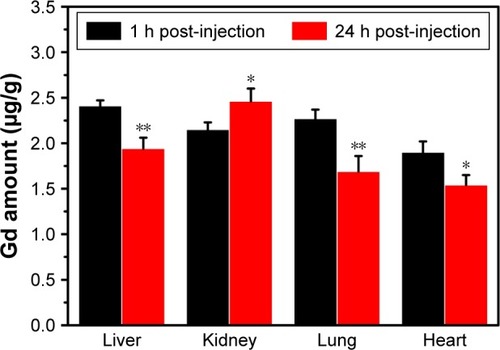
To show the biodistribution and residual persistence of the Fe3O4@mSiO2/PDDA/BSA-Gd2O3 nanocomplex in different organs, ICP-MS was employed to determine the Gd concentration in the heart, liver, kidneys, and lungs after 1 h and 24 h following injection of the Fe3O4@mSiO2/PDDA/BSA-Gd2O3 nanocomplex. As shown in , the Gd concentration in the above organs all decreased, except in the kidney. The residual Gd concentrations in heart, liver, kidneys, and lungs were 1.90±0.12, 2.41±0.06, 2.15±0.08, and 2.27±0.1 µg/g at 1 h post-injection and 1.54±0.11, 1.94±0.12, 2.46±0.14, and 1.69±0.17 µg/g at 24 h post-injection, respectively.
Figure 10 The concentrations of Gd in the heart, lung, liver, and kidney at 1 h and 24 h post-intravenous injection of the Fe3O4@mSiO2/PDDA/BSA-Gd2O3 nanocomplex as determined by inductively coupled plasma-mass spectrometry (n=3, *p<0.05, **p<0.01).
In vivo toxicity evaluation
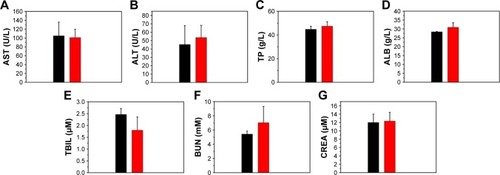
The in vivo toxicity of the Fe3O4@mSiO2/PDDA/BSA-Gd2O3 nanocomplex was evaluated with standard hematologic and biochemical analyses and by referring to the literature.Citation45 Compared with the normal saline group, the HCT, HGB, RBC, WBC, MCV, MCH, and MCHC levels in the Fe3O4@mSiO2/PDDA/BSA-Gd2O3 nanocomplex group showed no statistically significant differences, except for PLT (). The ALT, AST, BUN, CREA, TP, ALB, and TBIL levels displayed no statistically significant difference between the normal saline group and the Fe3O4@mSiO2/PDDA/BSA-Gd2O3 nanocomplex group ().
Figure 11 Hematologic analysis of mice at 1 week post-injection of normal saline (black bar) and the Fe3O4@mSiO2/PDDA/BSA-Gd2O3 nanocomplex (red bar).
Notes: (A) White blood cells (WBC), (B) red blood cells (RBC), (C) platelets (PLT), (D) mean corpuscular volume (MCV), (E) hemoglobin (HGB), (F) mean corpuscular hemoglobin concentration (MCHC), (G) mean corpuscular hemoglobin (MCH), and (H) hematocrit (HCT) levels in the blood. ***Refers to statistically significant differences compared with the normal saline group (p<0.001, n=3).
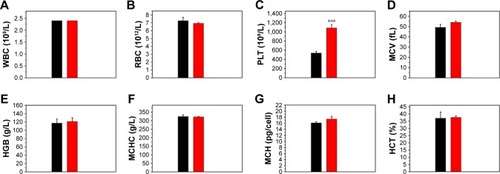
Figure 12 Biochemical analysis of mice at 1 week post-injection of normal saline (black bar) and the Fe3O4@mSiO2/PDDA/BSA-Gd2O3 nanocomplex (red bar).
Notes: (A) Alanine transaminase (AST), (B) aspartate transaminase (ALT), (C) total protein (TP), (D) albumin (ALB), (E) total bilirubin (TBIL), (F) blood urea nitrogen (BUN), and (G) creatinine (CREA) levels in the blood; (n=3).
In vivo MRI
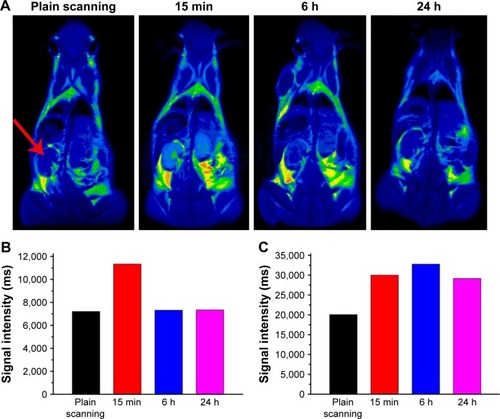
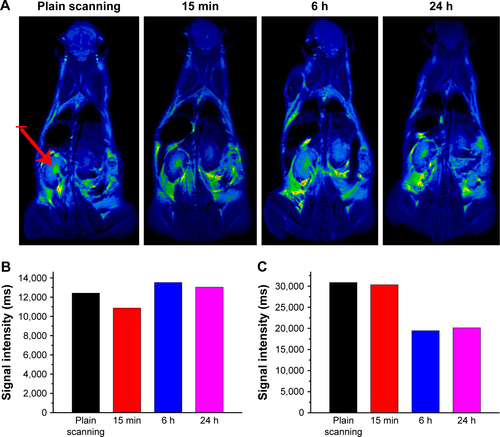
For in vivo MR imaging, T1 and T2 dual-mode images were obtained pre- and post-injection of the Fe3O4@mSiO2/PDDA/BSA-Gd2O3 nanocomplex using a 3T MR scanner at room temperature. MRI images were collected at scheduled intervals of 24 h post-injection. As shown in and , compared with the pre-injection reference, a darker signal in T2-weighted images and a brighter signal in T1-weighted images in the kidney at 15 min after administration were observed. However, at the 6-h time point, such signal contrasts in the kidney brought by the nanocomplex injection became weaker and the signal contrasts in the bladder became stronger, indicating that the excretion of the nanocomplex was mainly via the kidneys and bladder. These results showed the potential of the Fe3O4@mSiO2/PDDA/BSA-Gd2O3 nanocomplex as an effective T1–T2 dual-mode CA for in vivo MRI with self-confirmation.
Figure 13 (A) T1-weighted in vivo magnetic resonance imaging (MRI) images of mice post-injection of the Fe3O4@mSiO2/PDDA/BSA-Gd2O3 nanocomplex at different time points (0, 15 min, 6 h, and 24 h). The signal intensities in the kidneys (B) and bladder (C) at different time points after intravenous injection of the Fe3O4@mSiO2/PDDA/BSA-Gd2O3 nanocomplex. The red arrow indicates the kidney.
Scheme 1 Schematic illustration of the fabrication process of the Fe3O4@mSiO2/PDDA/BSA-Gd2O3-AS1411 nanoprobes.
Discussion
T1–T2 dual modal MR imaging avoids the false-positive signals caused by a single imaging mode and provides more accurate and complementary information. The development of T1–T2 dual CAs favors T1–T2 dual modal MR imaging. However, interferences between the T1 and T2 CAs when they are in proximity would reduce their MRI relaxivity. To avoid this influence, a 20-nm mSiO2 nanoshell was employed to increase the distance between T1 CA, BSA-Gd2O3 NP and the T2 CA, Fe3O4 NP in this study, because the interference of T2 CA on the contrast enhancement of paramagnetic T1 CAs might be weakened when their distance exceeds 12 nm. As expected, our fabricated Fe3O4@mSiO2/PDDA/BSA-Gd2O3 nanocomplex presented a comparable T1 relaxivity of 11.5 s−1 mM−1 to BSA-Gd2O3 (12.2 s−1 mM−1), which was three times that of the commercial MRI CAs, Gd–DTPA (r1 =4.3 s−1 mM−1). As reported, in a certain range, the larger the size of NPs, the stronger the saturation magnetization and relaxation rate of the nanomaterials.Citation46 In our work, the existence of PDDA favored more BSA-Gd2O3 NPs loading on the surface of Fe3O4@mSiO2 NPs. Therefore, the T1 relaxivity of the Fe3O4@mSiO2/PDDA/BSA-Gd2O3 nanocomplex should be higher than that of pure BSA-Gd2O3 NPs. However, there was little difference of T1 relaxivity between the Fe3O4@mSiO2/PDDA/BSA-Gd2O3 nanocomplex and BSA-Gd2O3 NPs, which might arise from the interference of the Fe3O4 core, more or less. Besides the excellent MR imaging behaviors, the good biocompatibility and good stability in the cell culture medium or different pH solutions further provide the basis for their use to fabricate an mMRI nanoprobe. For hematologic analysis, all of the hematology markers displayed no statistically significant differences between the normal saline-treated group and the Fe3O4@mSiO2/PDDA/BSA-Gd2O3 nanocomplex-treated group, except for PLTs. PLTs play a key role in hemostasis and thrombosis. Nanomaterials interact with PLTs and affect their count and function, which might result in severe clinical outcomes.Citation47 For example, Radomski et al found multi- or single-walled carbon nanotubes (MWCNTs or SWCNTs) induced PLT activation and aggregation whereas C60 fullerences (nC60) had no effect.Citation48 Reinish et al observed a reduction in the PLT blood count in the first 5 min after the injection of negatively charged liposomes to rats, but noted a recovery of PLT count after 60 min post-injection.Citation49 Nanomaterial properties such as size, shape, chemical composition, and surface physicochemical property influence their effect on PLT, obviously. For biochemical analysis, the commonly used serum biochemical parameters including AST, ALT, TP, ALB, TBL, BUN, and CREA were measured. ALT and AST are commonly used indicators of liver function. Creatinine and BUN are important indicators of kidney function.Citation45 Compared with the normal saline-treated group, no statistically significant difference was observed in the above parameters in the Fe3O4@mSiO2/PDDA/BSA-Gd2O3 nanocomplex-treated group, showing the good biocompat-ibility of Fe3O4@mSiO2/PDDA/BSA-Gd2O3 nanocomplex in vivo. Then, after conjugation with the AS1411 aptamer as the targeting molecule, the 786-0 cells could be specifically targeted with the Fe3O4@mSiO2/PDDA/BSA-Gd2O3-AS1411 nanoprobe by MRI. Furthermore, the Fe3O4@mSiO2/PDDA/BSA-Gd2O3 nanocomplex could produce a signal enhancement in the kidney, suggesting their potential use as CAs in vivo. The biodistribution and clearance of nanomaterials in vivo is related to the characteristics of nanomaterials and organ specificity, such as hydrodynamic size, the surface charge, surface modification, and so on.Citation50–Citation52 It was reported that NPs with a hydrodynamic diameter less than 5.5 nm could be excreted by renal clearance, and those with a hydrodynamic diameter more than 15 nm were usually captured and eliminated through the liver into bile and into feces.Citation53,Citation54 However, in our case, the increase of Gd concentration in the kidney with time indicated the possible excretion route of the Fe3O4@mSiO2/PDDA/BSA-Gd2O3 nanocomplex from the body through the kidneys, as even its hydrodynamic size was approximately 345.6 nm. This result was similar with that reported in Mekuria et al’s report; they prepared G4.5-Gd2O3-PEG NPs with a hydrodynamic diameter of approximately 50 nm. They concluded that the kidneys removed NPs from the vascular compartment to the gall bladder.Citation55 This means the clearance route of nanomaterials was not only related to the hydrodynamic size, but also to other factors. The Gd concentrations in the heart, liver, and lung all decreased with time, as indicated by the gradual clearance of the Fe3O4@mSiO2/PDDA/BSA-Gd2O3 nanocomplex from the body.
Conclusion
The introduction of CAs has improved the sensitivity of MRI greatly, stimulating its wider application in disease diagnosis. However, single-mode CAs are not yet perfected. The combination of T1 and T2 CAs can integrate the high tissue resolution of T1 mode contrast imaging and the high feasibility of softer tissue detection of T2 mode contrast imaging. Herein, to get a T1–T2 dual MRI CA with better signal enhancement effect, a Fe3O4@mSiO2/PDDA/BSA-Gd2O3 nanocomplex was synthesized for better relaxivity of nano-CAs. The obtained nanocomplex displayed high longitudinal (r1=11.47 mM s−1 Gd) and transverse (r2=195.1 mM s−1 Fe) relaxivities, enabling its use as a T1–T2 dual CA for MRI. To further apply their use as mMR imaging nanoprobes for the specific recognition of tumor cells, the AS1411 aptamer which can specifically combine with the nucleolin of the surface of the tumor cell was covalently coupled with the Fe3O4@mSiO2/PDDA/BSA-Gd2O3 nano-complex. When intravenously injected into the mice, the Fe3O4@mSiO2/PDDA/BSA-Gd2O3 nanocomplex could produce a kidney contrast-enhancement and was excreted via the bladder, thereby showing promise as a T1–T2 dual-mode CA.
Acknowledgments
This work was supported by the National Natural Science Foundation of China (grant no 81771904), the Natural Science Foundation of Jiangsu Province for the Excellent Young Scholars (grant no BK20170054), China Postdoctoral Science Foundation (grant nos 2016M601890 and 177607), Qing Lan Project, the Peak of Six Talents of Jiangsu Province (grant no WSN-112), Jiangsu Provincial Medical Youth Talent (grant no QNRC2016776), and the Natural Science Fund for Colleges and Universities in Jiangsu Province (grant no 16KJB310019).
Supplementary materials
Figure S1 Transmission electron microscopy characterizations of Fe3O4 nanoparticles (NPs) (A) and Fe3O4@mSiO2 NPs (B). The insert in (A) is the distribution of Fe3O4 NP size.
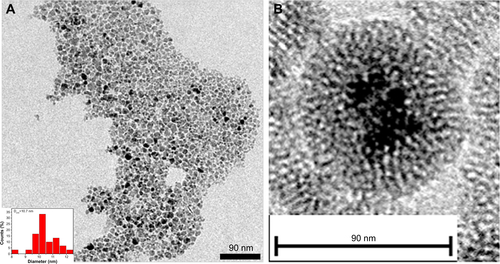
Figure S2 X-ray powder diffraction patterns of the Fe3O4, Fe3O4@mSiO2 and Fe3O4@mSiO2/PDDA/BSA-Gd2O3 nanocomplex.
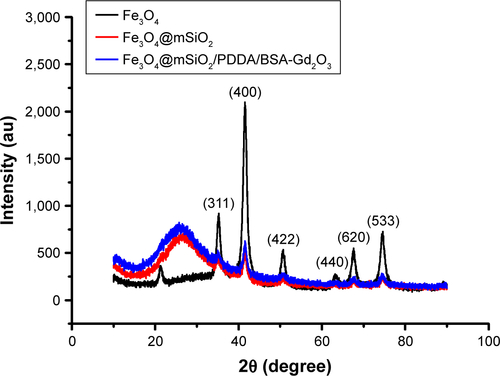
Figure S3 T1-weighted magnetic resonance (MR) images and T1-map images as well as T2-weighted MR images and T2-map images of the Fe3O4@mSiO2/PDDA/BSA-Gd2O3 nanocomplex prepared with different concentrations of Fe3O4 nanoparticles. A 3.0 T human MR scanner was used.
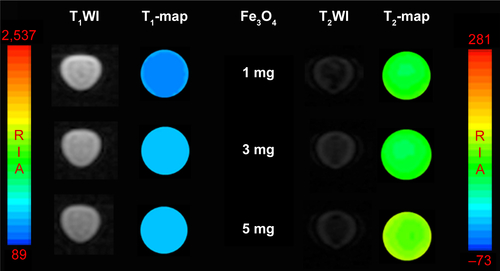
Figure S4 T1-weighted magnetic resonance (MR) images as well as T2-weighted MR images of the mSiO2/PDDA/BSA-Gd2O3 nanocomplex, Fe3O4@mSiO2/PDDA/BSA-Gd2O3 nanocomplex, and Fe3O4@mSiO2 nanocomplex. A 3.0 T human MR scanner was used.
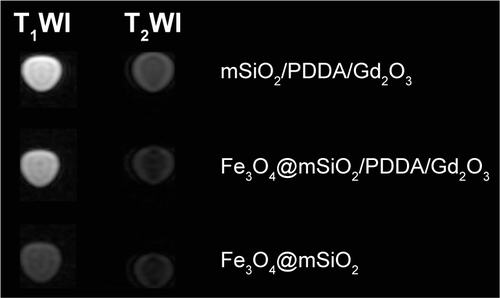
Figure S5 T1-weighted magnetic resonance (MR) images and T1-map images as well as T2-weighted MR images and a T2-map images of the Fe3O4@mSiO2/PDDA/BSA-Gd2O3 nanocomplex and Fe3O4@mSiO2/PDDA/BSA-Gd2O3-AS1411 nanoprobe. No significant difference of T1 and T2 relaxation time could be observed after the AS1411 aptamer modification. A 3.0 T human MR scanner was used.
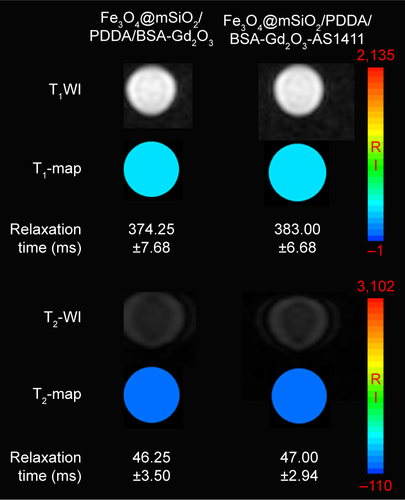
Figure S6 T1-weighted magnetic resonance (MR) images and T1-map images (A) as well as T2-weighted MR images and T2-map images (B) of NIH-3T3 cells treated with 1 mg mL−1 Fe3O4@mSiO2/PDDA/BSA-Gd2O3 nanocomplex (−) and Fe3O4@mSiO2/PDDA/BSA-Gd2O3-AS1411 nanoprobe (+). A 3.0 T human MR scanner was used.
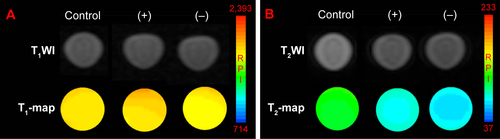
Figure S7 (A) T2-weighted in vivo magnetic resonance imaging (MRI) images of mice post-injection of the Fe3O4@mSiO2/PDDA/BSA-Gd2O3 nanocomplex at different time points (0, 15 min, 6 h, and 24 h). The signal intensities in the kidneys (B) and bladder (C) at different time points after intravenous injection of the Fe3O4@mSiO2/PDDA/BSA-Gd2O3 nanocomplex. The red arrow indicates the kidney.
Disclosure
The authors report no conflicts of interest in this work.
References
- WeisslederRMooreAMahmoodUIn vivo magnetic resonance imaging of transgene expressionNat Med20006335135510700241
- WeisslederRMahmoodUMolecular imagingRadiology2001219231633311323453
- BellinMFMR contrast agents, the old and the newEur J Radiol200660331432317005349
- BarandovABartelleBBGonzalezBAWhiteWLLippardSJJasanoffAMembrane-permeable Mn(III) complexes for molecular magnetic resonance imaging of intracellular targetsJ Am Chem Soc2016138175483548627088782
- PhukanBMukherjeeCGoswamiUA new bis(aquated) high relaxivity Mn(II) complex as an alternative to Gd(III)-based MRI contrast agentInorg Chem20185752631263829424537
- BoehmIHeverhagenJTDelayed reaction following gadolinium-based contrast agent applicationMagn Reson Imaging201850101129540332
- LeeSHKimBHNaHBHyeonTParamagnetic inorganic nanoparticles as T1 MRI contrast agentsWires Nanomed Nanobi20146196209
- CourantTRoullinVGCadiouCHydrogels incorporating GdDOTA: towards highly efficient dual T1/T2 MRI contrast agentsAngew Chem Int Ed Engl201251369119912222865621
- NaHBSongICHyeonTInorganic nanoparticles for MRI contrast agentsAdv Mater20092121332148
- CabanaLBourgognonMWangJTThe shortening of MWNT-SPION hybrids by steam treatment improves their magnetic resonance imaging properties in vitro and in vivoSmall201612212893290527079833
- LaurentSForgeDPortMMagnetic iron oxide nanoparticles: synthesis, stabilization, vectorization, physicochemical characterizations, and biological applicationsChem Rev200810862064211018543879
- TerrenoECastelliDDVialeAAimeSChallenges for molecular magnetic resonance imagingChem Rev201011053019304220415475
- LiuYChenZLiuCYuDLuZZhangNGadolinium-loaded polymeric nanoparticles modified with Anti-VEGF as multifunctional MRI contrast agents for the diagnosis of liver cancerBiomaterials201132225167517621521627
- TasciottiELiuXBhavaneRMesoporous silicon particles as a multistage delivery system for imaging and therapeutic applicationsNat Nanotechnol20083315115718654487
- JunYWLeeJHCheonJChemical design of nanoparticle probes for high-performance magnetic resonance imagingAngew Chem Int Ed Engl200847285122513518574805
- ChenYAiKLiuJRenXJiangCLuLPolydopamine-based coordination nanocomplex for T1/T2 dual mode magnetic resonance imaging-guided chemo-photothermal synergistic therapyBiomaterials20167719820626606445
- KeasberryNABañobre-LópezMWoodCStasiukGJGalloJLongNJTuning the relaxation rates of dual-mode T(1)/T(2) nanoparticle contrast agents: a study into the ideal systemNanoscale2015738161191612826371437
- HuangGLiHChenJTunable T1 and T2 contrast abilities of manganese-engineered iron oxide nanoparticles through size controlNanoscale2014617104041041225079966
- ChoiDHanAParkJPFabrication of MnxFe1-xO colloidal solid solution as a dual magnetic-resonance-contrast agentSmall20095557157319089842
- HanAChoiDKimTFabrication of Mn-ferrite nanoparticles from MnO colloidsChem Commun (Camb)20094467806782
- BaeKHKimYBLeeYHwangJParkHParkTGBioinspired synthesis and characterization of gadolinium-labeled magnetite nanoparticles for dual contrast t1- and T2-weighted magnetic resonance imagingBioconjug Chem201021350551220166678
- ChoiJSLeeJHShinTHSongHTKimEYCheonJSelf-confirming “AND” logic nanoparticles for fault-free MRIJ Am Chem Soc201013232110151101720698661
- YangHZhuangYSunYTargeted dual-contrast T1- and T2-weighted magnetic resonance imaging of tumors using multifunctional gadolinium-labeled superparamagnetic iron oxide nanoparticlesBiomaterials201132204584459321458063
- ZhouZHuangDBaoJA synergistically enhanced T(1)–T(2) dual-modal contrast agentAdv Mater201224466223622822972529
- PierreVCBottaMAimeSRaymondKNFe(III)-templated Gd(III) self-assemblies-a new route toward macromolecular MRI contrast agentsJ Am Chem Soc2006128299272927316848429
- LivramentoJBTóthESourABorelAMerbachAERuloffRHigh relaxivity confined to a small molecular space: a metallostar-based, potential MRI contrast agentAngew Chem Int Ed Engl200544101480148415580594
- LivramentoJBSourABorelAMerbachAETóthÉA starburst-shaped heterometallic compound incorporating six densely packed Gd3+ ionsChem Eur J200612989100316311990
- YangCTChuangKHGd(III) chelates for MRI contrast agents: from high relaxivity to “smart”, from blood pool to blood-brain barrier permeableMedChemComm201235552565
- CaravanPStrategies for increasing the sensitivity of gadolinium based MRI contrast agentsChem Soc Rev200635651252316729145
- DaviesGLKrambergerIDavisJJEnvironmentally responsive MRI contrast agentsChem Commun (Camb)201349849704972124040650
- NiKZhaoZZhangZGeometrically confined ultrasmall gadolinium oxide nanoparticles boost the T(1) contrast abilityNanoscale2016863768377426814592
- AhmadMWXuWKimSJPotential dual imaging nanoparticle: Gd2O3 nanoparticleSci Rep20155854925707374
- GirvanACTengYCassonLKAGRO100 inhibits activation of nuclear factor-kappaB (NF-kappaB) by forming a complex with NF-kappaB essential modulator (NEMO) and nucleolinMol Cancer Ther2006571790179916891465
- IresonCRKellandLRDiscovery and development of anticancer aptamersMol Cancer Ther20065122957296217172400
- BatesPJLaberDAMillerDMThomasSDTrentJODiscovery and development of the G-rich oligonucleotide AS1411 as a novel treatment for cancerExp Mol Pathol200986315116419454272
- KimDKMikhaylovaMZhangYMuhammedMProtective Coating of Superparamagnetic Iron Oxide NanoparticlesChem Mater200315816171627
- KimJKimHSLeeNMultifunctional uniform nanoparticles composed of a magnetite nanocrystal core and a mesoporous silica shell for magnetic resonance and fluorescence imaging and for drug deliveryAngew Chem Int Ed Engl200847448438844118726979
- SunSKDongLXCaoYSunHRYanXPFabrication of multifunctional Gd2O3/Au hybrid nanoprobe via a one-step approach for near-infrared fluorescence and magnetic resonance multimodal imaging in vivoAnal Chem201385178436844123924153
- ZhangPHCaoJTMinQHZhuJJMulti-shell structured fluorescent-magnetic nanoprobe for target cell imaging and on-chip sortingACS Appl Mater Interfaces20135157417742423823645
- LiJYouJDaiYShiMHanCXuKGadolinium oxide nanoparticles and aptamer-functionalized silver nanoclusters-based multimodal molecular imaging nanoprobe for optical/magnetic resonance cancer cell imagingAnal Chem20148622113061131125338209
- HaoJSongGLiuTIn vivo long-term biodistribution, excretion, and toxicology of PEGylated transition-metal dichalcogenides MS2 (M=Mo, W, Ti) nanosheetsAdv Sci (Weinh)201641160016028105392
- GaoMLiWDongJSynthesis and characterization of super-paramagnetic Fe3O4@SiO2 core-shell composite nanoparticlesWorld J Condens Matter Phys2011124954
- LiJJiangHYuZMultifunctional uniform core-shell Fe3O4@mSiO2 mesoporous nanoparticles for bimodal imaging and photothermal therapyChem Asian J20138238539123225542
- WuCSongJJiangCShenXQiaoQHuYNucleolin targeting AS1411 modified protein nanoparticle for antitumor drugs deliveryMol Pharm201310103555356323679916
- ZhangXDWuDShenXSize-dependent in vivo toxicity of PEG-coated gold nanoparticlesInt J Nanomedicine201162071208121976982
- JunYWHuhYMChoiJSNanoscale size effect of magnetic nanocrystals and their utilization for cancer diagnosis via magnetic resonance imagingJ Am Chem Soc2005127165732573315839639
- SimakJDe PaoliSThe effects of nanomaterials on blood coagulation in hemostasis and thrombosisWiley Interdiscip Rev Nanomed Nanobiotechnol201795e1448
- RadomskiAJuraszPAlonso-EscolanoDNanoparticle-induced platelet aggregation and vascular thrombosisBr J Pharmacol2005146688289316158070
- ReinishLWBallyMBLoughreyHCCullisPRInteractions of liposomes and plateletsThromb Haemost19886035185233238654
- van SchooneveldMMVucicEKooleRImproved biocompatibility and pharmacokinetics of silica nanoparticles by means of a lipid coating: a multimodality investigationNano Lett2008882517252518624389
- DaiYWuCWangSComparative study on in vivo behavior of PEGylated gadolinium oxide nanoparticles and Magnevist as MRI contrast agentNanomedicine201814254755529253637
- ShaoYTianXHuWThe properties of Gd2O3-assembled silica nanocomposite targeted nanoprobes and their application in MRIBiomaterials201233276438644622704842
- FischerHCLiuLPangKSChanWCWPharmacokinetics of nano-scale quantum dots: in vivo distribution, sequestration, and clearance in the ratAdv Funct Mater2006161012991305
- ChoiHSLiuWMisraPRenal clearance of quantum dotsNat Biotechnol200725101165117017891134
- MekuriaSLDebeleTATsaiHCEncapsulation of gadolinium oxide nanoparticle (Gd2O3) contrasting agents in PAMAM dendrimer templates for enhanced magnetic resonance imaging in vivoACS Appl Mater Interfaces2017986782679528164704