 ?Mathematical formulae have been encoded as MathML and are displayed in this HTML version using MathJax in order to improve their display. Uncheck the box to turn MathJax off. This feature requires Javascript. Click on a formula to zoom.
Abstract
The purpose of the present study was to optimize a solid lipid nanoparticle (SLN) of chloramphenicol by investigating the relationship between design factors and experimental data using response surface methodology. A Box-Behnken design was constructed using solid lipid (X1), surfactant (X2), and drug/lipid ratio (X3) level as independent factors. SLN was successfully prepared by a modified method of melt-emulsion ultrasonication and low temperature-solidification technique using glyceryl monostearate as the solid lipid, and poloxamer 188 as the surfactant. The dependent variables were entrapment efficiency (EE), drug loading (DL), and turbidity. Properties of SLN such as the morphology, particle size, zeta potential, EE, DL, and drug release behavior were investigated, respectively. As a result, the nanoparticle designed showed nearly spherical particles with a mean particle size of 248 nm. The polydispersity index of particle size was 0.277 ± 0.058 and zeta potential was −8.74 mV. The EE (%) and DL (%) could reach up to 83.29% ± 1.23% and 10.11% ± 2.02%, respectively. In vitro release studies showed a burst release at the initial stage followed by a prolonged release of chloramphenicol from SLN up to 48 hours. The release kinetics of the optimized formulation best fitted the Peppas–Korsmeyer model. These results indicated that the chloramphenicol-loaded SLN could potentially be exploited as a delivery system with improved drug entrapment efficiency and controlled drug release.
Introduction
Nanoparticulate carrier systems (eg, lipid nanoparticles, liposomes, and microemulsions) have recently been under consideration for topical ophthalmic drug delivery because they offer the possibility of modulating drug release, by facilitating its transport to the different compartments of the eye,Citation1 by increasing corneal penetration, and prolonging residence time at ocular surface, thus becoming attractive vehicles for the treatment of some ocular diseases.
Among these nanocarrier drug delivery systems, current trials utilizing solid lipid nanoparticles (SLN) as alternative drug delivery systems appear very promising.Citation2,Citation3 SLN, introduced in 1991, represents an alternative carrier system to traditional colloidal carriers, such as emulsion, liposome, and polymeric micro-and nanoparticles.Citation4 The main advantages of SLN over other traditional drug carriers are good biocompatibility, lower cytotoxicity, drug targeting, good production scalability, modulating drug release, and the possibility of production on a large industrial scale.Citation5–Citation7
A pharmaceutical formulation development study requires a detailed understanding of the relationship between process parameters and quality attributes. In particular, it is necessary to establish a science-based rationale and a design space to identify multidimensional combinations of the many causal factors that determine target quality.Citation8 However, it is difficult (and inefficient) to obtain an optimized formulation with rapid and complete dissolution using a traditional formulation screening and optimization process (one-factor-at-a-time). The one-factor-at-a-time optimization also ignores interaction between factors and may call for an unnecessarily large number of runs.Citation9 Currently more and more attention has been paid to the formulation optimization in the course of establishing SLN dispersion systems. Some studiesCitation10–Citation12 have optimized nanoparticulate formulations using factorial design. It is widely accepted that the choice of lipids and emulsifiers and their concentration strongly influence the quality of SLN dispersions. The character of SLN is controlled by the relative amount of oil, surfactant, and the ratio of solid lipid to drugs in the formulation. Consequently, an important aspect of SLN production, is the design of an optimized pharmaceutical formulation, because the ingredients significantly affect the physicochemical properties and drug-release profiles of the nanoparticles.
Nowadays, various experimental designsCitation13–Citation15 are useful in developing a formulation requiring less experimentation and providing estimates of the relative significance of different variables. In recent times, the application of a statistical experimental design to pharmaceutical formulation has been demonstrated to be efficient at acquiring the necessary information to understand the relationship between independent and dependent variables in a formulation. The response surface methodology (RSM) is useful in simultaneously analyzing process variables when variable interactions are very complicated. Many studies have demonstrated the value of RSM for establishing the optimal formulation in various drug delivery systems.Citation16 This study used the Box-Behnken design, an RSM design, because it requires fewer runs in a 3-factor experimental design than all other RSM designs, and is particularly useful when extreme treatment combinations need to be avoided.
The aim of this research was to evaluate the main and interaction effect of compositional variation and to optimize the chloramphenicol-loaded SLN formulation using the Box-Behnken design. In this study, in order to prepare SLN, a non-polar lipid glyceryl monostearate (GMS) was selected as solid lipid by reason of its high drug entrapment efficiency.Citation17 Poloxamer 188 as a nonionic surfactant was chosen as an emulsifier. Chloramphenicol was used as a model drug to be encapsulated in the SLN. Chloramphenicol-loaded SLN was tailored by a method of melt-emulsion ultrasonication and low temperature solidification technique. The physicochemical properties such as surface morphology, particle size, zeta potential, entrapment efficiency, drug loading, and drug release behavior of chloramphenicol-loaded SLN were investigated in detail.
Material and methods
Materials
The powered chloramphenicol (purity 99%) was purchased from Nanjing Bai Jingyu Pharmaceutical Co. Ltd. (China). GMS was provided by Shanghai Chemical Reagent Co., Ltd. (China). Poloxamer 188 was a kind gift from BASF (Germany). Methanol was of high performance liquid chromatography (HPLC) grade. All other reagents and solvents were of analytical reagent grade.
Preparation of SLN
SLN was prepared according to previous articles with some modificationCitation8,Citation18 by the following melt-emulsion ultrasonication and low temperature-solidification methods. In brief, aqueous and oil phases were separately prepared in glass vials. Drug and a specified amount of GMS were dissolved in a specified volume of ethanol (2 mL) and heated above the melting temperature of GMS (70°C). Hydrophilic surfactants and double distilled water were mixed at 70°C and added to the melted oil phase. The resulting suspension was continually stirred by mechanical agitation (DC-40, Hangzhou Electrical Engineering Instruments, China) at 400 rpm for 15 minutes at 70°C. The original warm emulsion was further treated for 5 minutes (work 2 seconds and stand 3 seconds) by a Lab ultrasonic cell pulverizer (JY92-II, Ningbo Scientz Biotechnology Co., Ltd. China) at 600 W to form a nanoemulsion. This was rapidly cooled by immersing the beaker into icy water (0°). Agitation continued until the nanoemulsion yielded a uniform dispersion of nanoparticles.
Experimental design
In this study, a 17-run, 3-factor, 3-level Box-Behnken design was employed to construct polynomial models for the optimization process, because it requires few runs with 3 or 4 variables. This design was suitable for investigating the quadratic response surface and for constructing a second-order polynomial model using Design-Expert software (Trial Version7.1.6, Stat-Ease Inc., MN). The design consisted of replicated center points and a set of points lying at the midpoints of each edge of the multidimensional cube, which defined the region of interest used to evaluate the main effects, interaction effects, and quadratic effects of the formulation ingredients, and to optimize the formulation. The non-linear quadratic model generated by the design was:
Y = A0 + A1X1 + A2X2 + A3X3 + A4X1X2 + A5X2X3 + A6X1X3 + A7X12 + A8X22 + A9X32, in which Y is the measured response of the dependent variables associated with each factor-level combination; A0 − A1 are the regression coefficients of the respective variables and their interaction terms computed from the observed experimental values of Y; and X1, X2, X3 are the coded levels of independent variables. The term X1 X2 and Xi2 (i = 1, 2 or 3) represent the interaction and quadratic terms respectively.Citation19 Factors evaluated in this study were the amount of GMS (X1), concentration of poloxamer (X2) and the ratio of drug/lipid (X3) as the independent variables which were represented by −1, 0 and +1, analogous to the low, middle, and high values respectively as described in . The studied dependent responses were entrapment efficiency (EE%) (Y1), drug loading (DL%) (Y2), turbidity (NTU) (Y3) with constraints applied as described in . The experiment design matrix generated by the software was shown in .
Table 1 Variables and their levels in the Box-Behnken design
Table 2 Box-Behnken experimental design
Entrapment efficiency and drug loading determination
The content of chloramphenicol was determined by the high performance liquid chromatography method. The chromatographic system consisted of a Shimadzu LC-10AT solvent delivery pump (Kyoto, Japan) equipped with a 20 μL loop and a UV visible detector. A Kromosil (250 × 4.6 mm) analytical column was used. The eluate was monitored at 275 nm. The mobile phase was methanol and water (45:55, v/v) with a flow speed of 1.0 mL · min−1 at room temperature. The calibration curve of peak area against concentration of chloramphenicol (mg · L−1) is shown in Equationequation (1)(1) :
It fit over the range 3.2–32 mg · L−1 with a correlation coefficient of r = 0.9999 (where A = peak area and C = chloramphenicol concentration).
To determine entrapment efficiency and drug loading, at first, the appropriated SLN was precipitated by adding saturated NH4SO4 solution, and then collecting the serum and solid residue, respectively after centrifugation (CS120GXL, Hitachi, Japan) at 50,000 rpm for 15 minutes. The solid residue was dispersed in 40 mL phosphate buffered saline (PBS) solution (pH 7.4), in order to dissolve the free drug absorbed on the surface of nanoparticles, and then centrifuge-separated. Both the drug content in serum and that in PBS determined by HPLC were labeled as Wfree. The efficiency of drug encapsulation (EE) and drug loading of nanoparticles were calculated according to Equationequations (2)(2) and Equation(3)
(3) ,
Turbidity measurements
For the same samples used in the particle size analysis, measurements of turbidity represent the effect of suspended solids blocking the transmission of light through a body of water, which can be used as an indirect way to determine particle size in the dispersion system. Dispersion turbidity in nephlometric turbidity units (NTU) was measured using a WZS-185 high turbidity Spectrometer (Shanghai Precision & Scientific Instrument Co., Ltd, China). All the containers used were cleaned thoroughly. All studies were repeated as duplicates, with good agreement being found among measurements.
Particle size and zeta potential analysis
The particle size and zeta potential of optimum SLN dispersions were measured by Zetasizer (3000SH, Malvern Instruments Ltd., UK). All samples were diluted with double distilled water to reach a suitable concentration before measurement.
Scanning electron microscopy (SEM) analysis
Scanning electron micrographs were performed using a KYKY-1000B scanning electron microscope (KYKY technology development Ltd., China). A drop of the SLN dispersion was mounted on aluminium stubs covered with a glass lamella, air-dried, gold coated under vacuum, then examined.
In vitro release study
The formulation was subjected to in vitro release studies using 150 mL of artificial tear fluid (ATF) pH 7.4 as dissolution medium (maintained at 37 ± 0.5°C), which is equivalent to the pH of the eye. In vitro release studies were performed using the dialysis bag method, modified to maintain a sink condition and achieve satisfactory reproducibility. Two mL of chloramphenicol-loaded SLN dispersion was first poured into the dialysis bag (molecular weight cut off 12000–14000) with the two ends fixed by thread and placed into the preheated dissolution media. The suspension was stirred at 37 ± 0.5°C, using a RCZ-8A Drug Dissolution Tester (Tianjin Medical Instrument Factory, China) with paddle rotating at 50 rpm. Five mL of the sample was withdrawn at fixed time intervals and the same volume of fresh medium was added accordingly. Samples were analyzed by HPLC as described above. The composition of ATF used was: sodium chloride 0.670 g, sodium bicarbonate 0.200 g, calcium chloride dihydrate 0.008 g, and purified water q.s. 100 mL.Citation20
Results and discussion
Statistical analysis of experimental data by Design-Expert Software
The results of the experimental design were analyzed using Design-Expert software, which provided considerable useful information and reaffirmed the utility of statistical design for conduct of experiments. The selected independent variables including the amount of GMS, concentration of poloxamer 188, and drug/lipid ratio, significantly influenced the observed responses for EE (%), DL (%) and turbidity, which are presented in . Polynomial equations involving the main effect and interaction factors were determined based on estimation of statistical parameters such as multiple correlation coefficient, adjusted multiple correlation coefficient, and the predicted residual sum of squares generated by Design-Expert software. The statistical validation of the polynomial equations was established by ANOVA provision available in the software. Therefore, the optimum values of the variables were determined according to the obtained experimental data using the Design-Expert software, based on the constrained criterion of desirability presented in .Citation21
Table 3 Observed and predicted value of encapsulation efficiency (Y1), drug loading (Y2) and turbidity (Y3) of formulations in the Box-Behnken design
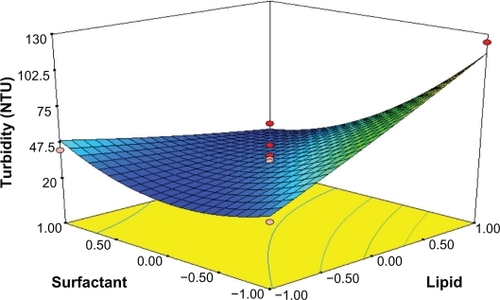
Response surface analyses plotted in three-dimensional model graphs for depicting the effects of the predetermined factors on the response of the entrapment efficiency, drug loading, and turbidity are shown in to , based on the model polynomial functions, to assess change in the response surface. The response surface plots were used to study the interaction effects of 2 independent variables on the responses or dependent variables, when a third factor is kept at constant level.Citation22 When these plots were carefully observed, the qualitative effect of each variable on each response parameter could be visualized.
Figure 1 Response surface plot showing effect of the amount of lipid (X1) and surfactant levels (X2) on entrapment efficiency (Y1).
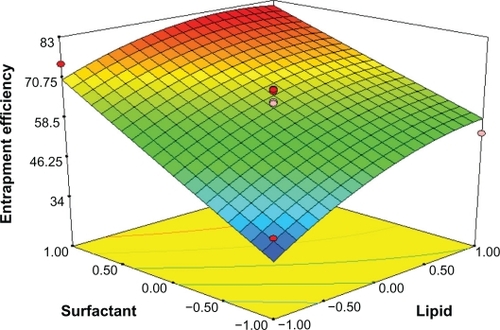
Effects on Entrapment efficiency (Y1)
The entrapment efficiency varies from 30.13% (formulation 4) to 80.77% (formulation 16) for various factor level combinations (). The independent factors affecting the entrapment efficiency were the amount of GMS (X1) and surfactant levels (X2) (P < 0.05, and ). The effect can be explained by the following quadratic equation:
Table 4 Statistical analysis results of entrapment efficiency, drug loading, and turbidity
The positive value before a factor in the regression equation indicates that the response increases with the factor and vice versa.Citation23 The value of the correlation coefficient (r2) of Equationequation 4(4) was found to be 0.9396, indicating a good fit.
In , the effect of varying the amount of lipid and emulsifier on the entrapment efficiency (Y1) was studied when the drug/lipid ratio was kept constant. The lipid level (X1) had a significant and positive effect on Y1 as revealed by the positive value in the quadratic equation. The result showed that the entrapment efficiency rapidly increased as the amount of lipid increased. Increasing the amount of GMS, was bound to increase the % of EE because of the increased concentration of mono-, di-, and triglycerides, which act as solubilizing agents for highly lipophilic drugs and provide more and more spare space to accommodate excessive drugs.Citation24 However increasing the amount of drug/lipid ratio while keeping the emulsifier level constant, as shown in , would decrease the entrapment efficiency, probably because redundant drug becomes insoluble in GMS.
Figure 2 Response surface plot showing effect of the amount of lipid (X1) and drug/lipid ratio (X3) on entrapment efficiency (Y1).
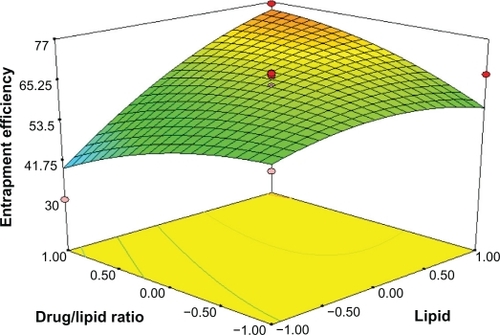
The entrapment efficiency could be increased with drug concentration (X3) in the internal phase as more of the drug would be available for entrapment. The surfactant level (X2) also has a significant and positive effect on the entrapment efficiency (Y1). In , the entrapment efficacy was significantly increased by increasing the amount of emulsifier and the amount of lipid. This effect was, probably due to the increased viscosity of the medium, because increasing the amount of lipid resulted in faster solidification of the nanoparticles. This would also prevent drug diffusion to the external phase of the medium.Citation25 As the percentage of emulsifier increased, part of the chloramphenicol was incorporated in the surfactant layer at the surface of the SLN, leading to a high entrapment efficacy.
Figure 3 Response surface plot showing effect of the amount of surfactant (X2) and drug/lipid ratio (X3) on entrapment efficiency (Y1).

Effects on drug loading (Y2)
According to the results obtained from the experiments for drug loading, the value of drug loading varied from 1.79% (formulation 9) to 10.29% (formulation 11) (). The %DL was clearly influenced by surfactant concentration and the drug/lipid ratio as seen in . The following equation can explain the effect of factor levels on %DL:
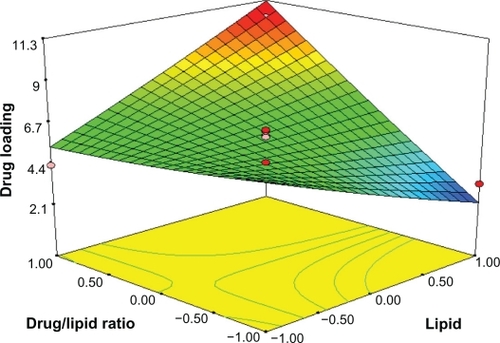
The main effects of X1, X2, and X3 represent the average result of changing 1 variable at a time from its low level to its high level. The negative coefficients before independent variables indicate an unfavorable effect on the %DL, while the positive coefficients indicate a favorable effect on the %DL. The interaction terms (X1X2, X1X3, X2X3, X12, X22, and X32) show how the %DL changes when 2 variables are simultaneously changed. Analyzing these coefficients in the above second-order polynomial mode shows how the increase of drug/lipid ratio and emulsifier level enhances the drug loading of SLN, making it more efficient than for GMS because of the positive and large coefficient of these particles. The cross-interaction of GMS and drug/lipid ratio on %DL of SLN was significant because the coefficient of X1X3 was larger than others. Furthermore, the F-value for the full quadratic equation for the %DL of SLN was 6.25, indicating that the second-order response surface model was significant at the 5% level. Among the 3 independent variables, the lowest coefficient value is for X1 (A1 = 0.22 and P > 0.05), indicating that this variable is insignificant in prediction of drug loading.
By analyzing the response surfaces for drug loading, it was obvious that the level of drug/lipid ratio and emulsifier exert positive influence on drug loading. As shows, an increse of lipid and emulsifier concentration leads to a non-linear increase in drug loading when the drug/lipid ratio is fixed. When the amount of surfactant is increased, the percent of DL is thought to increase because of enhanced entrapped drug; the reason why DL% is increased on the enhanced lipid is that the increased content of lipids can provide more and more spare space to accommodate excessive drugs. At the same time, according to Equationequation (3)(3) and , for constant amount of surfactant concentration, when drug concentration increases, the amount of excipients increases, which results in reduced drug loading.
Figure 4 Response surface plot showing effect of the amount of lipid (X1) and surfactant levels (X2) on drug loading (Y2).
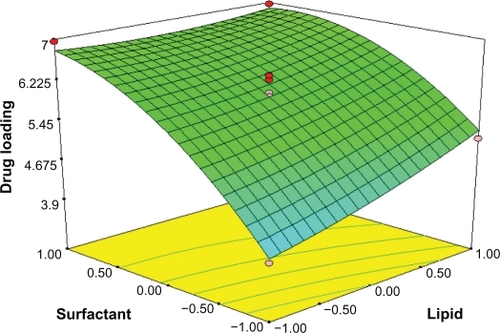
Figure 5 Response surface plot showing effect of the amount of lipid (X1) and drug/lipid ratio (X3) on drug loading (Y2).
Effects on turbidity (Y3)
Turbidity could have caused some obstruction when light was transmitted to a suspension. Turbidity value depends significantly on the particle size and thus can be used indirectly to reflect particle size. The turbidity of SLN ranged from 23 NTU (formulation 14) to 124 NTU (formulation 8) () with the selected levels of variables. Small-sized particles are highly desirable in order to increase the permeability through cornea surface. Results in demonstrated that turbidity was significant but negatively dependent upon the surfactant level. The full second-order polynomial model for turbidity obtained by the response surface regression procedure using Design-Expert software is given by:
By analyzing these coefficients in the above second-order polynomial mode, turbidity is distinctly influenced by surfactant concentration and lipid ratio as seen in ; the cross-interaction of poloxamer 188 and GMS on the size of SLN was significant because the coefficient of X1X2 was far greater than others. Furthermore, the F-value for the full quadratic equation for the SLN particle size was 12.07, indicating that the second-order response surface model was significant at the 5% level.
As shows, the increase in emulsifier could efficiently reduce the particle size of SLN. On increasing the concentration of poloxamer 188, the particle size was decreased. This might be due to the surfactant-induced reduction in surface tension between the aqueous phase and organic phase. In addition, surfactant helps to stabilize the newly generated surfaces and prevents particle aggregation.Citation26 The increase in GMS concentration would lead to the increase in size. The fact that the size of lipid nanoparticles is highly dependent on lipid concentration can be explained in terms of the tendency of the lipid to coalesce at high lipid concentration. According to Stoke’s law, this behavior can be explained by a difference in density between the internal and external phases.Citation27
Figure 6 Response surface plot showing effect of the amount of lipid (X1) and surfactant levels (X2) on turbidity (Y3).
Optimization and validation
The desirability function was probed using Design-Expert software to acquire the optimized formulation. The optimum formulation was based on the set criteria of maximum entrapment efficiency, maximum drug loading, and minimum particle size. Therefore a new batch of SLN with the predicted levels of formulation factors was prepared to confirm the validity of the optimization procedure. The composition of optimized formulation was achieved with 10% (w/v) GMS, 8% (w/v) surfactant and 13.5 mg/mL chloramphenicol, which fulfill the requirements of optimization. The optimized formulation has entrapment efficiency 83.29% ± 1.23%, drug loading 10.11% ± 2.02%, and turbidity 21 ± 3 NTU, which were in good agreement with the predicted values.
Physicochemical characterization of nanoparticles
SEM studies revealed that chloramphenicol-loaded SLN were almost spherical in shape with smooth morphology which appeared as white bright dots (). However, in order to obtain more precise information on the size distribution, particle size and zeta potential, measurements were performed in the following study.
Figure 7 Scanning electron micrographs of chloramphenicol loaded solid lipid nanoparticles consisting of glyceryl monostearate 10%, poloxamer 8%, drug/lipid ratio13.5% (×5000).

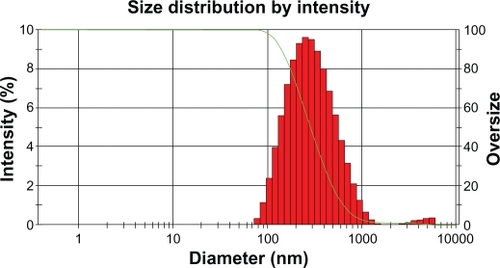
It was known that the particle size distribution was one of the most important characteristics for evaluation of the stability of colloidal systems. The mean particle size (z-ave) and the polydispersity index (PI) were 2 measures to evaluate the width of the size distribution. shows that the particle size distribution of chloramphenicol-loaded SLN was 248 ± 4.8 nm; the polydispersity index of particle size was 0.277 ± 0.058 (run 3).
Figure 8 Particle distribution of chloramphenicol-loaded solid lipid nanoparticles.
Zeta potential is the measure of overall charges acquired by particles in a particular medium and is considered as one of the benchmarks of stability of the colloidal system. Particles will repel each other if the systems have high positive or negative value of zeta potential, and a system having value ±30 mV is considered a stable formulation if dispersed in a liquid as colloidal dispersion.Citation23 In the present study, the zeta potential value of optimum formulation was −8.74 mV. The absolute value of zeta potential was lower than those values reported in the literature. This might be attributed to poloxamer 188, a nonionic surfactant which decreases the electrostatic repulsion between the particles and sterically stabilizes the nanoparticles by forming a coat around their surface.Citation28 The negative charge of SLN may result from fatty acids released from the hydrolysis of GMS. In such a system, the hydrophilic emulsifiers were thought to align alongside each other, imparting more rigidity and strength to the emulsifier film through hydrogen bonding.Citation29
In addition, with regard to particle distribution, the polydispersity index is an indicator of the homogeneity of the size distribution. The PI value of 0.277 indicated that the optimal composition could be used to produce a stable SLN dispersion with a relatively narrow size distribution for chloramphenicol-loaded SNL.
In vitro drug release behavior
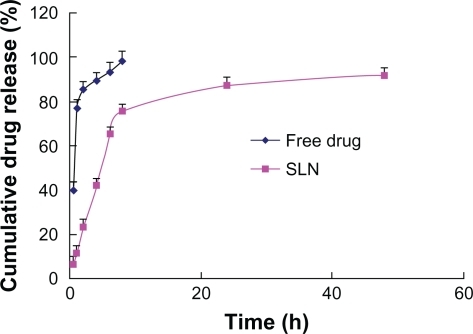
The drug release behavior in vitro of chloramphenicol-loaded SNL was investigated using a dialysis membrane in pH 7.4 ATF (37 ± 0.5). In , free chloramphenicol exhibited a rapid release of 90% of drug within 6 hours, whereas the release profiles of SNL indicated a biphasic pattern with a burst release during the first 8 hours, followed by a sustained release over 48 hours. The initial fast release of drug from the SNL could be explained by drug desorption from the outer surface of the SNL and the larger specific surface of the smaller particles increasing the initial drug release rate. Furthermore, SLN had been prepared so as not to remove existing free drug, but the initial burst related to free drug could not be ignored. The mechanism of release was determined by finding the R2 value for each kinetic model viz First-order, Higuchi, Peppas–Korsmeye, and Hixon–Crowell model corresponding to the release data obtained. The Peppas–Korsmeye model was the best (y = 0.9428 x − 0.9385, R2 = 0.9969) in that the R2 value of the Korsmeyer–Peppas model is much larger than other kinetic models. Thus it can be said that the drug release follows Peppas–Korsmeyer model mechanism. The n value is 0.9428 which is above 0.89, so that the release can be characterized by super case II transport,Citation30 which means the drug release rate is dominated by polymer disentanglement and erosion.
Figure 9 In vitro drug release profile of chloramphenicol from solid lipid nanoparticles (SLN) and free drug (pH 7.4 artificial tear fluid was used as dialysis medium).
Conclusion
Optimization of an SLN formulation is a complex process, which requires one to consider a large number of variables and their interactions with each other. The present study conclusively demonstrates that the optimal formulations of SLN contain 10% (w/v) GSM, 8% (w/v) poloxamer 188, and 13.5 mg/mL chloramphenicol using the Box-Behnken design. The derived polynomial equations and response surface plots aid in predicting the values of selected independent variables for preparation of optimum formulations with desired properties. The chloramphenicol-SLN obtained in vitro release experiments exhibited a biphasic release pattern with burst release at the initial phase followed by sustained release. However, in vivo studies for chloramphnicol-SLN should be performed to determine its ophthalmic delivery efficacy.
Acknowledgements
We thank the National Natural Science Foundation of China for financial support (No 81001643/H2806).This work was also supported in part by the Ministry of Science and Technology of Dongguan (NO 2008108101064).
Disclosure
The authors report no conflicts of interest in this work.
References
- BadawiAEl-LaithyHEl QidraREl MoftyHEl dallyMChitosan based nanocarriers for indomethacin ocular deliveryArch Pharm Res20083181040104918787795
- De JongWBormPDrug delivery and nanoparticles: applications and hazardsInt J Nanomedicine20083213314918686775
- ÜnerMYenerGImportance of solid lipid nanoparticles (SLN) in various administration routes and future perspectivesInt J Nanomedicine20072328930018019829
- FreitasCMüllerRCorrelation between long-term stability of solid lipid nanoparticles (SLN (TM)) and crystallinity of the lipid phaseEur J Pharm Biopharm199947212513210234536
- MüllerRRühlDRungeSSchulze-ForsterKMehnertWCytotoxicity of solid lipid nanoparticles as a function of the lipid matrix and the surfactantPharm Res19971444584629144731
- HuangZHuaSYangYFangJDevelopment and evaluation of lipid nanoparticles for camptothecin delivery: a comparison of solid lipid nanoparticles, nanostructured lipid carriers, and lipid emulsionActa Pharmacologica Sinica20082991094110218718178
- MüllerRMäderKGohlaSSolid lipid nanoparticles (SLN) for controlled drug delivery-a review of the state of the artEuropean Journal of Pharmaceutics and Biopharmaceutics200050116117710840199
- AraiHSuzukiTKasedaCTakayamaKEffect of an Experimental Design for Evaluating the Nonlinear Optimal Formulation of Theophylline Tablets Using a Bootstrap Resampling TechniqueChem Pharm Bull200957657257919483336
- El-MalahYNazzalSKhanfarND-optimal mixture design: optimization of ternary matrix blends for controlled zero-order drug release from oral dosage formsDrug Dev Ind Pharm200632101207121817090443
- BozkirASakaOFormulation and investigation of 5-FU nanoparticles with factorial design-based studiesIl Farmaco2005601084084616087183
- BhavsarMTiwariSAmijiMFormulation optimization for the nanoparticles-in-microsphere hybrid oral delivery system using factorial designJ Control Release2006110242243016338017
- DerakhshandehKErfanMDadashzadehSEncapsulation of 9-nitrocamptothecin, a novel anticancer drug, in biodegradable nanoparticles: factorial design, characterization and release kineticsEur J Pharm Biopharm2007661344117070678
- GohelMAminAFormulation optimization of controlled release diclofenac sodium microspheres using factorial designJ Control Release1998512–31151229685908
- NazzalSKhanMResponse surface methodology for the optimization of ubiquinone self-nanoemulsified drug delivery systemAAPS PharmSciTech2002312331
- ChangJHuangYHouSWangRWuPTsaiYFormulation optimization of meloxicam sodium gel using response surface methodologyInt J Pharm20073381–2485417360134
- LiuCWuCFangJCharacterization and formulation optimization of solid lipid nanoparticles in vitamin K1 deliveryDrug Dev Ind Pharm201036775176120136495
- ManjunathKReddyJVenkateswarluVSolid lipid nanoparticles as drug delivery systemsMethods Find Exp Clin Pharmacol200527212714415834465
- YuanHWangLDuYYouJHuFZengSPreparation and characteristics of nanostructured lipid carriers for control-releasing progesterone by melt-emulsificationColloids Surf B: Biointerfaces200760217417917656075
- YangCZhaoXHuHPreparation, Optimization and Characteristic of Huperzine A Loaded Nanostructured Lipid CarriersChem Pharm Bull201058565666120460792
- BottariFDi ColoGNannipieriESaettoneMSerafiniMInfluence of drug concentration on in vitro release of salicylic acid from ointment basesJ Pharm Sci19746311177917834427246
- MyersRMontgomeryDAnderson-CookCResponse surface methodology: process and product optimization using designed experimentsNew YorkJohn Wiley & Sons2009
- WoitiskiCVeigaFRibeiroANeufeldRDesign for optimization of nanoparticles integrating biomaterials for orally dosed insulinEur J Pharm Biopharm2009731253319508892
- RahmanZZidanAHabibMKhanMUnderstanding the quality of protein loaded PLGA nanoparticles variability by Plackett-Burman designInt J Pharm20103891–218619420038446
- ShahMPathakKDevelopment and Statistical Optimization of Solid Lipid Nanoparticles of Simvastatin by Using 2 3 Full-Factorial DesignAAPS PharmSciTech20101821152999
- YangYChungTBaiXChanWEffect of preparation conditions on morphology and release profiles of biodegradable polymeric microspheres containing protein fabricated by double-emulsion methodChem Eng Sci2000551222232236
- SchubertMMüller-GoymannCSolvent injection as a new approach for manufacturing lipid nanoparticles-evaluation of the method and process parametersEur J Pharm Biopharm200355112513112551713
- LerouxJAllémannEDoelkerEGurnyRNew approach for the preparation of nanoparticles by an emulsification-diffusion methodEur J Pharm Biopharm19954111418
- SchwarzCMehnertWLucksJMüllerRSolid lipid nanoparticles (SLN) for controlled drug delivery. I. Production, characterization and sterilizationJ Control Release19943018396
- GullapalliRShethBInfluence of an optimized non-ionic emulsifier blend on properties of oil-in-water emulsionsEur J Pharm Biopharm199948323323810612034
- PeppasNASahlinJJA simple equation for the description of solute release. III. Coupling of diffusion and relaxationInt J Pharm1989572169172