
Abstract
Background
We have introduced a novel method to quantify the intracellular refractive index (RI) of living cells and determine the molecular interaction of two interacting molecules using single particle spectroscopy. The advantages of this proposed technique over fluorescence-based imaging techniques is that it does not require any contrasting agent and it does not blink and bleach. Instead, our technique provides a non-destructive, non-invasive, high-resolution imaging of live cells.
Methods
To verify our technique, we initially tested our approach for a dielectric medium where gold nanoparticles (AuNPs) were embedded in a polyvinyl alcohol (PVA) matrix, which was then extended to the cellular environment. In the dielectric medium, we identified the single particle and dimer and determined the interparticle distance of AuNPs using confocal laser scattering microscopy. We also determined the single particle RI from dark-field scattering microscopy images, which was confirmed with Mie theory and finite-difference time-domain (FDTD) simulated results. The single particle spectroscopy and microscopy technique was then extended to determine the intracellular RI and biomolecular interaction inside living cells using hyperspectral imaging and dark-field scattering microscopy.
Results
The novelty of the paper lies in the demonstration of a direct and accurate method to probe the intracellular RI and molecular interaction focused on single particle analysis whereas previous demonstrations were based on AuNP ensembles. Optically acquired single particle and dimer images was verified by correlated SEM images also optical spectrum with analytical models and FDTD simulations for both the dielectric and cellular environment. We reported the interparticle distance of AuNPs inside HeLa cells and intracellular refractive index, which was also confirmed with Mie Theory and extensive FDTD simulations.
Conclusion
Moreover, we believe that our in-depth plasmonic NP-based alternate imaging technique will provide a new insight in monitoring cellular dynamics and tracking the targeted NPs within live cells, enabling us to use plasmonic NPs as an intracellular biosensor.
Introduction
Plasmonic nanoparticles (NPs) are superior contrasting agents compared with alternative markers.Citation1 Their absorption and scattering cross-sections are much higher than chemical fluorophore and quantum dots.Citation2–Citation4 Moreover, they are very stable and non-toxic, so they do not blink or bleach. These unique properties make NPs ideal for the investigation of various biologic interactions.Citation2,Citation5–Citation7
Recently, single particle tracking has enabled significant scientific progress in investigating biologic processes by tracking the movement of individually labelled molecules with high spatial and temporal resolution.Citation1,Citation8,Citation9 Also, plasmon coupling offers valuable additional information about the interparticle separation between co-localization, which enables us to experimentally probe the interaction between two interacting molecules.Citation7,Citation8,Citation10–Citation16
The refractive index (RI) of biologic cells plays a crucial role in many applications such as biophysics, biochemistry, and biomedicine to monitor the characteristics of living cells. The living cells contain numerous organelles with different RIs which could alter by any change in the cellular size, nucleus size, protein content, and biologic parameter. Thus, the measurement of RIs could be useful for quantitative study of cellular dynamics,Citation17–Citation19 medical diagnosis and identifying diseases.Citation20,Citation21 Several qualitative and quantitative techniques have been deployed to determine the RIs of biologic cells. Qualitative techniques such as phase contrast microscopyCitation22 and differential interference microscopyCitation23 allow spatial distribution visualization of RIs for individual cells or intracellular organelles in high contrast cellular imaging. Recently, several quantitative techniques have been developed to determine the integral, local, or average RI of single living cells or multiple cells using digital holographic microscopy,Citation17,Citation24,Citation25 optical trapping technique,Citation26 integrated chip technique,Citation27 Hilbert phase microscopy,Citation28 tomographic phase microscopy,Citation29 tomographic bright field microscopy,Citation30 and several interferometry techniques (eg, Rayleigh refractometer, Mach Zehnder, Michelson and Fabry-Perot interferometers).Citation31–Citation33
However, all these conventional methods have their inevitable disadvantages. A major disadvantage of the qualitative technique is that the phase shift information is mixed with intensity information, which makes it difficult to quantify the quantitative information from the acquired images.Citation34 Also, while the interferometric method can determine the RI of homogenous mediums such as liquids and particles, it cannot be used for inhomogeneous matters such as biologic cells.
Additionally, over the past few decades, various microscopy-based techniques such as fluorescence resonance energy transfer (FRET),Citation35,Citation36 image correlation microscopy, (ICM)Citation37 fluorescence correlation spectroscopy,Citation38–Citation43 image correlation spectroscopy,Citation44–Citation48 and fluorescence lifetime imaging (FLIM)Citation35,Citation36,Citation49,Citation50 have been introduced to investigate the molecular activities and interactions at submicroscopic resolution without destroying cells. However, all these techniques have various limitations that are not suitable for living cell imaging. Among them, FRET is constrained to detecting two closely separated (,5 nm) molecules of different types,Citation36,Citation51 while ICM is confined to submicroscopic imaging. Moreover, FRET and ICM are also critically limited by photo bleaching. Unfortunately, FLIM of green fluorescent proteins can only determine the RI in the order of 3 µm length scales. It is also subjected to photo bleaching and has the fleeting lifespan of fluorescence tags.Citation35,Citation36,Citation49,Citation50
To address the deficiencies of the previously discussed techniques, plasmonic NP-based single molecule detection and spectroscopy have been introduced to identify the single molecules which have been utilized to probe the RI of AuNPs inside biologic cells. In this paper, we demonstrate a novel technique which could determine the intracellular RI of biologic cells providing a two-order magnitude better resolution comparing to FLIM based methods. Additionally, the demonstrated method could quantify the accurate interparticle distance between two interacting molecules in cellular environment.
In our study, we performed confocal laser scattering microscopy on a dielectric medium. Gold nanospheres (AuNSs) 80 nm in diameter were dispersed on PVA matrix, spin coated onto a glass slide and then imaged through a 700–900 nm wavelength tunable ultrafast-Femto second laser (Tsunami®; Spectra-Physics, Santa Clara, CA, USA). To confirm the existence of the single particle and cluster, polarization and wavelength dependent single particle spectroscopy and point spread function (PSF) analysis was performed on the dielectric sample. The acquired optical images were correlated with scanning electron microscopy (SEM) images of the same location to determine the existence of single particles and clusters. We also extracted the RI from the experimentally acquired single particle images and validated the results with an analytical model and finite-difference time-domain (FDTD) simulated results. After using single particle spectroscopy on the dielectric sample, we then introduced the technique on cell samples where the pegylated (PEG) AuNSs were attached to HeLa cells. We acquired hyperspectral and dark-field scattering microscopy imaging of live cells and images where the PEG AuNSs were taken up by HeLa cells. Similar to the dielectric sample, single particle spectroscopy and PSF analysis was performed to identify the monomer and cluster. The RI of PEG AuNSs inside HeLa cells was extracted from the experimentally captured images and was finally verified with Mie theory and FDTD simulated results. The extracted RI values were used to simulate dimer and higher order cluster via FDTD simulation, which was compared with the experimentally extracted spectrum to determine the interparticle separation between two macromolecules at furthest and closest distances. The proposed technique will be helpful to probe the RI of PEG AuNPs inside HeLa cells and to quantify the interparticle distance, which will provide deeper insight into the subcellular interaction and signaling activities in the unexplored region.
Analytical models and numerical simulations using FDTD
In our study, we calculated the scattering cross-section of 80 nm diameter AuNSs using the Mie theory and FDTD simulation (). To explore the plasmon coupling of AuNS dimers, we used FDTD Solutions 7.5 (Lumerical Inc., Vancouver, BC, Canada) (). A total-field scattered field source with its wavelength ranging from 400–1,000 nm was used, and a grid resolution of 0.5 nm was chosen to obtain accurate results. The dielectric function of AuNPs was used from Johnson and Christy’s measurement and amended for size effect (surface scattering and radiation damping).Citation52 The source direction was set along the axis of AuNPs. RI n=1.33 was used, and this was further altered to match the simulated spectra with the experimental spectra. Furthermore, we determined the single particle and dimer spectra using FDTD simulation and verified the simulated results with the Mie theory calculated spectra ().
Figure 1 (A) Gold nanoparticle (AuNP) characterization: ultraviolet-visible spectroscopy (UV-Vis) spectrum of 80 nm diameter gold nanospheres (AuNS) compared with Mie theory and finite-difference time-domain (FDTD) simulations. The UV-Vis spectrum is the ensemble spectrum which is slightly red shifted compared to Mie theory and FDTD simulated single particle spectrum. (B) Typical confocal laser scattering point spread function (PSF) profile calculated from the cross-section of one of the areas of scattered intensity and collected with a photomultiplier tube, when the laser is scanned across the sample. The analytical PSF (blue continuous line) from single particles matches perfectly with experimental PSF (red dotted line), whereas the dimer has 1.2 times higher PSF (black dotted line). Red color spectrum indicates analytical PSF using Vectorial Debye theory for objective 1.4 numerical aperture, at 715 nm wavelength for circular polarization. Vectorial Debye theory can be used to calculate the diffraction pattern of an objective lens of high numerical aperture.
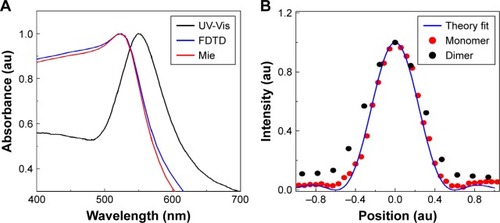
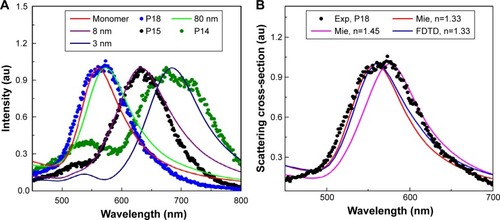
Figure 2 (A) Spectrum analysis of PEG AuNPs internalized HeLa cell images at different locations. P18 (shown in ) matches with Mie theory and FDTD simulated weakly coupled NPs (80 nm separations), confirming that particle as a monomer. P14 and P15 match with FDTD simulated dimers of 3 nm and 8 nm separation. (B) Single particle spectrum (for example P18) was compared with FDTD simulated spectrum (for refractive index n=1.33) and with Mie theory for varying refractive index 1.33–1.5.
Abbreviations: FDTD, finite-difference time-domain; NP, nanoparticle; P, particle; PEG, pegylated; AuNPs, gold nanoparticles.
We also investigated the plasmon coupling of 80 nm diameter AuNS dimers using FDTD simulation for several interparticle distances () and found the red shift in surface plasmon resonance (SPR) peak with decreasing interparticle distance, which is in agreement with the framework of excitation coupling theory.Citation2,Citation7,Citation53,Citation54 The amount of red shift was modeled using the universal plasmon ruler equation, which is comparable to the published results of Kat et alCitation55 and Funston et al.Citation56 It can be observed that plasmon coupling obeys an exponential relationship with the particle separation at weak coupling region, which is known as the universal plasmon ruler equation. However, plasmon resonance peak changes dramatically for small separations in the strong coupling region and matches more closely with a modified plasmon ruler equation.Citation55 The experimentally acquired AuNP spectra was compared with FDTD simulated spectra, which was useful to determine the AuNP separations in dielectric and biologic samples ().
Experimental details
Single particle detection for dielectric samples
Dielectric sample preparation
The 80 nm diameter AuNSs used in this study were purchased from NanoSeedz™ Ltd (Ma On Shan, Hong Kong). The AuNP solution was dispersed 1:1 into an aqueous solution of 2% PVA (molecular weight 36 kDa) to prepare optical density one (1.2×1.010 AuNP/mL) and spin-coated onto a coordinate marked fabricated (5 nm Ti layer) grid attached to a glass slide, with the spin parameters adjusted to produce an approximately 150 nm thick nanorod or PVA film. The use of a PVA layer ensured that the NSs remained attached to the grid during multiple SEM sessions and due to the co-ordinate marked grid, we could correlate the optical and SEM images accurately. The ultraviolet-visible (UV-Vis) spectra of 80 nm diameter AuNSs compared with the Mie theory and FDTD simulations are shown in .
Experimental setup for dielectric sample
To determine the RI inside cells, the single particle and cluster spectrum must be identified. As a simplistic approach, initially we identified the single particle and cluster in a dielectric medium, where the AuNSs were embedded in PVA matrix (). Afterwards, we identified them in biologic samples where the AuNSs were embedded in HeLa cells (). In both cases, we performed hyperspectral and dark-field scattering and recorded the single particle and cluster spectrums which were verified with analytical spectra calculated via Mie theory and FDTD simulated spectra.
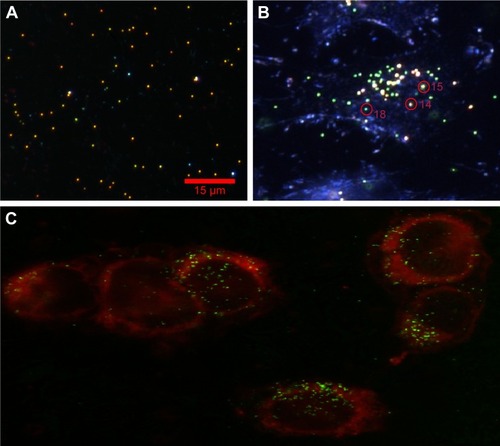
Figure 3 (A) Experimental dark-field scattering microscopy images of 80 nm diameter AuNSs in dielectric medium; and (B) PEG AuNPs embedded in HeLa cells. Distinct color circles represent monomer (P18) and cluster (P14 and P15), and intensity variation is due to various separations. (C) Confocal laser scattering images of PEG AuNPs HeLa cell sample, attached with dye molecules. The red spherical borders are cell membranes, and small colorful spherical particles (eg, red, yellow and green, etc.) are AuNPs.
Abbreviations: AuNSs, gold nano-spheres; PEG, pegylated; AuNPs, gold nanoparticles; P, particle.
The prepared dielectric sample was irradiated with a Tsunami®, Ti:Sapphire femtosecond tunable (700–1,000 nm) laser (Spectra-Physics) and the sample was focused using a 1.4 numerical aperture oil immersion objective lens (Olympus, Sydney, NSW, Australia) and a 50 µm pinhole (Thorlabs Inc., Newton, NJ, USA). The sample was mounted onto a piezo stage for scanning and controlled using Lab-VIEW (National Instruments™, Auckland, New Zealand). An oil immersion medium was used to match the RI to ensure that no background signal was coming from the interface. The resulting scattered NPs were collected using a photomultiplier tube (Oriel® Instruments, Newport Corporation, Irvine, CA, USA) (). A quarter wave plate was used to produce circularly polarized light, and a linear polarizer was used to monitor the polarization dependency at a specific wavelength ().
Figure 4 Correlation of optical and SEM images of 80 nm diameter gold nanospheres.
Notes: (A) Confocal scattering images of an 80 nm diameter AuNS sample, where P1 and P2 are dimer images. (B) Corresponding correlated SEM images, where P1 and P2 are correlated dimer images. Scale bar = 15 µm.
Abbreviations: AuNS, gold nano-spheres; P, particle; SEM, scanning electron microcopy.
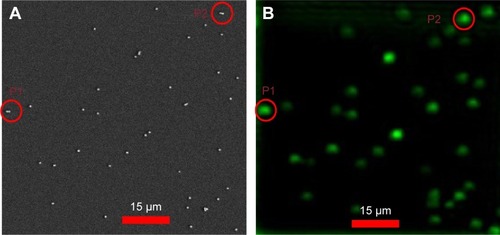
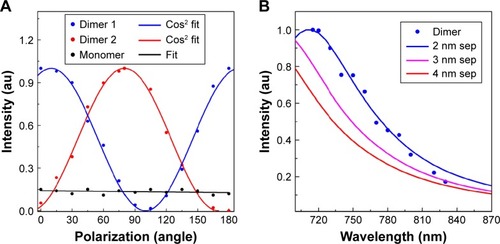
Figure 5 (A) Intensity variation due to polarization (0°–180°) dependency. Experimental values for dimer P1 and P2 (shown in as the dotted points) extracted from polarization dependent images for 0°–180°, matched perfectly with cosine fitting. (B) Wavelength dependency images for dimer particle P1 matched perfectly with finite-difference time-domain simulated dimer spectrum for 2 nm separations.
Abbreviation: P, particle.
Single particle and dimer detection in dielectric samples
To confirm the existence of single particles, we calculated the PSF and line shape of scattering spectra. For the dielectric samples, we also conducted the polarization, wavelength spectroscopy and performed the correlation study between the acquired optical and SEM images. The PSF of the emitted particle was obtained using Vectorial Debye theoryCitation57 (). PSF describes the response of an imaging system to a point source or point object. The scattering spectrum produced a convolution of the focal spot and AuNSs in the sample which acts as a point source. Exploiting the convolution between Gaussian beam and a point scatterer, the Gaussian spot profile of the focusing object, and therefore the PSF of that specific object, can be determined which will provide information about the number of particles within a focal volumeCitation57 (). The experimentally acquired PSF matched perfectly with the analytical PSF calculated using Vectorial Debye Theory,Citation57 which is shown in .
For further verification purposes, we performed the polarization and wavelength dependent microscopy and spectroscopy analysis. In the polarization spectroscopy analysis, polarization dependent images were acquired using a linear polarizer and varying the incident angle from 0°–180° at 15° intervals (). The intensity variation values were plotted against the polarization angle () and compared with cosine fit. It has been observed that most of the particles within an image do not show any polarization dependency (). However, with a change of polarization from 0°–360° few particles show cosCitation2 dependency, confirming the cluster formation (). Nevertheless remaining particles do not show any dependency except for linear dependency. Additionally, we performed the wavelength dependent imaging for 700–900 nm wavelengths using a circular polarizer at 10 nm intervals. Most of the particles’ intensity remained constant with an increase of wavelength due to the dominance of monomers (). However, for a few particles, intensity decreased with an increase of wavelengths in the 700–900 nm spectral range. As an example, particles 4 and 5 corresponded with the FDTD simulated 3 nm and 8 nm separation results (), confirming that they are dimers in nature which is verified by the correlated images (). Therefore, the wavelength dependency imaging not only enables us to identify the dimer but also enables us to determine the interparticle distance between two interacting NPs.
Probing the RI and molecular interaction of AuNPs inside HeLa cells
HeLa cell culture
HeLa cells obtained from Dr Ye Chan and Dr Chiara Paviolo (Sigma Aldrich) were maintained in DMEM (Sigma Aldrich, Sydney, NSW, Australia) and supplemented with 10% (v/v) FBS (Life Technologies Australia Pty Ltd, Melbourne, VIC, Australia), 1% (v/v) glutamine (Life Technologies Australia Pty Ltd) and 0.5% (v/v) amphotericin B (Life Technologies Australia Pty Ltd) in a humidified atmosphere (95% [v/v] air, 5% [v/v] carbon dioxide) at 37°C. Later, the cells (1.5×10⁴ cells/cm2) were trypsinized and seeded on coverslips, which were placed inside a µ-slide chamber (DKSH, Melbourne, VIC, Australia). Samples were incubated for one day at 37°C/5% CO2 to allow cell attachment. To determine the surface charge of PEG AuNP samples, we calculated the zeta potential which is 22.03±2.7 using the Huckel model. The calculated value of pH was found as 8.4 of the PEG HeLa cells. To visualize cell membranes, a DiD lipophilic tracer (Sigma Aldrich) was added with a AuNS sample with the particles at a concentration of 8 µm. AuNP attached HeLa cells samples were incubated for 30 minutes and later fixed with 3.7% (v/v) formalin for 10 minutes, followed by three rounds of washing with PBS for 5 minutes.
AuNP attached cell sample preparation
PEG AuNPs solution was then centrifuged for 15 minutes at 6,000 rpm and the supernatant was discarded adding a similar amount (1 mL) of distilled water to AuNP pellets. Then AuNPs were sonicated for 10 minutes to minimize the aggregation, followed by 30 minutes of UV light exposure (inside a biosafety cabinet) for sterilization purposes.
Optimization of method
We have demonstrated our technique for 80 nm diameter AuNPs, however we believe RI and molecular interaction could be extracted for other sizes and shapes of AuNSs. For the dielectric medium, we mixed the AuNPs with PVA matrix for 6–8 hours, drop cast the AuNP-PVA mixed solution onto a glass slide and spun-coated the sample 3–5 minutes for even distribution of AuNS. The concentration amount that was used for the dielectric sample with optical density one was 1.2×10¹⁰ AuNP/mL while for HeLa cells it was 1.5×10Citation4 cells/cm2. However, the following experimental conditions were found to give best results: (a) best sample diameter of AuNSs: our investigation showed that 80 nm diameter AuNSs provide interesting insights, however further investigation on other shapes and sizes of AuNPs may also yield exciting results. (b) Optimal reaction time: 12–24 hours for PEG AuNSs. (c) Optimal concentration (or amount) of AuNSs: while our concentration for dielectric sample and HeLa cells was 1.2×10Citation10 AuNP/mL and 1.5×10Citation4 cells/cm2, respectively, we believe it will be interesting to find the optimal size, reaction time and concentration as a function of size, shape and geometry of particle.
Cell sample characterization
Cells cultured on coverslips were mounted on a microscopy mounting media (Aquatex Merck Millipore, Melbourne, VIC, Australia). Images of PEG 80 nm diameter AuNSs incubated with HeLa cells were acquired using a dark-field inverted microscope (Nikon Australia Pty Ltd, Sydney, NSW, Australia) with a 1.2–1.3 NA (Nikon Australia Pty Ltd) dark-field condenser and a 0.6–1.3 NA 100× oil immersion objective lens (Nikon Australia Pty Ltd). A 150-watt quartz-halogen aluminum lamp of with a range of 400–2,500 nm wavelength was used for illumination purposes. Samples were mounted on a 10 nm scale resolution automated stage and the scattering images were acquired with a color cooled digital camera (Nikon Australia Pty Ltd) (). The experimentally acquired single particle and dimer spectrum was acquired with the ENVI 4.8 image analysis software (CytoViva, Inc., Auburn, AL, USA), using a spectrometer of 400–1,000 nm wavelength with spectral resolution of 2.8 nm.
Probing the RI and molecular interaction
The extinction spectrum measured by the UV-Vis spectrometer showed that the scattering peaks of 80 nm diameter PEG AuNSs were 552 nm (). We calculated the peak wavelength for 80 nm diameter AuNSs using Mie theory where we considered the RI 1.33 (RI of water) and found the peak at 560 nm. We performed hyperspectral imaging and recorded the PEG AuNS attached HeLa samples. We also recorded and investigated the spectrum of all the particles within the images. We found that spectrum peak varied from 575 nm and above. We presumed that 575 nm is the single particle spectrum of AuNSs inside HeLa cells and the SPR red shifts are due to a change of environment inside HeLa cells. To verify our assumption, we recalculated the single particle spectrum using Mie theory by changing the RI values from 1.3 to 1.5 and observed the SPR peak at 575 nm for RI value 1.45. We also verified the results compared with FDTD simulated spectrum and observed the SPR peak at 575 nm for RI value 1.45. Therefore, it was suggested that due to a change of environment inside HeLa cells our single particle peak (SPR) changed from 560 nm (considering n=1.33) to 575 nm (considering n=1.45).
We believe the change of RI occurs due to internalization of PEG AuNSs inside HeLa cells. To confirm the internalization of PEG AuNSs and identify the location inside HeLa cells, we attached the dye molecules with HeLa cells and identified that PEG AuNSs were internalized inside the cell membrane by performing the scattering microscopy imaging using a z-step of 0.2 µm. To visualize the cell membrane, samples were imaged with a 100× oil immersion objective lens on an inverted confocal microscope (FluoView FV100; Olympus). A red helium-neon laser (633 nm; Newport Corporation) was used to excite the DiD (λEX=644 nm/λEM=665 nm), while a helium-neon laser (543 nm; Newport Corporation) was used to visualize the scattered laser light from the AuNS-HeLa cell complexes (λEX=545 nm/λEM=545±4 nm) ().
However, our reported intracellular RI value 1.45 for PEG AuNS incubated HeLa cells matches with previous results observed on the cell membrane, cytoplasm and nucleus of different types of cells ().Citation58–Citation60 Further, we focused on identifying the molecular interaction between two interacting AuNSs inside HeLa cells. To identify the separation, we simulated the AuNS dimer for varying distances utilizing the previously extracted RI value 1.45. Therefore, we cross-checked the experimentally acquired PEG AuNS attached HeLa cells with the FDTD simulated AuNS dimer spectrum to determine the exact interparticle distance between two interacting AuNSs in the cell membrane. Finally, we determined the exact separation for particles P4 and P5 and found the separation as 3 nm and 8 nm, respectively, which was validated by comparing the experimentally acquired spectrum with the FDTD simulated spectrum ().
Results and discussion
Single particle detection studies have gathered huge interest and they have been extensively used in several applications, including optical labeling and trapping of single particles, biosensing, and as a nano antenna to enhance fluorescence. However, far-field detection of single metal NPs was first utilized in 1998,Citation61 and since then different applications have arisen based on single particles. Although single particle measurement is more difficult and provides low signal to noise ratio compared to ensemble measurement. Contrary to single fluorophore or semiconductor material, a single metal NP does not blink or bleach due to the large number of conduction electrons per particle (ie, typically 10Citation3–10Citation5). They exhibit very stable scattering, luminescence, harmonic emission and photo thermal emission and provide long observation time in microsecond time resolution, which is a major hurdle for organic fluorophore-based technique. Therefore, they are considered best to be used as an optical label over fluorophore or semiconductor quantum dots.
Previous studies have emphasized the ensemble of NPs. However, the key contribution of this work is the solution it provides to detect a single metal NP, and to probe the RI and interparticle distance inside biologic cells. The main advantage of our comprehensive study is that we focused on single particle detection compared with previous indirect measurements which were based on ensembles of AuNPs. Additionally, we have verified our single particle spectroscopy results into dielectric medium by correlating the optical images with SEM images before introducing them into a cellular environment.
In this study, we demonstrated the technique based on single particle analysis to probe the RI and reported the RI value as 1.45 in the cell membrane. Therefore, our observed RI values are in accordance with previously reported RI values for cell membranes (1.46–1.6), cytoplasms (1.35–1.39), and proteins (1.36–1.55).Citation58–Citation60 Previously, the RI of cellular components was investigated on ensembles of NPs with significantly lower spatial resolutions (µm scale). However, in our in-depth investigation, we determined the RI value of a single particle with a higher spatial resolution (nm scale). We believe our reported results will provide the foundation to determine more accurate RI values in the cell membrane, cytoplasm, proteins, and nucleus of several types of cells for various shapes and geometries of NPs or other biomolecules. Therefore, our direct single particle-based RI measurement approach will open new avenues to optically trap and detect the molecules without labeling them by using high numerical aperture objective lenses and maximizing the gradient force. Additionally, RI values will be useful to simulate the coupled NPs more precisely and determine the exact separation distance inside living cells, thus providing accurate spectra ().
Although RI is not a common marker for cellular studies, possible introduction of precise intracellular RI sensors could give extra dimensions to studies of cell morphology and dynamics. On the other hand, the advantages of hyper-spectral imaging over confocal laser scattering microscopy is it does not require a sophisticated experimental setup, which includes a high-power incident light source, expensive detector, spectrometer and high numerical aperture, as only a spectrometer and normal light microscope is sufficient. Also, the white light is not destructive compared to high power laser. There is no analytical model available for coupled NPs or different shapes of NPs, however the limitations can be overcome by comparing the experimental spectrum with numerically simulated spectra performed by FDTD. Regardless of the few limitations, this technique provides a good starting point for discussion and further research to investigate single particle tracking, biosensing, probing intracellular refractive indexes, and monitoring molecular activities and interaction in live cells. Overall, our comprehensive investigation demonstrated a novel approach for determining the intracellular refractive index, monitoring cellular dynamics and interactions, and tracking of targeted NPs within living cells.
Conclusion
In conclusion, we demonstrated a novel technique to quantify the intracellular RI using single particle spectroscopy. We also determined the plasmon coupling of AuNS dimers, which was used to determine the interparticle distance between two interacting AuNSs embedded in PVA matrix and HeLa cells. Before introducing the single particle technique into the cellular environment, we tested our approach in a dielectric medium. We performed the confocal laser scattering microscopy and dark field scattering microscopy respectively for AuNSs embedded PVA matrix sample and AuNSs attached HeLa cell sample and identified the single particle and dimer. For both cases, the experimental results was validated with analytical results (Mie theory) and FDTD simulated spectra, which has been used to quantify the intracellular RI and molecular interaction. The novelty of this paper lies in the presentation of a systematic study of single particle spectroscopy to identify the single particle and dimer, probe the intracellular RI of AuNSs, and determine the exact interparticle distance of two interacting AuNSs in HeLa cells. The results were verified by analytical models, extensive FDTD simulations, and rigorous experimental study. Through our in-depth investigation, we have developed a novel imaging technique that utilizes plasmonic NPs to acquire imaging of the subcellular region of live cells through single particles. This technique will facilitate the improvement of optical properties for modeling cells and tissues, monitoring of cellular dynamics, and long-term tracking of targeted NPs within cells.
Acknowledgments
The authors would like to thank Swinburne University of Technology, Australia for the research facilities. The authors also thank Dr Ye Chan and Dr Chiara Paviolo (Sigma Aldrich, Sydney, NSW, Australia) for the HeLa cells used in this study.
Disclosure
The authors report no conflicts of interest in this work.
References
- HuangXJainPKEl-SayedIHEl-SayedMAGold nanoparticles: interesting optical properties and recent applications in cancer diagnostics and therapyNanomedicine20072568169317976030
- El-SayedIHHuangXEl-SayedMASurface plasmon resonance scattering and absorption of anti-EGFR antibody conjugated gold nanoparticles in cancer diagnostics: applications in oral cancerNano Lett20055582983415884879
- ZijlstraPChonJWGuMFive-dimensional optical recording mediated by surface plasmons in gold nanorodsNature2009459724541041319458719
- SönnichsenCReinhardBMLiphardtJAlivisatosAPA molecular ruler based on plasmon coupling of single gold and silver nanoparticlesNat Biotechnol200523674174515908940
- AaronJTravisKHarrisonNSokolovKDynamic imaging of molecular assemblies in live cells based on nanoparticle plasmon resonance couplingNano Lett20099103612361819645464
- MohsinASMAggregation and uptake kinetics of gold nanoparticles in biological cells, using plasmon coupling and image correlation spectroscopy [PhD thesis]MelbourneSwinburne University of Technology2015
- JainPKHuangWEl-SayedMAOn the universal scaling behavior of the distance decay of plasmon coupling in metal nanoparticle pairs: a plasmon ruler equationNano Lett20077720802088
- CrowMJSeekellKOstranderJHWaxAMonitoring of receptor dimerization using plasmonic coupling of gold nanoparticlesACS Nano20115118532854021999459
- MurphyCJGoleAMStoneJWGold nanoparticles in biology: beyond toxicity to cellular imagingAcc Chem Res200841121721173018712884
- AaronJNitinNTravisKPlasmon resonance coupling of metal nanoparticles for molecular imaging of carcinogenesis in vivoJ Biomed Opt200712303400703401117614715
- FunstonAMNovoCDavisTJMulvaneyPPlasmon coupling of gold nanorods at short distances and in different geometriesNano Lett2009941651165819271775
- KreibigUVVolmerMOptical Properties of Metal ClustersBerlinSpringer-Verlag Berlin Heidelberg1995
- MohsinASMSalimMBProbing the plasmon coupling, quantum yield, and effects of tip geometry of gold nanoparticle using analytical models and FDTD simulationIEEE Photonics J2018103110
- ReinhardBMSiuMAgarwalHAlivisatosAPLiphardtJCalibration of dynamic molecular rulers based on plasmon coupling between gold nanoparticlesNano Lett20055112246225216277462
- WangHRongGYanBYangLReinhardBMOptical sizing of immunolabel clusters through multispectral plasmon coupling microscopyNano Lett201111249850421247191
- SönnichsenCReinhardBMLiphardtJAlivisatosAPA molecular ruler based on plasmon coupling of single gold and silver nanoparticlesNat Biotechnol200523674174515908940
- RappazBMarquetPCucheEEmeryYDepeursingeCMagistrettiPMeasurement of the integral refractive index and dynamic cell morphometry of living cells with digital holographic microscopyOpt Express200513239361937319503137
- BistaRKUttamSWangPQuantification of nanoscale nuclear refractive index changes during the cell cycleJ of Biomedical Optics2011167070503
- SuissaMPlaceCGoillotEFreyssingeasEInternal dynamics of a living cell nucleus investigated by dynamic light scatteringEur Phys J E Soft Matter200826443519230214
- BackmanVWallaceMBPerelmanLTDetection of preinvasive cancer cellsNature20004066791353610894529
- SubramanianHPradhanPLiuYPartial-wave microscopic spectroscopy detects subwavelength refractive index fluctuations: an application to cancer diagnosisOpt Lett200934451852019373360
- ZernikeFPhase contrast, a new method for the microscopic observation of transparent objectsPhysica194297686698
- NomarskiGMicrointerféromètre différentiel ondes polariséesJ Phys Radium195516169S11S
- KemperBCarlDDSchnekenburgerJInvestigation of living pancreas tumor cells by digital holographic microscopyJ of Biomedical Optics2006113034005
- JerichoMHKreuzerHJKankaMRiesenbergRQuantitative phase and refractive index measurements with point-source digital in-line holographic microscopyAppl Opt201251101503151522505068
- GhoshNBuddhiwantPUppalAMajumderSKPatelHSGuptaPKSimultaneous determination of size and refractive index of red blood cells by light scattering measurementsAppl Phys Lett2006888084101
- LiangXJLiuAQLimCSAyiTCYapPHDetermining refractive index of single living cell using an integrated microchipSens Actuators A Phys20071332349354
- LueNChoiWPopescuGLive cell refractometry using Hilbert phase microscopy and confocal reflectance microscopyJ Phys Chem A200911347133271333019803506
- ChoiWFang-YenCBadizadeganKTomographic phase microscopyNat Methods20074971771917694065
- PhillipsKGJacquesSLMccartyOJMeasurement of single cell refractive index, dry mass, volume, and density using a transillumination microscopePhys Rev Lett20121091111810523005682
- SørensenHSPranovHLarsenNBBornhopDJAndersenPEAbsolute refractive index determination by microinterferometric backscatter detectionAnal Chem20037581946195312713055
- NetoRBSde MendonçaJPRFLescheBDetermination of absolute values of refractive index of liquids using an interferometric methodRevista de Física Aplicada e Instrumentação2004177479
- LunazziJJGaravagliaMFabry-Perot laser interferometry to measure refractive index or thickness of transparent materialsJ Phys E197363237240
- CurlCLBellairCJHarrisPJQuantitative phase microscopy: a new tool for investigating the structure and function of unstained live cellsClin Exp Pharmacol Physiol2004311289690115659056
- ElizabethAJEThomasMJImaging molecular interactions in living cells by FRET microscopyCurr Opin Chem Biol200610540941616949332
- TsienRYBacskaiBJAdamsSRRogerYTBrianJBStephenRAFRET for studying intracellular signallingTrends Cell Biol19933724224514731760
- ClaytonAHAWalkerFOrchardSGLigand-induced dimer-tetramer transition during the activation of the cell surface epidermal growth factor receptor-A multidimensional microscopy analysisJ Biol Chem200528034303923039915994331
- PalmerAGThompsonNLArthurGPNancyLTFluorescence correlation spectroscopy for detecting submicroscopic clusters of fluorescent molecules in membranesChem Phys Lipids1989503–42532702548747
- QianHOn the statistics of fluorescence correlation spectroscopyBiophys Chem1990381–249572085652
- ThompsonNLFluorescence correlation spectroscopyTopics in Fluorescence SpectroscopyLakowiczJR1New YorkTechniques Plenum Press199153176
- QianHElsonELFluorescence correlation spectroscopy with high-order and dual-color correlation to probe nonequilibrium steady statesProc Natl Acad Sci U S A200410192828283314970342
- MedinaMASchwillePFluorescence correlation spectroscopy for the detection and study of single molecules in biologyBioessays200224875876412210537
- SenguptaPGaraiKBalajiJPeriasamyNMaitiSMeasuring size distribution in highly heterogeneous systems with fluorescence correlation spectroscopyBiophys J20038431977198412609900
- WisemanPWPetersenNOImage correlation spectroscopy. II. Optimization for ultrasensitive detection of preexisting platelet-derived growth factor-beta receptor oligomers on intact cellsBiophys J19997629639779916027
- CostantinoSComeauJWKolinDLWisemanPWAccuracy and dynamic range of spatial image correlation and cross-correlation spectroscopyBiophys J20058921251126015923223
- CiccotostoGDKozerNChowTTChonJWClaytonAHAggregation distributions on cells determined by photobleaching image correlation spectroscopyBiophys J201310451056106423473488
- PetersenNOBrownCKaminskiARocheleauJSrivastavaMWisemanPWAnalysis of membrane protein cluster densities and sizes in situ by image correlation spectroscopyFaraday Discuss1998111111289305
- SergeevMHigh order autocorrelation analysis in image correlationsPhD thesisCanada, Montreal, QuebecMcGill University2004
- BijuVMuraleedharanDNakayamaKQuantum dot-insect neuropeptide conjugates for fluorescence imaging, transfection, and nucleus targeting of living cellsLangmuir20072320102541026117718524
- ClaytonAHWalkerFOrchardSGLigand-induced dimer-tetramer transition during the activation of the cell surface epidermal growth factor receptor-A multidimensional microscopy analysisJ Biol Chem200528034303923039915994331
- Jares-ErijmanEAJovinTMElizabethAJEThomasMJImaging molecular interactions in living cells by FRET microscopyCurr Opin Chem Biol200610540941616949332
- PeterBJRW COptical constants of the noble metalsPhysical Review B19726124370
- JainPKEustisSEl-SayedMAPlasmon coupling in nanorod assemblies: optical absorption, discrete dipole approximation simulation, and exciton-coupling modelJ Phys Chem B200611037182431825316970442
- LinkSMohamedMBEl-SayedMASimulation of the optical absorption spectra of gold nanorods as a function of their aspect ratio and the effect of the medium dielectric constantJ Phys Chem B19991031630733077
- KatCWLeiSHuanjunCYaoLJiangfangWHaiQLObservation of the Fano resonance in gold nanorods supported on high-dielectric-constant substratesAcs Nano2011575976598621702485
- FunstonAMDavisTJNovoCMulvaneyPCoupling modes of gold trimer superstructuresPhilos Trans A Math Phys Eng Sci201136919503472348221807722
- MinGAdvanced optical imaging theory Springer Series in Optical SciencesBerlinSpringer-Verlag Berlin Heidelberg19993769
- BeuthanJMinetOHelfmannJHerrigMMüllerGThe spatial variation of the refractive index in biological cellsPhys Med Biol19964133693828778819
- MeyerRALight scattering from biological cells: dependence of back-scatter radiation on membrane thickness and refractive indexAppl Opt197918558558820208772
- XiaoSDrachevVPKildishevAVLoss-free and active optical negative-index metamaterialsNature2010466730773573820686570
- LuHPXunLXieXSSingle-molecule enzymatic dynamicsScience19982825395187718829836635