
Abstract
Background
Hepatocellular carcinoma (HCC) is the most common primary liver cancer and severely threatens human health. Since the prognosis of advanced HCC remains poor, there is an urgent need to develop new therapeutic approaches. Porphyrin metal-organic frameworks are a class of porous organic-inorganic hybrid functional materials with good biocompatibility.
Methods
Gadolinium-porphyrin metal-organic frameworks were used as a skeleton for folic acid (FA) conjugation to synthesize a novel type of nanoparticle, denoted as folic acid-nanoscale gadolinium-porphyrin metal-organic frameworks (FA-NPMOFs). The FA-NPMOFs were characterized using transmission electron microscopy, Fourier transform infrared spectroscopy and thermogravimetric-differential thermal analysis. The biotoxicity and imaging capability of the FA-NPMOFs were determined using HepG2 cells and embryonic and larval zebrafish. The delivery and photodynamic therapeutic effect of FA-NPMOFs were explored in transgenic zebrafish with doxycycline-induced HCC.
Results
FA-NPMOFs were spherical in structure with good dispersion and water solubility. They showed low biotoxicity, emitted bright red fluorescence, and exhibited an excellent magnetic resonance imaging capability, both in vitro and in vivo. Meanwhile, the FA-NPMOFs exhibited a strong affinity for folate receptor (FR)-expressing cells and were delivered to the tumor site in a targeted manner. Moreover, HCC tumor cells were eliminated following laser irradiation.
Conclusion
FA-NPMOFs can be used for dual-modality imaging and photodynamic therapy in HCC and show promise for use as a carrier in new therapies for HCC and other FR-positive tumors.
Introduction
Hepatocellular carcinoma (HCC), arising from hepatocytes, is the most common primary liver cancer. Although the outcome of HCC diagnosed at an early stage has improved due to the implementation of screening procedures and advances in imaging, the prognosis of advanced HCC remains poor. Therefore, it is imperative to develop novel therapeutic approaches for HCC.Citation1,Citation2 Zebrafish is currently considered as one of the most useful models for studying human diseases, including cancers. Zebrafish are oviparous organisms with external fertilization, transparent eggs, and temporospatial development pattern.Citation3–Citation6 Studies have revealed that zebrafish can spontaneously develop a variety of tumors, which can be induced either by chemical mutagen exposure or with transgenic techniques.Citation7 Several models have been generated successfully, including models of leukemia, melanoma, and rhabdomyosarcoma.Citation8,Citation9 Among them, the transgenic line Tg (fabp10:rtTA2s-M2; TRE2:EGFP-krasG12V) (krasG12V) serves as an ideal model for investigating HCC. krasG12V fish are tetracycline-inducible (Tet-on) transgenic fish expressing oncogenic enhanced green fluorescent protein (EGFP)-krasG12V specifically in the liver. By treatment with doxycycline, robust and homogeneous liver tumors can be induced in krasG12V fish. Moreover, the developed liver tumors resemble human HCC in both molecular biology and histopathology.Citation10,Citation11
Folic acid (FA), also known as vitamin B9, is a nutrient required by all living cells for nucleotide synthesis and cell growth. FA functions by binding to its specific receptor, folate receptor (FR). FR is a glycoprotein that captures its ligand from the extracellular milieu and transports it inside the cell via endocytic mechanisms. Under physiologic conditions, the FR expression level is very low on the surface of normal cells. Nevertheless, FR is overexpressed in several epithelial cancer tissues, such as ovarian, breast, cervical, colorectal, renal, and nasopharyngeal cancer, compared to the normal corresponding tissues.Citation12,Citation13 Hence, FA can be used as a targeting ligand for tumor-specific drug delivery.Citation14 Metal-organic frameworks (MOFs) are a class of porous organic–inorganic hybrid functional materials composed of metal ions and organic ligands.Citation15,Citation16 Porphyrin MOFs (PMOFs), consisting of porphyrin and metal ions, circumvent the hydrophobic nature and aggregation of porphyrin while retaining its photophysical properties. PMOFs not only have good biocompatibility and dispersion but also emit bright red fluorescence.Citation17,Citation18 Meanwhile, PMOFs can also be used as a photosensitizer and have been used in photodynamic therapy (PDT).Citation19 Gadolinium (Gd) compounds are widely used as contrast media for magnetic resonance imaging (MRI) because Gd3+ ions have a long electronic relaxation time, which enhance the T1-weighted MRI contrast.Citation20 Recently, imaging-guided therapy systems further integrate visualization technology to exert the combination of imaging and therapy.Citation21 However, there is still a lack of knowledge about Gd-based antitumor effect.
In the present study, nanoscale gadolinium-porphyrin MOFs (NPMOFs) were synthesized and used as a skeleton for FA conjugation and preparation of a novel type of nanoparticle, folic acid-nanoscale gadolinium-porphyrin metal-organic frameworks (FA-NPMOFs). Subsequently, we determined the following properties of the FA-NPMOFs: 1) physical and chemical characteristics; 2) cytotoxicity and in vitro fluorescence imaging capability; 3) in vivo toxicity and fluorescence and MRI capability in zebrafish embryos and larvae; and 4) capability for selective accumulation and PDT in HCC in krasG12V zebrafish. Our study not only evaluated the biotoxicity of FA-NPMOFs but also broadened their potential applications in HCC by demonstrating their capability for dual-modality imaging and PDT.
Materials and methods
Cell culture
Human HCC HepG2 cells and L02 hepatocytes were purchased from ATCC and Beijing Union Medical College Hospital, respectively. The use of L02 cell line was approved by the Institutional Ethics Committee at Nankai University. HepG2 cells and L02 cells were cultured in complete DMEM (Biological Industries [BI], Israel) and complete Roswell Park Memorial Institute 1640 medium (BI), respectively, containing 10% (v/v) FBS (BI) and 1% penicillin–streptomycin (Thermo Scientific, Waltham, MA, USA). All cells were incubated at 37°C with 5% CO2.
Experimental animals
Wild-type zebrafish (AB strain) and krasG12V transgenic zebrafish (a kind gift from Dr Gong) were used in this study. Fish were raised at 28.5°C with a 10-hour dark/14-hour light cycle.Citation22 Wild-type embryos were incubated in E3 medium (5 mmol/L NaCl, 0.17 mmol/L KCl, 0.33 mmol/L CaCl2, 0.33 mmol/L MgSO4, pH 7.2) and staged by hours post fertilization (hpf), days post fertilization (dpf), and months post fertilization (mpf). All protocols involving animals were approved by the Institutional Animal Care Committee at Nankai University and conformed to the National Institutes of Health Guidelines.
Reagents
All reagents were of at least analytical grade. The reagents used were as follows: cetyltrimethylammonium bromide (CTAB; Fu Chen Reagent Co., Ltd., Tianjin, China); polyetherimide (PEI, molecular weight =10,000; Fu Chen); 5,10,15,20-tetrakis(4-carboxyl)-21H,23H-porphine (TCPP; TCI Chemical Development Co., Ltd., Shanghai, China); gadolinium trichloride (GdCl3; Alfa-Asha, Tianjin, China); 1-ethyl-3-(3-dimethylaminepropyl) carbodiimide (EDC; Aladdin, Shanghai, China); N-hydroxysuccinimide (NHS; Aladdin); FA (Shanghai Bu Bai Chemical Technology Co., Ltd., Shanghai, China); and N,N-dimethylformamide (DMF) and anhydrous ethanol (Concord Technology Co., Ltd., Tianjin, China).
Preparation of FA-NPMOFs
The FA-NPMOFs were prepared as follows: 8 mg of TCPP and 150 mg of CTAB were added and dissolved in 10 mL of DMF and heated to 110°C under vigorous stirring in a 50 mL beaker. Then, 6.8 mg of GdCl3 was dissolved in 5 mL of DMF and subjected to ultrasonic treatment (KQ2200; Kunshan Ultrasonic Instruments Co., Ltd., China) for 5 minutes, followed by the addition of porphyrin and another 10 minutes of sonication. Subsequently, 5 mg of PEI was dissolved in 5 mL of DMF and dispersed by 5 minutes of ultrasound treatment. Pre-MOFs were then added into the above mixture, allowed to react for 10 minutes, and removed from heat. When the temperature of the reaction system reached the room temperature, the precipitate was dispersed in 10 mL of DMF, stirred, and dissolved thoroughly in a 50 mL round-bottom flask. Then, the solution was centrifuged at 12,000 rpm for 5 minutes. The supernatant was discarded, and 25 mg of EDC, 11.2 mg of NHS, and 44 mg of FA (at a molar ratio of 1.2:0.5:1) were dissolved in 10 mL of DMF overnight. After centrifugation, the supernatant was discarded, and the precipitate was washed twice with DMF, ethanol, and water to obtain a purple-red powder. The washed powder was lyophilized to obtain FA-NPMOFs.
Characterization of the FA-NPMOFs
The morphology of the FA-NPMOFs was characterized using a transmission electron microscopy (TEM, accelerating voltage =200 kV; JEM100CXII, JEOL Japan Electronics Co., Ltd., Japan). The functionalization of the FA-NPMOFs was characterized by Fourier transform infrared spectroscopy (FTIR; 400–4,000 cm−1) on a Tensor 27 Fourier infrared spectrometer (Bruker, Germany) and thermogravimetric-differential thermal analysis (TG-DTA). TG-DTA measurements were obtained in air heated from 20°C at a ramp rate of 10°C min−1 in a PTC-10ATG-DTA thermal analyzer (Thermo plus EVO2 TG8121, Rigaku Co., Ltd., Japan). The optical properties of the FA-NPMOFs were determined by UV-Vis spectroscopy (U-3900 spectrophotometer, Hitachi, Japan). The steady-state fluorescence was performed on spectroscopy (FL-4600 fluorescence spectrometer; Hitachi, Japan) equipped with a plotter unit and a quartz cell (1×1 cm). The excitation and emission spectral slit width was 10 nm.
In vitro cytotoxicity assay
HepG2 cells and L02 cells were plated into 96-well plates at 4×10³ cells per well and incubated with 100 µL of cell culture medium or FA-NPMOFs (25, 50, 100, 200, and 400 µg/mL) for 6 hours. For the PDT test, HepG2 cells were then irradiated with a 655 nm laser for 10 minutes (300 mW cm−2). In vitro cytotoxicity was detected with an MTT kit (Keygen Biotech, Jiangsu, China) according to the manufacturer’s instructions. Three parallel replicates were measured for each sample. The absorbance (OD value) at a wavelength of 560 nm was measured using a microplate reader (Promega, Madison, WI, USA) to calculate the survival rate. In addition, HepG2 cells were plated into a six-well plate and incubated with 2 mL FA-NPMOFs at a concentration of 200 µg/mL for 3 hours. After removing FA-NPMOFs, cells were incubated in cell culture medium and the content of Gd3+ was measured in the supernatant at 3, 6, and 12 hours, respectively. The release efficiency was then calculated to evaluate the in vitro release of FA-NPMOFs.
In vitro biologic imaging
HepG2 cells were seeded in a 24-well plate at a density of 4×10⁴ in 500 µL/well and cultured for 24 hours. To assess the biologic imaging capability of the FA-NPMOFs at different concentrations, the HepG2 cells were cultured with fresh DMEM containing FA-NPMOFs at 400, 200, 100, 50, and 25 µg/mL for 3 hours. FA-NPMOF-free cells were considered the control group. NPMOFs-incubated HepG2 cells (at concentrations of 400, 200, and 100 µg/mL) were set as the negative control. The cells were washed with 0.1 M PBS (pH 7.2), fixed with 4% paraformaldehyde (PFA) for 20 minutes, and stained with DAPI (diluted at 1:1,000; Sigma-Aldrich Co., St Louis, MO, USA) for 15 minutes. After being washed with PBS-0.1% Tween three times for 5 minutes each, the cells were sealed with mounting medium. Confocal fluorescence images were captured using an FV 1000 confocal microscope (Olympus Corporation, Tokyo, Japan). Red fluorescence images of FA-NPMOFs were captured using 559 nm excitation; blue fluorescence of the DAPI staining was acquired using 405 nm excitation.
Aqueous exposure and fluorescence imaging of zebrafish embryos and larvae
Aqueous exposure was carried out according to the guidelines of the Organization for Economic Cooperation and Development.Citation22,Citation23 For in vivo fluorescence imaging, wild-type embryos were placed in a 12-well plate (50 embryos in 3 mL of solution/well) at 1 hpf and were soaked with FA-NPMOF-E3 medium at a concentration of 400, 200, 100, and 50 µg/mL. The same number of embryos was raised in only E3 medium as the control group. After continuous incubation for 5 hours, the embryos were returned to E3 medium. Fluorescence images of the embryos were captured with a DP72 camera mounted on an SZX16 stereomicroscope (Olympus Corporation). To observe the tissue distribution of FA-NPMOFs in larvae, wild-type fish were incubated in FA-NPMOF-Holt buffer (3.5 g/L NaCl, 0.05 g/L KCl, 0.025 g/L NaHCO3, 0.1/L CaCl2, pH 7.2) at a concentration of 200 µg/mL at 5 dpf. After 12 hours of aqueous exposure, larvae were observed under a BX51 fluorescence microscope (Olympus Corporation) every 12 hours. Larvae incubated in Holt buffer alone were used as the control group. The above aqueous exposure experiments were repeated three times.
MRI
A total of 100 embryos from each FA-NPMOF-exposed group were packed into a 1.5 mL Eppendorf tube and placed in the MRI system (1.2 T; Huantong Corporation, Shanghai, China). T1-weighted images were captured along the horizontal and sagittal planes. Juvenile fish were anesthetized in 0.016% tricaine, euthanized immediately, and then placed in a 1.5 mL Eppendorf tube to obtain T1-weighted images along the sagittal plane. The MRI parameters were TR/TE =9.7/3.0 milliseconds, flip angle =13°, field of view =100×100 mm2, matrix =256×256, slice thickness =1 mm without gaps, and 30°C.
Induction of HCC in krasG12V zebrafish
At 1 mpf, krasG12V fish were treated with doxycycline (D989 1-25 G-9; Sigma-Aldrich Co.) in the system water at a concentration of 60 µg/mL for 15 days in the dark.Citation10 At 9 AM each day, the juveniles were allowed a 30-minute interval in doxycycline-free system water and were fed with shrimp. Then, the fish were again treated with fresh doxycycline solution.
Treatment of HCC-bearing zebrafish with FA-NPMOFs and PDT
HCC-bearing krasG12V fish were treated with FA-NPMOF-Holt buffer at a concentration of 200 µg/mL. Samples were collected at 24, 48, 72, and 96 hours post treatment (hpt). Wild-type fish were also treated with FA-NPMOF-Holt buffer to discern the potential toxicity of FA-NPMOFs at the same time points. For negative control, HCC-bearing krasG12V fish were treated with NPMOF-Holt buffer at a concentration of 200 µg/mL and collected at 24, 48, and 96 hpt. For the PDT test, HCC-bearing fish were irradiated with a 655 nm laser for 10 minutes (300 mW/cm2) after soaking in 200 µg/mL FA-NPMOFs for 48 hours. HCC-bearing fish soaked in a doxycycline solution were used as the control group.
Small animal imaging
Following FA-NPMOF treatment, HCC-bearing fish were anesthetized in 0.016% tricaine (A5040; Sigma-Aldrich Co.) and euthanized immediately. Thermal imaging was performed along the sagittal section using a NightOWL LB 983 small animal in vivo imaging system (Berthold Technologies, Germany) with the following parameters: Ex =530 nm, Em =660 nm, and exposure time =0.1 second.
Histology and immunohistochemistry
Fish were anesthetized in 0.016% tricaine and euthanized immediately. The liver was dissected, fixed in 4% PFA at 4°C overnight, and then embedded in paraffin. Sagittal sections were prepared at a thickness of 5 µm. H&E staining was performed using a standard protocol.Citation24 The livers from HCC-bearing zebrafish were then collected and serially cryosectioned at a thickness of 8 µm. Immunohistochemistry was performed as previously described.Citation25 For immunofluorescence staining, L02 cells or HepG2 cells were seeded into a 24-well plate at a density of 4×10⁴ in 500 µL/well for growth on glass coverslips. The cells were washed 3 times with 0.1 M PBS containing 0.5% Triton X-100 for 5 minutes, fixed in 4% PFA for 20 minutes, and stained using standard protocols.Citation26 The primary antibody used in this study was anti-FR antibody (1:50; sc-28997, Santa Cruz Biotechnology Inc., Dallas, TX, USA). The secondary antibody was a Cy3-labeled antibody (1:200; Merck Millipore, Billerica, MA, USA). DAPI was used to counterstain the nuclei. Images of immunostaining were captured using an FV 1000 confocal microscope (Olympus Corporation).
Statistical analysis
GraphPad Prism software (version 6.0; GraphPad Software, Inc., La Jolla, CA, USA) was used for the statistical analysis. The viability of cells, the survival rate, and the hatching rate of the zebrafish embryos are expressed as a percentage (mean ± SEM) of three replicates. Before performing the threshold processing, ImageJ software (1.49×, NIH, http://rsb.info.nih.gov/ij/) was used to convert the immunostaining images into 8-bit grayscale images. Statistical analysis of differences among groups was performed by one-way ANOVA. P-values <0.05 were considered statistically significant.
Results
Synthesis and characterization of FA-NPMOFs
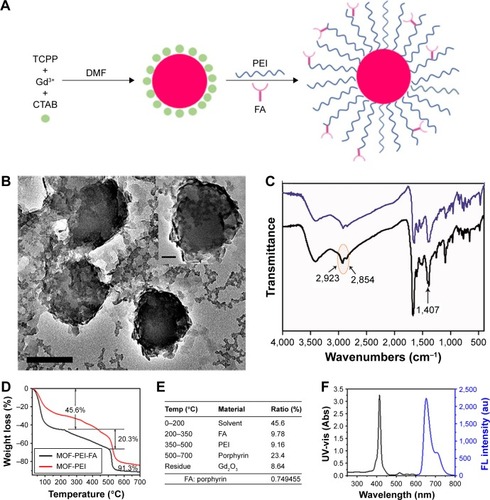
shows a schematic illustration of the procedure for preparing FA-NPMOFs. TEM images () revealed the structure of the FA-NPMOFs to be spherical and ~200 nm in diameter with an outer PEI coating layer ~15 nm thick. FTIR showed a peak at 1,407 cm−1 from the C−N amide bonds of FA (, arrow) and peaks at 2,854 and 2,923 cm−1 due to the stretching vibrations of C−H of PEI (, circle and arrows). These findings demonstrate the immobilization of FA. The composition of the FA-NPMOFs was further characterized by thermogravimetric analysis (TGA) (). The molar ratio of FA-to-porphyrin was ~0.75:1, which shows the grafting rate of FA. The emission and excitation wavelengths of the UV absorbance (, black line) and normalized fluorescence (, blue line) provided a basis for biologic imaging. The zeta potential of NPMOFs was −18.3 mV, whereas that of the NPMOF@PEI was 21.3 mV. The conjugation with FA decreased the positive charge to 19.58 mV (). The above data suggest that the FA-NPMOFs were synthesized successfully.
Figure 1 Synthesis and characterization of FA-NPMOFs.
Notes: (A) Schematic illustration of FA-NPMOF synthesis. (B) Transmission electron microscopy images. (C) NPMOF (purple) and FA-NPMOF (black) composition determined by Fourier transform infrared spectroscopy. (D) TGA of NPMOFs and FA-NPMOFs. (E) FA-NPMOF composition determined by TGA. (F) UV-vis absorbance (black) and normalized fluorescence (blue, λex =530 nm). Scale bar in (B) 200 nm and 50 nm (inset).
Abbreviations: DMF, N,N-dimethylformamide; FA-NPMOF, folic acid-nanoscale gadolinium-porphyrin metal-organic framework; PEI, polyetherimide; TCPP, 5,10,15,20-tetrakis(4-carboxyl)-21H,23H-porphine; CTAB, cetyltrimethylammonium bromide.
FA-NPMOFs show bright in vitro fluorescence and low cytotoxicity
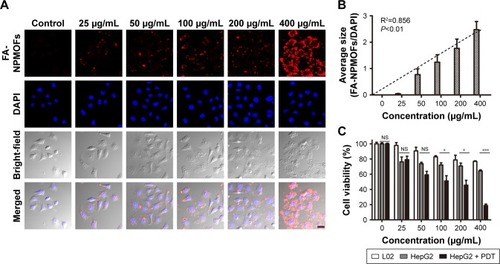
First, we checked the expression of FR in HCC cells by immunohistochemistry using L02 cells as the negative control. No positive signal was detected in L02 cells (). In contrast, FR was strongly expressed in the membrane and cytoplasm of HepG2 cells (),Citation27,Citation28 indicating the overexpression of FR in HepG2 cells. To test the in vitro imaging capability of the FA-NPMOFs, HepG2 cells were incubated with FA-NPMOFs at different concentrations. Following 3 hours of incubation, the red fluorescence signals were detected and intensified with increasing FA-NPMOF concentration; positive signals were localized in the cytoplasm rather than the nucleus (). In negative control group, weak fluorescence was detected in the cytoplasm in NPMOF-incubated HepG2 cells (). To further quantify this finding, we scored the ratio between the area of FA-NPMOF-positive signals and the area of nuclei (stained by DAPI) in each group. These results showed that FA-NPMOF fluorescence occurred in a dose-dependent manner (). Moreover, similar cell shape was observed in cell groups (five exposed and one control group). The MTT assay was then performed to assess the in vitro toxicity and PDT effect of FA-NPMOFs. No significant difference in viability was found between the L02 and HepG2 groups at any concentration (). The viability of HepG2 cells following laser irradiation (HepG2 + PDT) at higher treatment concentrations (100, 200, and 400 µg/mL) was significantly decreased compared to L02 and HepG2 cells (; ANOVA, *P<0.05, ***P<0.001). The in vitro release experiment showed that the FA-NPMOFs were released gradually (). Together, these data indicate that FA-NPMOFs not only have low cytotoxicity with a sufficient capability for cellular imaging but also enable PDT to eliminate cancer cells in vitro.
Figure 2 In vitro cytotoxicity of FA-NPMOFs.
Notes: (A) Fluorescence images of HepG2 cells; red signals are from FA-NPMOFs, blue signals are from DAPI staining. Note that the FA-NPMOFs are localized at the membrane and in the cytoplasm. (B) Statistical analysis of fluorescence intensity in the control and FA-NPMOF-exposed groups. (C) Statistical analysis of viability of L02 cells treated with FA-NPMOFs (white), HepG2 cells treated with FA-NPMOFs (gray), and HepG2 cells treated with FA-NPMOFs and photodynamic therapy (black). Scale bar in (A): 20 µm. *P<0.05, ***P<0.001.
Abbreviation: FA-NPMOF, folic acid-nanoscale gadolinium-porphyrin metal-organic framework; PDT, photodynamic therapy; NS, not significant.
FA-NPMOFs are capable of dual-modality imaging and have low in vivo toxicity
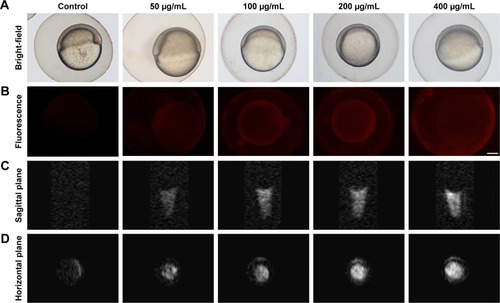
Following 5 hours of exposure to FA-NPMOFs, red fluorescence signals were observed in embryos in all exposed groups; the fluorescence intensity was in a dose-dependent manner (). For MRI, the T1-weighted signals became stronger by increasing the FA-NPMOF dose (). FA-NPMOFs were then removed, and the embryos were raised in Holt buffer regularly until 72 hpf. Compared to the control group (),Citation29 no obvious malformations were observed in embryos in the exposed groups at 6, 24, 48, and 72 hpf (). Analysis of the survival and hatching rates showed no significant differences (). These results indicate that the as-prepared FA-NPMOFs can be used for fluorescence and MRI in vivo imaging. Additionally, short-term exposure to FA-NPMOFs does not disrupt the gross development of embryonic zebrafish.
Figure 3 Fluorescence imaging and MRI of FA-NPMOFs in zebrafish embryos.
Notes: (A, B) Bright-field and fluorescence images of FA-NPMOF-exposed zebrafish embryos. Note that the red fluorescence was emitted by FA-NPMOFs. (C, D) MRI scans on the (C) sagittal and (D) horizontal planes. Scale bar in (A, B): 100 µm.
Abbreviations: FA-NPMOF, folic acid-nanoscale gadolinium-porphyrin metal-organic framework; MRI, magnetic resonance imaging.
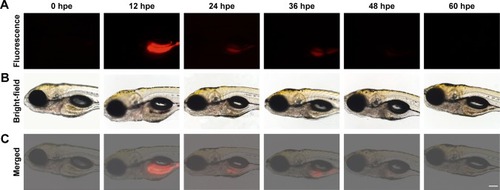
The distribution of FA-NPMOFs in 5-dpf larvae was assessed following exposure to FA-NPMOFs. Most of the fluorescence signals were detected in the gastrointestinal tract and decreased over time, disappearing at 60 hours post exposure (). Interestingly, no positive signals were detected in the liver at any time point. These results indicate that FA-NPMOFs are ingested by the wild-type larvae and accumulate mainly in the gastrointestinal tract.
Figure 4 Time-lapse distribution of FA-NPMOFs in zebrafish larvae.
Notes: (A, B) Fluorescence and bright-field images of FA-NPMOF-exposed larvae at 5 days post fertilization. Note that the red fluorescence was emitted by FA-NPMOFs. (C) Merged images from (A and B). Scale bar: 100 µm.
Abbreviation: FA-NPMOF, folic acid-nanoscale gadolinium-porphyrin metal-organic framework; hpe, hours post exposure.
Tumor targeting of FA-NPMOFs in HCC-bearing krasG12V juveniles
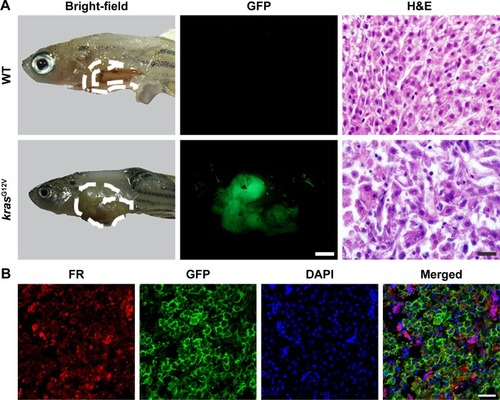
In this study, we used doxycycline to induce HCC in one-month-old krasG12V transgenic fish and assessed its formation every 3 days (). To eliminate the possible toxicity of FA-NPMOFs in the liver, wild-type zebrafish at 1 mpf were treated in the same way and were used as the control. No positive signals were found in the liver in the control group (). At 3 days post induction (dpi), low EGFP-positive signals were detected on the ventral side of the esophagus and intestinal bulb, although the liver did not show obvious enlargement (). From 6 to 12 dpi, the liver enlarged gradually, and the fluorescence in the liver increased. Next, we also performed H&E staining for histologic examination of the liver. From 6 to 12 dpi, cells in the liver exhibited a disordered growth arrangement with thickened plates. Over time, these cells became darkly stained and showed a higher nuclear-to-cytoplasmic ratio ().Citation30–Citation32 At 15 dpi, the liver showed remarkable cell pleomorphism, multinuclear cells, and vesicular nuclei with prominent nucleoli (). Because FR is over-expressed in HCC cells rather than normal hepatocytes, we also tested the expression of FR using immunohistochemistry in doxycycline-induced juveniles at 15 dpi. Briefly, bright red signals were detected in the membrane and cytoplasm, indicating strong FR expression (). HCC in krasG12V fish was defined as an EGFP-positive liver enlarged to at least twice the size of a normal liver with histologic changes, including plate disarrangement and atypical cells with an increased nuclear-to-cytoplasmic ratio.Citation33,Citation34 Moreover, we found that the EGFP-positive and FR-positive signals were colocalized. The above data illustrate that HCC is fully developed in krasG12V juveniles following 15 days of induction with doxycycline at 60 µg/mL, thus providing an efficient and reliable HCC model.
Figure 5 HCC in krasG12V zebrafish.
Notes: (A) Bright-field, GFP fluorescence and H&E staining images in wild-type (control, the upper line) and krasG12V zebrafish (the lower line) at 15 dpi. (B) FR immunostaining in the liver from krasG12V zebrafish at 15 dpi. Scale bar in (A): 500 µm; 10 µm; (B): 20 µm.
Abbreviations: dpi, days post induction; FR, folate receptor; GFP, green fluorescent protein; HCC, hepatocellular carcinoma; WT, wild type.
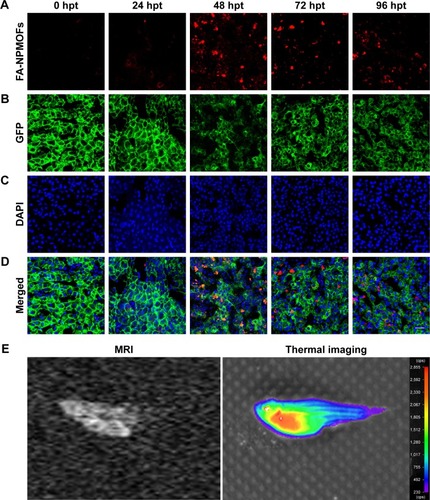
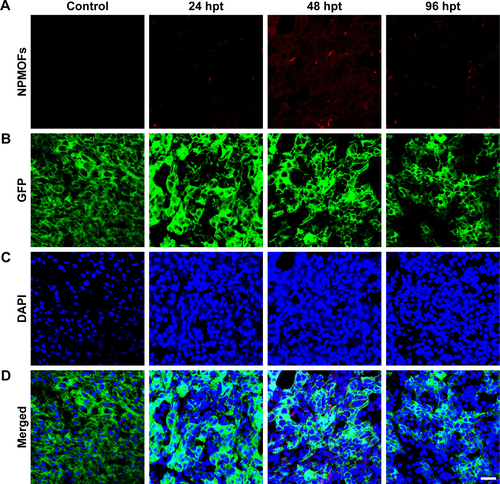
To determine the targeting ability of FA-NPMOFs in vivo, HCC-bearing juveniles were treated with FA-NPMOFs at a concentration of 200 µg/mL for 96 hours. We then dissected the liver and performed DAPI staining on cryosections. A gradual increase in fluorescence signal was observed during the first 48 hours, and then it progressively decreased (). The positive signals from FA-NPMOFs were observed in the cytoplasm and overlapped with the EGFP signals (). In negative control group, NPMOFs emitted faint red fluorescence, which located the cytoplasm of HCC tumor cells (). At 48 hpt, we performed in vivo and in situ imaging on the same fish by MRI and small animal imaging. Both the T1-weighted and thermal imaging signals were detected in the abdomen of the HCC-bearing fish, respectively (). These data suggest that FA-NPMOFs are specifically delivered and enriched in HCC for at least 48 hours.
Figure 6 Time-lapse retention of FA-NPMOFs in the liver of HCC-bearing krasG12V zebrafish.
Notes: (A) Retention of FA-NPMOFs in the liver of HCC-bearing zebrafish at 0 (control), 24, 48, 72, and 96 hpt. (B) Images of GFP fluorescence and DAPI staining in the same liver from (A). (D) Merged images of (A–C). (E) Magnetic resonance imaging scans and thermal images of FA-NPMOF-treated HCC-bearing zebrafish at 48 hpt. Scale bar: 20 µm.
Abbreviations: FA-NPMOF, folic acid-nanoscale gadolinium-porphyrin metal-organic framework; GFP, green fluorescent protein; HCC, hepatocellular carcinoma; hpt, hours post treatment; MRI, magnetic resonance imaging.
Significant tumor shrinkage following laser irradiation via photodynamic effect of FA-NPMOFs
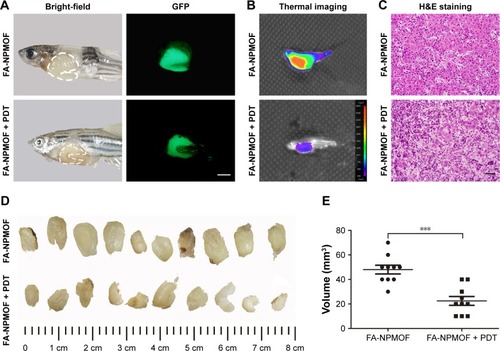
Following 48 hours of treatment with FA-NPMOFs, HCC-bearing fish underwent laser irradiation. The efficiency of PDT was evaluated 48 hours later by EGFP fluorescence, thermal imaging, H&E staining, and tumor volume measurement. Compared to the fish in the FA-NPMOF group, the EGFP-positive area was decreased () in the PDT group. The scope and intensity of the thermal imaging signals were also reduced in the PDT-treated fish (). H&E staining of liver sections from the PDT-treated fish showed patchy necrosis with inflammatory cell infiltration (). To quantify our findings, we measured the tumors from ten fish in each group (). The tumor volume (22.5±3.6 mm3) in the FA-NPMOF + PDT group was significantly lower than that (48.0±3.6 mm3) in the FA-NPMOF group (; Student’s t-test, ***P<0.001). The above data indicate that the photodynamic effect of FA-NPMOFs leads to tumor shrinkage.
Figure 7 Tumor inhibition after PDT in HCC-bearing zebrafish.
Notes: (A–C) Bright-field, fluorescence, thermal, and H&E staining images of HCC-bearing zebrafish before (FA-NPMOF; left column) and after (FA-NPMOF + PDT; right column) PDT. (D) Images of tumors in the FA-NPMOF and NPMOF + PDT groups. (E) Statistical analysis of tumor volume between the two groups. Scale bar in (A): 500 µm, (C): 20 µm. ***P<0.001.
Abbreviations: FA-NPMOF, folic acid-nanoscale gadolinium-porphyrin metal-organic framework; GFP, green fluorescent protein; HCC, hepatocellular carcinoma; PDT, photodynamic therapy.
Discussion
In the present study, we established and validated a novel theranostic nanoparticle consisting of FA conjugated to Gd-PMOFs for image-guided treatment of HCC. Our design strategy for the FA-NPMOFs was as follows: 1) FA-NPMOFs were synthesized with CTAB as surfactants to confine the rapid growth of MOF. Templates and auxiliary ligand methods were used to achieve nanoscale PMOFs in a micro-porous emulsion.Citation21 The basic skeleton consisted of TCPP and Gd3+. 2) FA was used for active tumor targeting and selective tumor cell entry. 3) The dispersion of the FA-NPMOFs was improved using PEI-10000, which is hydrophilic and biocompatible and was used as a linker between the targeting and fluorescence units. 4) Porphyrin was used as a theranostic platform for both fluorescence-guided imaging and PDT; porphyrin can provide powerful fluorescence and generate singlet oxygen following irradiation. Previous studies have reported that targeted MOF vectors require the use of dimethyl sulfoxide as a cosolvent;Citation35 however, the nanomaterials we constructed showed good dispersion and water solubility, allowing them to enter tissues and cells.
After confirming the high expression of FR, HepG2 cells were used as an in vitro HCC model. In vitro imaging and MTT assay data revealed two suitable features. First, the FA-NPMOFs could be used for efficient cellular imaging, as the FA-NPMOFs entered the HepG2 cells successfully with the same cellular localization as NPMOFs.Citation36 Second, the decent morphology of FA-NPMOF-exposed cells and the MTT assay results demonstrated the low cytotoxicity of FA-NPMOFs, and the conjugation of NPMOFs with FA did not increase the cytotoxicity. Therefore, these novel nanoparticles exhibited proper cellular localization in tumor cells with minimal toxic side effects in vitro.
Pores in the chorion of zebrafish embryos are ~600 nm in diameter.Citation25 The FA-NPMOFs are ~200 nm in diameter; thus, they can enter zebrafish embryos via the chorion pores. As there is no septum between the cells and yolk in early-stage zebrafish embryos, FA-NPMOFs invaded either the cells or yolk and dispersed throughout the embryo.Citation37 Hence, the red fluorescence emitted from FA-NPMOFs was roughly uniformed in each embryo at all concentrations. Malformations, mortality, and hatching are the key variables used for measuring the toxicity of nanoparticles in zebrafish models.Citation38,Citation39 Following exposure to FA-NPMOFs, the embryos exhibited an approximately normal phenotype with no obvious changes in either the survival rate or the hatching rate. Therefore, the biotoxicity resulting from short-term exposure to FA-NPMOFs was low. The in vivo imaging of FA-NPMOFs was first evaluated in embryos. On the one hand, the synthetic FA-NPMOFs emitted red fluorescence due to the properties of porphyrin. On the other hand, the FA-NPMOFs also have potential as a T1-weighted MRI contrast agent because of the strong paramagnetism of Gd3+. Therefore, the FA-NPMOFs have an excellent capability for fluorescence and MRI dual-modality imaging. The in vivo imaging of FA-NPMOFs was further observed in larvae. Larvae at 5 dpf become active and begin to prey; meanwhile, the gastrointestinal tract has begun preliminary function.Citation40,Citation41 Therefore, we selected 5 dpf as the time point to observe the distribution of FA-NPMOFs. Except the kidney, normal tissues do not seem to concentrate folate conjugates.Citation42 The expression level of FR in the heart, lungs, liver, intestines, and brain tissue is also very low.Citation43 The FA-NPMOFs gathered in the gastrointestinal tract, similar to other MOFs.Citation44 We speculated that the FA-NPMOFs were excreted through the digestive tract or the kidneys.
This study used the Tet-on zebrafish HCC model driven by carcinogenic kras signaling.Citation11 The dose of doxycycline was set at 60 µg/mL because this dose did not cause the mass death of 1-month-old juveniles. The formation of HCC was confirmed in three ways: 1) following induction for 15 days, the liver was enlarged with an obvious atypical morphology. 2) FR was overexpressed in HCC cells compared to the normal hepatocytes. In our model, FR was highly expressed in the liver in doxycycline-treated juveniles. 3) In krasG12V fish, EGFP was expressed when the kras gene was activated, and only the HCC cells could spontaneously and stably exhibit strong green fluorescence. Our data illustrated that a reliable HCC model was fully developed following 15 days of induction with doxycycline.
In this study, we accomplished actively and passively targeted FA-NPMOF delivery in an HCC zebrafish model. On the one hand, we designed FA-NPMOFs based on a receptor–ligand interaction. Because FR was highly expressed in HCC, the FA-NPMOFs entered the tumor cells via receptor-mediated endocytosis, which was applied for active targeting.Citation45 On the other hand, the enrichment of FA-NPMOFs in tumor sites partially occurred due to the enhanced permeability and retention (EPR) effect, which is a tumor-specific characteristic that contributes to the basis of delivery by passive targeting.Citation46 In the present study, we set the negative control both in vitro and in vivo. HepG2 cells or HCC-bearing zebrafish were only exposed to NPMOFs and weak signals were detected in cells or tumor tissue. This approach was an ideal and effective way to accomplish active targeting further enhanced by the EPR effect. Whether nanoparticles could be easily taken up by the mononuclear phagocyte system is also an important factor that depends on the size and hydrophobicity of the nanoparticles.Citation47 Nanoparticles between 10 and 200 nm in size are small enough to evade phagocytosis by the reticuloendothelial system. These particles may penetrate capillaries and exhibit long plasma circulation times, allowing them to achieve the most effective distribution in a particular tissue.Citation48,Citation49 Our FA-NPMOFs were equipped with a hydrophilic layer and had a size that was suitable for avoiding phagocytosis. Thus, FA-NPMOFs accumulated in the tumor site due to the combination of active targeting and the EPR effect.
PDT is a form of phototherapy that involves light and a photosensitizer and is used in conjunction with oxygen to elicit cell death. In FA-NPMOFs, porphyrin was not only used for fluorescence imaging but also acted as a photosensitizer. Tumor tissues exhibit preferential porphyrin uptake. Moreover, the retention of porphyrin in tumor tissues is longer than that in normal tissues.Citation50 This preferential tumor accumulation with a long retention time suggested the tremendous advantage of FA-NPMOFs for clinical applications. After a sufficient amount of porphyrin accumulated in the tumor tissue, the porphyrin was activated by exposure to light at a specific wavelength, generating enough singlet oxygen to exert a toxic effect on tumor cells rather than damaging the neighboring tissue. This process is the underlying mechanism of porphyrin-based PDT.Citation51 Remarkable HepG2 cell death was observed after PDT with the FA-NPMOFs. In the zebrafish, the HCC cells underwent necrosis, which triggered an inflammatory reaction. The therapeutic efficacy was also validated by EGFP fluorescence, thermal imaging, and tumor shrinkage. Hence, the FA-NPMOFs played therapeutic role both in vitro and in vivo.
Conclusion
In summary, we synthesized and validated novel low-toxicity nanoparticles consisting of FA conjugated to Gd-PMOFs that actively and passively target tumor tissue. The FA-NPMOFs offer a dual-theranostic platform: 1) it can be detected by both fluorescence and magnetic resonance in vitro and in vivo. 2) It can specifically recognize FR-positive cells; once in the cell it can enable PDT and induce damage to the malignant cells. This property may accelerate drug onset and reduce side effects. FA-NPMOFs are potential carriers that can be used for the development of new treatments for HCC and other FR-positive tumors.
Acknowledgments
The authors thank Dr Zhiyuan Gong (Molecular Biology Laboratory, Department of Biological Sciences, National University of Singapore, Singapore) for providing transgenic zebrafish Tg (fabp10:rtTA2s-M2; TRE2:EGFP-krasG12V) (krasG12V). This work was supported by the Chinese National Natural Science Foundation (81671179 and 81600397) and, the National Key R&D Program of China (2017YFA0103201).
Supplementary materials
Figure S1 Zeta potential of NPMOF, NPMOF@PEI, and FA-NPMOF.
Abbreviations: FA-NPMOF, folic acid-nanoscale gadolinium-porphyrin metal-organic framework; PEI, polyetherimide.
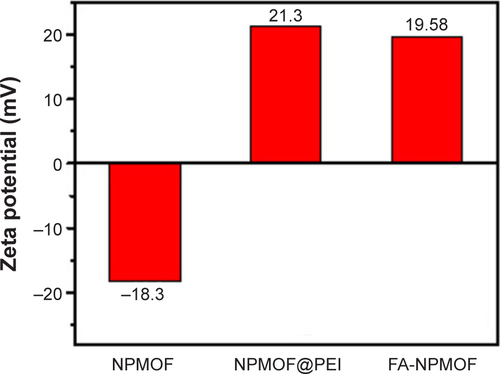
Figure S2 FR expression in L02 and HepG2 cells.
Notes: FR expression in (A) L02 cells and (B) HepG2 cells. Scale bar: 20 µm.
Abbreviation: FR, folate receptor.
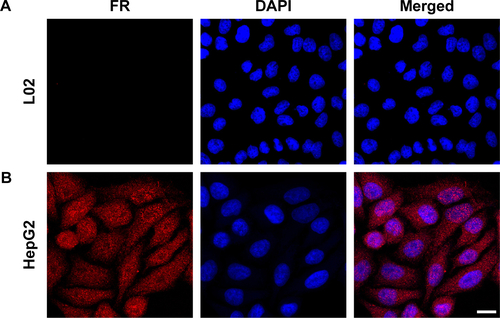
Figure S3 Fluorescence images of NPMOFs in HepG2 cells.
Notes: (A) Red signals are from NPMOFs, blue signals are from (B) DAPI staining. (C) Merged images from (A) and (B). Scale bar: 20 µm.
Abbreviation: NPMOF, nanoscale gadolinium-porphyrin metal-organic framework.
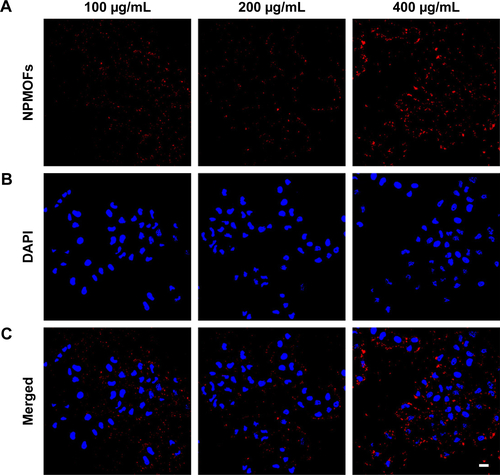
Figure S4 The release efficiency for folic acid-nanoscale gadolinium-porphyrin metal-organic frameworks.
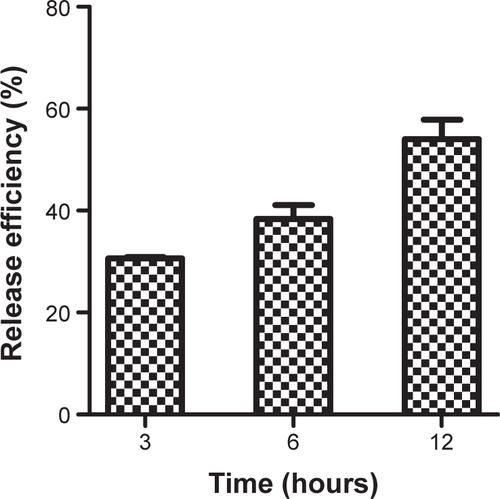
Figure S5 Phenotype, survival rate, and hatching rate of zebrafish embryos following exposure to FA-NPMOFs.
Notes: (A) Embryonic phenotype from 6 to 72 hpf in the control and FA-NPMOF-exposed groups at concentrations of 50, 100, 200, and 400 µg/mL. (B, C) Statistical analysis of the (B) survival and (C) hatching rates. The dorsal side is at the top, and the rostral side is to the left. Scale bar in (A): 200 µm.
Abbreviations: FA-NPMOF, folic acid-nanoscale gadolinium-porphyrin metal-organic framework; hpf, hours post fertilization.
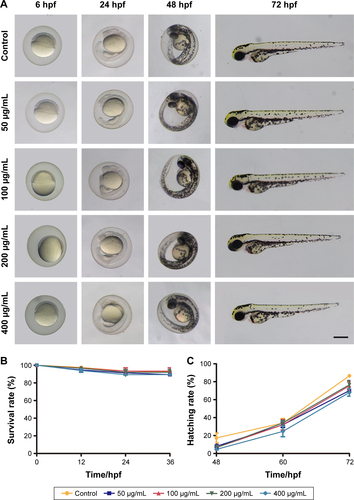
Figure S6 Tumorigenesis of hepatocellular carcinoma in doxycycline-treated krasG12V zebrafish.
Notes: (A–E) Bright-field (left column), green fluorescent protein fluorescence (middle column), and H&E staining images of livers (right column) in (A) wild-type (control) and (B–E) krasG12V zebrafish at (B) 3 dpi, (C) 6 dpi, (D) 9 dpi, and (E) 12 dpi. Scale bar: 500 µm (middle column); 20 µm (right column).
Abbreviation: dpi, days post induction.
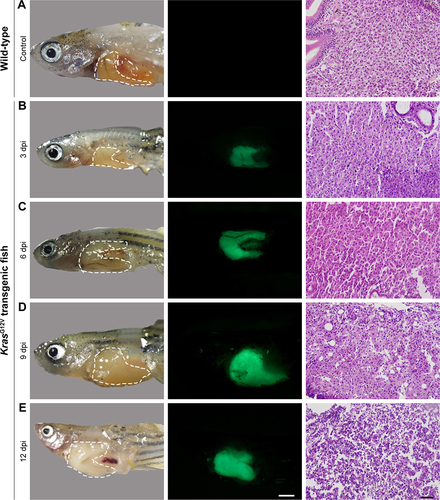
Figure S7 Time-lapse retention of NPMOFs in the liver of HCC-bearing zebrafish.
Notes: (A) Retention of NPMOFs in the liver of HCC-bearing zebrafish at 0 hours post treatment (hpt; control), 24, 48, and 96 hpt. (B) Images of GFP fluorescence and (C) DAPI staining in the same liver from (A). (D) Merged images of (A–C). Scale bar: 20 µm.
Abbreviations: GFP, green fluorescent protein; HCC, hepatocellular carcinoma; hpt, hours post treatment; NPMOF, nanoscale gadolinium-porphyrin metal-organic framework.
Disclosure
The authors report no conflicts of interest in this work.
References
- DenglerMStauferKHuberHSoluble Axl is an accurate biomarker of cirrhosis and hepatocellular carcinoma development: results from a large scale multicenter analysisOncotarget2017828462344624828526812
- ChenJGZhangSWLiver cancer epidemic in China: past, present and futureSemin Cancer Biol2011211596921144900
- PhamDHDe RooBNguyenXBUse of Zebrafish larvae as a multi-endpoint platform to characterize the toxicity profile of silica nanoparticlesSci Rep201663714527872490
- LiLBonnetonFTohmeMBernardLChenXYLaudetVIn vivo screening using transgenic Zebrafish embryos reveals new effects of HDAC inhibitors trichostatin A and valproic acid on organogenesisPLoS One2016112e014949726900852
- LaughlinSTBaskinJMAmacherSLBertozziCRIn vivo imaging of membrane-associated glycans in developing zebrafishScience2008320587666466718451302
- KoSKChenXYoonJShinIZebrafish as a good vertebrate model for molecular imaging using fluorescent probesChem Soc Rev20114052120213021240407
- WhiteRRoseKZonLZebrafish cancer: the state of the art and the path forwardNat Rev Cancer201313962463623969693
- CeolCJHouvrasYJane-ValbuenaJThe histone methyltransferase SETDB1 is recurrently amplified in melanoma and accelerates its onsetNature2011471733951351721430779
- LangenauDMTraverDFerrandoAAMyc-induced T cell leukemia in transgenic zebrafishScience2003299560888789012574629
- ChewTWLiuXJLiuLSpitsbergenJMGongZLowBCCrosstalk of Ras and Rho: activation of RhoA abates Kras-induced liver tumorigenesis in transgenic zebrafish modelsOncogene201433212717272723812423
- NguyenATEmelyanovAKohCHA high level of liver-specific expression of oncogenic Kras(V12) drives robust liver tumorigenesis in transgenic zebrafishDis Model Mech20114680181321729876
- DuCDengDShanLA pH-sensitive doxorubicin prod-rug based on folate-conjugated BSA for tumor-targeted drug deliveryBiomaterials201334123087309723374705
- CriderKSYangTPBerryRJBaileyLBFolate and DNA methylation: a review of molecular mechanisms and the evidence for folate’s roleAdv Nutr201231213822332098
- ZhaoXLiHLeeRJTargeted drug delivery via folate receptorsExpert Opin Drug Deliv20085330931918318652
- WuMXYangYWMetal-organic framework (MOF)-based drug/cargo delivery and cancer therapyAdv Mater201729231606134
- GaoWXingFZhouDShaoMZhuSNovel MOFs with tetrahedral cavity assembled from 4,4′,4″-s-triazine-2,4,6-triyltribenzoic acid (H3TATB)Inorg Chem Commun2011144601605
- ZhengHZhangYLiuLOne-pot synthesis of metal-organic frameworks with encapsulated target molecules and their applications for controlled drug deliveryJ Am Chem Soc2016138396296826710234
- CaiWChuCCLiuGWángYXMetal-organic framework-based nanomedicine platforms for drug delivery and molecular imagingSmall201511374806482226193176
- LuKHeCLinWNanoscale metal-organic framework for highly effective photodynamic therapy of resistant head and neck cancerJ Am Chem Soc201413648167121671525407895
- RogosnitzkyMBranchSGadolinium-based contrast agent toxicity: a review of known and proposed mechanismsBiometals201629336537627053146
- LiuWWangYMLiYHFluorescent imaging-guided chemotherapy-and-photodynamic dual therapy with nanoscale porphyrin metal-organic frameworkSmall201713171603459
- BuschmannJThe OECD guidelines for the testing of chemicals and pesticidesMethods Mol Biol2013947375623138894
- GourmelonADelrueNValidation in support of internationally harmonised OECD test guidelines for assessing the safety of chemicalsAdv Exp Med Biol201685693227671718
- MonetteMMEvansDLKrunkoskyTCamusAJaso-FriedmannLNonspecific cytotoxic cell antimicrobial protein (NCAMP-1): a novel alarmin ligand identified in zebrafishPLoS One2015102e011657625689842
- SunYZhangGHeZWangYCuiJLiYEffects of copper oxide nanoparticles on developing zebrafish embryos and larvaeInt J Nanomedicine20161190591827022258
- NguyenATEmelyanovAKohCHSpitsbergenJMParinovSGongZAn inducible kras(V12) transgenic zebrafish model for liver tumorigenesis and chemical drug screeningDis Model Mech201251637221903676
- MaengJHLeeDHJungKHMultifunctional doxorubicin loaded superparamagnetic iron oxide nanoparticles for chemotherapy and magnetic resonance imaging in liver cancerBiomaterials201031184995500620347138
- LiangLZhangXSuX99mTc-labeled oligomeric nanoparticles as potential agents for folate receptor-positive tumor targetingJ Labelled Comp Radiopharm2018612546029086447
- KimmelCBBallardWWKimmelSRUllmannBSchillingTFStages of embryonic development of the zebrafishDev Dyn199520332533108589427
- SpitsbergenJMBuhlerDRPetersonTSNeoplasia and neoplasm-associated lesions in laboratory colonies of zebrafish emphasizing key influences of diet and aquaculture system designILAR J201253211412523382343
- GoesslingWSadlerKCZebrafish: an important tool for liver disease researchGastroenterology201514961361137726319012
- LamSHWuYLVegaVBConservation of gene expression signatures between zebrafish and human liver tumors and tumor progressionNat Biotechnol2006241737516327811
- LiZHuangXZhanHInducible and repressable oncogene-addicted hepatocellular carcinoma in Tet-on xmrk transgenic zebrafishJ Hepatol201256241942521888874
- YanCHuoXWangSFengYGongZStimulation of hepatocarcinogenesis by neutrophils upon induction of oncogenic kras expression in transgenic zebrafishJ Hepatol201563242042825828472
- QiaoJDongPMuXQiLXiaoRFolic acid-conjugated fluorescent polymer for up-regulation folate receptor expression study via targeted imaging of tumor cellsBiosens Bioelectron20167814715326606305
- ParkJJiangQFengDMaoLZhouHCSize-controlled synthesis of porphyrinic metal-organic framework and functionalization for targeted photodynamic therapyJ Am Chem Soc2016138103518352526894555
- StainierDYRRazELawsonNDGuidelines for morpholino use in zebrafishPLoS Genet20171310e100700029049395
- BugelSMTanguayRLPlanchartAZebrafish: a marvel of high-throughput biology for 21st century toxicologyCurr Environ Health Rep20141434135225678986
- DangZvan der VenLTMKienhuisASFish embryo toxicity test, threshold approach, and moribund as approaches to implement 3R principles to the acute fish toxicity testChemosphere201718667768528818595
- OtisJPZeituniEMThiererJHZebrafish as a model for apo-lipoprotein biology: comprehensive expression analysis and a role for ApoA-IV in regulating food intakeDis Model Mech20158329530925633982
- de AlvarengaKAFSacramentoEKRosaDVSouzaBRde RezendeVBRomano-SilvaMAEffects of antipsychotics on intestinal motility in zebrafish larvaeNeurogastroenterol Motil2017295e13006e13006
- LowPSHenneWADoorneweerdDDDiscovery and development of folic-acid-based receptor targeting for imaging and therapy of cancer and inflammatory diseasesAcc Chem Res200841112012917655275
- ChenCKeJZhouXEStructural basis for molecular recognition of folic acid by folate receptorsNature2013500746348648923851396
- LiSYChengHQiuWXCancer cell membrane-coated biomimetic platform for tumor targeted photodynamic therapy and hypoxia-amplified bioreductive therapyBiomaterials201714214916128735175
- GlasgowMDChouguleMBRecent developments in active tumor targeted multifunctional nanoparticles for combination chemotherapy in cancer treatment and imagingJ Biomed Nanotechnol201511111859189826554150
- BertrandNWuJXuXKamalyNFarokhzadOCCancer nanotechnology: the impact of passive and active targeting in the era of modern cancer biologyAdv Drug Deliv Rev20146622524270007
- Pombo GarcíaKZarschlerKBarbaroLZwitterionic-coated “stealth” nanoparticles for biomedical applications: recent advances in countering biomolecular corona formation and uptake by the mononuclear phagocyte systemSmall201410132516252924687857
- NicolasJMuraSBrambillaDMackiewiczNCouvreurPDesign, functionalization strategies and biomedical applications of targeted biodegradable/biocompatible polymer-based nanocarriers for drug deliveryChem Soc Rev20134231147123523238558
- YuMZhengJClearance pathways and tumor targeting of imaging nanoparticlesACS Nano2015976655667426149184
- MuhannaNJinCSHuynhEPhototheranostic porphyrin nanoparticles enable visualization and targeted treatment of head and neck cancer in clinically relevant modelsTheranostics20155121428144326681987
- CelliJPSpringBQRizviIImaging and photodynamic therapy: mechanisms, monitoring, and optimizationChem Rev201011052795283820353192