
 ?Mathematical formulae have been encoded as MathML and are displayed in this HTML version using MathJax in order to improve their display. Uncheck the box to turn MathJax off. This feature requires Javascript. Click on a formula to zoom.
Abstract
Background
The intrinsic properties of Prussian blue (PB) nanoparticles make them an attractive tool in nanomedicine, including magnetic resonance imaging (MRI), photoacoustic imaging (PAI), and photothermal therapy (PTT) properties. However, there still remains the challenge of their poor dispersible stability in the physiological environment. In this study, we developed an efficient hydrothermal method to address the poor dispersible stability of PB nanoparticles in the physiological environment.
Materials and methods
The concentration of H+, the mass of polyvinylpyrrolidone (PVP), and iron sources (K3[Fe(CN)6]) are very vital in the preparation of PB nanoparticles. Through exploring the preparation process, optimized PB nanoparticles (OPBs) with excellent physiological stability were prepared. Hydrodynamic diameter and UV-vis absorption properties were measured to verify the stability of the prepared OPBs. Properties of dual-mode imaging, including MRI/PAI, and PTT of OPBs were investigated both in vitro and in vivo. In addition, the in vivo biosafety of OPBs was systematically assessed.
Results
OPBs were stable in different environments including various media, pH, and temperatures for at least 90 days, indicating that they are suitable for biomedical application via intravenous administration and easily stored in a robust environment. Compared with other research into the synthesis of PB nanoparticles, the “in situ modification” synthesis of PB nanoparticles had advantages, including a simple process, low cost, and easy mass preparation. OPBs showed no significant signs of toxicity for 90 days. As a proof of concept, the OPBs served as dual-mode image contrast agents and photothermal conversion agents for cancer diagnosis and therapy both in vitro and in vivo.
Conclusion
Our findings suggest a facile but efficient strategy with low cost to address the poor dispersible stability of PB nanoparticles in physiological environments. This will promote the development of further clinical transformations of PB nanoparticles, especially in cancer theranostics.
Introduction
Prussian blue (PB), as an ancient dye, has been reported to be the first synthetic coordination polymer.Citation1,Citation2 With their excellent intrinsic properties, PB-based nanomaterials have recently attracted great attention in various fields, including sensors,Citation3 batteries,Citation4,Citation5 electrochromic devices,Citation6,Citation7 and especially biomedicine.Citation8–Citation12 PB has been approved by the US Food and Drug Administration (FDA) as an antidote to remove radioactive Cs+ or TI+ via ion exchange.Citation13–Citation15 Due to the electron transfer between Fe2+ and Fe3+, PB possesses strong absorbance in the near infrared region (NIR) situated between 650 and 900 nm; this is indicative of a potential application in the photothermal therapy (PTT) for tumors.Citation16 For this reason, PB nanoparticles serve as a new potential cancer theranostic agent to be used in PTT and photoacoustic imaging (PAI) for cancer therapy and diagnosis, respectively.Citation9,Citation10,Citation17 In the structure of PB, the Fe2+ is carbon-bound and low-spin (S=0), whereas the Fe3+ is nitrogen-bound and high-spin (S=5/2), providing a total of five unpaired electrons per Fe2+–CN–Fe3+ unit.Citation18 Therefore, PB nanoparticles are capable of shortening the longitudinal and transversal relaxation times of protons from bulk water.Citation19,Citation20 In addition, owing to an unusual structural feature that renders some of the Fe3+ centers accessible to water coordination,Citation21 the inner-sphere relaxation mechanism is active in PB, thus offering a unique platform for developing PB-based magnetic resonance imaging (MRI) agents.Citation9 These mentioned intrinsic imaging and therapeutic functions endow PB nanoparticles with great potential in cancer diagnosis and treatment. For instance, PB nanoparticles coated with polyethylene glycol (PEG) have been proposed for both bimodal contrast agents and photothermal conversion agents for PTT.Citation9 In addition, hollow mesoporous PB nanoparticles have been constructed to act as an outstanding drug carrier with perfluoropentane and doxorubicin inside, for use in ultrasound/PAI dual-mode imaging and synergistic chemothermal therapy for tumors.Citation10 PB nanoparticles can also combine with other functional particles, such as Au,Citation17 Fe3O4,Citation22 quantum dotsCitation23, and NaDyF4:x%Lu nanoparticles,Citation24 to be used in multifunctional imaging and therapy for tumors. Furthermore, functional ions (Mn2+, Gd3+, or Bi3+) can be adopted into PB structure, while retaining PB’s intrinsic performance and simultaneously endowing it with other properties useful in MRI and computed tomography.Citation11,Citation12,Citation25–Citation28 However, there still remains the challenge of the poor dispersible stability of PB nanoparticles in physiological environments;Citation29 several efficient strategies to combat this have been reported.Citation29 The classical synthesis of PB nanoparticles is based on the two iron raw materials: Fe2+ (or Fe3+) salt and [Fe(CN)6]3− (or [Fe(CN)6]4−) salt. In this synthesis, polyvinylpyrrolidone (PVP) and chitosan were selected to act as stable agents to address the poor dispersible stability of PB nanoparticles. However, the PVP and chitosan do not participate in the reaction; there is just a physical interaction between PVP (or chitosan) and PB nanoparticles. The stability of the prepared PB nanoparticles is vital to their biomedical application and storage. Previous studiesCitation30,Citation31 have successfully used PVP as the coating polymer in the synthesis of small-sized PB nanoparticles by reacting FeCl2 with K3[Fe(CN)6]. Notwithstanding the abovementioned synthetic methods, most of those previously reported PB nanoparticles were bare nanoparticles with no careful surface engineering and coating, and thus they lacked stability in physiological environments with salts and might not exhibit optimized performance in biological systems particularly upon systemic administration.Citation9 Therefore, it is important to design better surface coating to improve the physiological stability of those nanoparticles.
Table S1 Unit price of PEG and PVP in major reagent companies
Table S2 Reaction parameters of size- and shape-controlled synthesis of PB nanoparticles
It is clear that ligand choice depends on future application of the nanoparticles.Citation32 Good ligand candidates can offer prolonged blood circulation and escape from the reticular endothelial system.Citation33 Several efficient strategies have been reported to address the poor dispersible stability of PB nanoparticles.Citation29 Citric acid can be covalently attached to the surface of PB nanoparticles as a functional group. It can also act as a surface capping agent to control the size and prevent agglomeration to form certain sized PB nanoparticles.Citation20,Citation34,Citation35 An alternative efficient strategy is post-modification of dis-persible PB nanoparticles. A layer-by-layer polymer coating approach was developed to functionalize PB nanoparticles with PEG to address their poor dispersible stability, by using a cationic polymer polyallylamine hydrochloride, an anionic polymer poly (acrylic acid), 1-ethyl-3-(3-dimethyl-aminopropyl) carbodiimide, and amine-terminated PEG.Citation9 However, the layer-by-layer polymer coating approach is complicated. Furthermore, additional functionality means more convoluted behavior and effects in vivo and also greater regulatory hurdles. Alternatively, PEGylated PB nanoparticles can be constructed by combining amine-functionalized PEG directly to the explored Fe sites of PB structure.Citation36 In this developed strategy, the success of PB nanoparticles modified by amine-functionalized PEG is dependent on the defects of PB with explored iron ions, and the PEG is expensive (). The PEGylation modification strategy can endow nanomedicines with good colloidal stability.Citation37 However, the immunogenicity of PEG should be emphasized, and PEGylation may cause an accelerated blood clearance phenomenon and loss of therapeutic efficacy.Citation38,Citation39 Moreover, PB nanoparticles can be camouflaged using red blood cell (RBC) membranes, thus improving their physiological stability, immune-evading capacity, and blood retention time.Citation40 Nevertheless, extraction of RBC membranes and the modification of bare PB nanoparticles are too complicated to scale up, and most importantly, RBC membranes may not be obtained in the clinic.Citation40 Therefore, there is a need to find a facile but efficient strategy to address the poor dispersible stability of PB nanoparticles.
Since ferricyanide can dissolve and ionize ferric ions under acidic conditions, PB nanoparticles can be formed in the presence of a reducing agent. It is important to search polymers acting as both reducing agents and modified stabilizers. PVP is an auxiliary ingredient commonly used as a stabilizer in pharmacy and is also a soluble polymer and reductant.Citation30,Citation41,Citation42 Therefore, PB nanoparticles may be modified with PVP in the synthetic process. Herein, we developed an “in situ modification” synthetic strategy to address the poor dispersible stability of PB nanoparticles based on using PVP and K3[Fe(CN)6] in an acid environment. Optimized PB nanoparticles (OPBs) with excellent physiological stability were prepared after the detailed investigation of the crucial synthetic factors. The prepared OPBs showed good physiological stability for at least 90 days, successfully overcoming the poor dispersible stability of PB nanoparticles. This “in situ modification” synthetic strategy is facile but is an efficient means for the mass production of OPBs, which could be employed for further clinical use. As a proof of concept, the prepared OPBs served as dual-mode image contrast agents and photothermal conversion agents for cancer diagnosis and therapy both in vitro and in vivo. This study will promote PB-based nanomedicine for further clinical transformation.
Materials and methods
Materials
All chemicals were of analytical grade and were used without further purification. PVP (K30) and potassium ferricyanide (K3[Fe(CN)6]) were purchased from Adamas (Shanghai, China); hydrochloric acid (HCl, 36.0%–38.0%) and acetone were purchased from Sinopharm Group Chemical Reagent Co, Ltd (Shanghai, China). Cell counting kit-8 (CCK-8) was purchased from Beyotime Biotechnology (Shanghai, China). The live/dead cell viability/cytotoxicity assay kit (Calcein-AM and propidium iodide [PI]) was purchased from Keygen Biotech (Nanjing, China.). Aqueous solutions were prepared with deionized (DI) water (18.2 MΩ*cm, 25°C) from a Milli-Q water purification system.
Synthesis of PB nanoparticles
The concentration of H+ solution, the mass of PVP, and iron sources (K3[Fe(CN)6]) are vital to the preparation of PB nanoparticles. Therefore, we first investigated the influence of these three factors on the preparation of PB nanoparticles to explore a large-scale strategy. Different amounts of PVP were mixed with HCl solutions of different concentrations or DI water as shown in , and different amounts of K3[Fe(CN)6] were added. The solutions were stirred for 30 minutes, placed in a glass bottle or a reaction vessel, and then placed in an oven at 80°C for an aging reaction for 20–24 hours. The mixture was then centrifuged at 20,000 rpm for 2 hours to collect PB nanoparticles.
Large-scale synthesis: to prepare PB nanoparticles on a large-scale, PVP (250 g) and K3[Fe(CN)6] (19.8 g) were added into 2,000 mL of HCl solution (1 M). The solution was stirred until clear and then placed in an oven at 80°C to achieve an aging reaction for 20–24 hours. The mixture was then centrifuged at 20,000 rpm for 2 hours for the collection of PB nanoparticles. Caution: all experimental operations were carried out in a fume cupboard to expel any HCN created.
Characterization
Transmission electron microscopy (TEM) images were obtained using a JEM-2100F transmission electron microscope. Elemental mapping images and energy-dispersive X-ray spectroscopy (EDS) scan results were obtained using a field emission scanning electron microscope (FESEM, Ultra 55; Carl Zeiss Meditec AG, Jena, Germany). Dynamic light scattering (DLS) (Zetasizer Nano Z; Malvern Instruments, Malvern, UK) was used to record the hydrodynamic particle size distribution and zeta potential of PB nanoparticles. UV-visible absorption spectra (UV-vis-NIR) were measured using a DU730 nucleic acid/protein spectrophotometer (Beckman Coulter, Brea, CA USA). Fourier transform infrared spectroscopy (FT-IR) was obtained using a NICOLET iS10 spectrometer (Thermo Fisher Scientific, Waltham, MA, USA).
Stability test
In order to observe the physiological stability of PB nanoparticles, the experiments were performed by measuring their diameter and UV-vis absorption properties. Equal amounts of PB nanoparticles were distributed in different solutions (water, NS, and FBS) and placed under different temperature conditions (4°C, 25°C, and 60°C). Then, another group of PB nanoparticles were dispersed in aqueous solutions with different pHs at room temperature (pH 1.0, 7.4, and 9.0). Hydrodynamic diameter and UV-vis absorption spectra were measured, and further analyses were performed.
Photothermal effect assessment of aqueous OPBs
The NIR laser used for photothermal experiments in vitro and in vivo was an 808 nm laser (BWT Beijing Ltd, Beijing, China). The aqueous OPB nanoparticle solution (1.5 mL) was placed in a quartz cell and exposed to NIR laser while being imaged by a thermal infrared (IR) camera. A series of OPB nanoparticles with a concentration of 100 ppm were exposed under different power densities of 0.3, 0.5, 0.8, 1, and 1.5 W/cm3. Then, a series of concentrations (0, 12.5, 25, 50, 100, and 200 ppm) were set, and the solutions were exposed to the NIR laser (808 nm, 1 W/cm3) for 5 minutes. Photothermal stability was detected after a total of seven cycles of laser on and off. UV-vis-NIR spectra were measured before and after light irradiation.
PAI of aqueous OPBs
To study the effects of PAI at different concentrations of OPBs (0, 12.5, 25, 50, 100, and 200 ppm), these solutions and water were placed in a 200 mL pipette tip, and imaging was performed using a multispectral optical tomography system (MSOT) imaging system (InVision 128; iTheramedical, Munich, Germany). The imaging parameters were as follows: IR laser, excitation wavelength setting range 650–980 nm, pulse energy up to 120 mJ, energy adjustment range 80–120 mJ, interval 10 nm, region of interest included the entire solution, and photoacoustic images of solutions were collected at different concentrations.
Relaxivity characterization and MRI in vitro
Different concentrations of OPBs (1.5 mL) were placed in 2 mL Eppendorf tubes. The longitudinal (T1) and transverse (T2) relaxation times were measured at room temperature using a 0.5 T MicroMR-25 MR system (Niumag Corporation, Shanghai, China). Relaxation values (r1 and r2) were calculated by fitting a curve of 1/T1 and 1/T2 relaxation time (s−1) to Fe3+ concentration (mM). MRI of OPB solutions was acquired using a MicroMR-60 mini MR system (Niumag Corporation). The imaging parameters were as follows: T1-weighted sequence, spin echo, repetition time/echo time (TR/TE)=500/20 ms, matrix acquisition=220×320, number of stimulate (NS)=2, field of view (FOV)=82×120 mm, number of slices=8, slice width=3.0 mm, slice gap=0.55 mm; T2-weighted sequence, spin echo, TR/TE=6,000/220 ms, and other parameters were the same as the T1-weighted sequence.
In vitro cytotoxicity and PTT assays of OPBs
A standard CCK-8 assay was performed to evaluate the proliferation effects and cytotoxicity of OPBs on the 4T1 cell line. The 4T1 cell line was purchased from the Shanghai Cell Bank of the Chinese Academy of Sciences, and all cell culture reagents were purchased from Shanghai Titan Technology Co, Ltd (Shanghai, China). The cells were cultured in DMEM containing 10% FBS and 1% penicillin and placed in a 37°C incubator with 5% CO2. The adherent cells were first digested with trypsin, centrifuged and re-dispersed in fresh medium, and then counted. 4T1 cells were seeded at a density of 5,000/well into 96-well plates and cultured to adherent cells. The culture medium was then removed and fresh DMEM solutions containing different concentrations of OPB nanoparticles (0, 12.5, 25, 50, 100, and 200 ppm) were added and incubated in a cell culture incubator with 5% CO2 at 37°C for 24 hours (Groups 1, 2, and 3) and 48 hours (Group 4). The cells of Group 3 were exposed under an 808 nm laser with a power density of 0.8 W/cm3 for 5 minutes. Then, the original medium was removed and a fresh 100 mL of medium was added along with 10 mL of CCK-8 reagent and was continued for 1–4 hours. The absorbance at 450 nm wavelength was measured by a microplate reader (Bio-Tek ELx800).
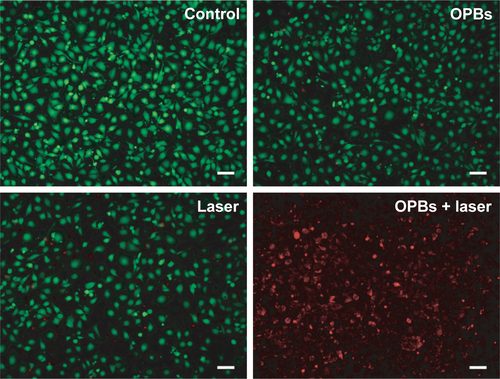
Calcein-AM/PI staining was used to detect the efficiency of the photothermal treatment (PTT). The cells were divided into four groups (control group, OPBs only group, laser only group, and OPBs plus laser group) and seeded in a 96-well plate. Then, the cells were treated with PBS (control group), laser only (808 nm, 0.8 W/cm3 for 5 minutes), OPBs only (100 ppm), and OPBs (100 ppm) with laser irradiation (808 nm, 0.8 W/cm3 for 5 minutes). The original medium was slowly aspirated, adherent cells were trypsinized and washed with PBS thrice to clear the original culture solution, and then resuspended with PBS and adjusted to approximately 1×10⁵ to 1×10⁶ cells/mL. A mixture of 100 mL of staining solution and 200 mL of cell suspension was incubated at 37°C for 15 minutes. Then, a drop of cell suspension was placed on the coverslip and the live cells (yellow-green fluorescence) and dead cells (red fluorescence) were simultaneously detected under a fluorescent microscope using a 490±10 nm excitation filter.
Hemolysis assay
Blood samples from a rabbit provided by the Laboratory Animal Center of Shanghai Sixth People’s Hospital were centrifuged (3,000 rpm, 5 minutes), and the supernatant was removed to obtain an RBC pellet. The pellet was washed three times with PBS, and 10 volumes of PBS were added to obtain a certain concentration of RBC suspension. Then, 0.3 mL of RBC suspension was added to 1.2 mL PBS (as a negative control); another 0.3 mL of RBC suspension was added to 1.2 mL DI water (as a positive control); and the same amount of suspension was added to different concentrations of OPB solutions (OPBs dispersed in PBS as experimental groups). The mixtures then stood at room temperature for 3 hours. Blood cells were removed by centrifugation. The OPBs were removed by high-speed centrifugation, and absorbance at 541 nm was measured by UV-Vis. Finally, the hemolysis rate was calculated according to the following formula:
Animal models and in vivo PAI/MRI
All animal experiments were performed in adherence with a standard protocol and approved by the Institutional Animal Care and Use Committee of Shanghai Sixth People’s Hospital. The experiment was approved by the ethics committee of Laboratory Animal Welfare of Shanghai Jiao Tong University and strictly followed the guidelines of the policy of the Institutional Animal Care and Use Committee. The experimental animals were female, 6–8-week-old nude mice, which were purchased and raised in a specific pathogen-free environment by the Animal Experiment Center of Shanghai Sixth People’s Hospital (Animal Certification No SCXK [Shanghai, 2013-0016]). A 4T1 single-cell suspension in the logarithmic growth phase was prepared, adjusted to a cell concentration of 1×10⁷/mL, and subcutaneously inoculated on the back of the nude mice. The activity of the nude mice and the size of the xenograft tumors were observed every 2 days. Experiments were performed when the tumors had a length of about 10 mm.
For in vivo PAI, the mice were given local anesthesia to the abdominal cavity, and OPBs were injected into the tumor-bearing mice via the tail vein at a dose of 10 mg/kg. Imaging parameters for the MSOT imaging system (InVision 128; iTheramedical) were as follows: pulse-tunable near-IR laser, excitation wavelength setting range 650–980 nm, pulse energy up to 120 mJ, energy adjustment range 80–120 mJ, interval 10 nm, the region of interest encompassed the entire mouse, and images were taken before and after injection.
For in vivo MRI, a 3.0 T magnetic resonance imaging system (Verio 3.0 T; Siemens Medical, Berlin, Germany) was used. Images were taken before and after intravenous (iv) injection of OPBs at a dose of 10 mg/kg, at a given time using a fat-saturated 3D gradient echo imaging sequence. The specific MRI parameters were set as follows: FOV=90×90 mm, TR/TE=300/13.5 ms, number of slices=6, slice thickness=1.5 mm, slice gap=0.5 mm, and flip angle=90°.
In vivo photothermal imaging and PTT
When tumor length reached to 5–7 mm, 4T1 tumor-bearing mice were randomly divided into two groups (n=6 per group): namely, Group 1 (the control group treated with NS) and Group 2 (OPBs + NIR laser). The dosage of OPBs was 10 mg/kg. NIR laser irradiation (808 nm, 0.8 W/cm3, 5 minutes) was conducted at 6 hours after iv injection. An IR thermal imager was used to monitor temperature changes at the tumor site during the PTT process. The tumor size and the weight of each mouse were recorded, respectively, before and after photothermal treatment. Tumor volume can be calculated according to the following formula:Citation43
In vivo biosafety assay
Healthy Kunming mice (18–24 g) were injected with OPBs at a dose of 20 mg/kg via the tail vein, and the same amount of normal saline was injected for the control group. At 3, 30, and 90 days after injection, the mice were anaesthetized and euthanized, and the eyeballs were removed. The blood of mice was collected for blood chemistry tests and routine blood analysis, and then the main internal organs (heart, liver, spleen, lung, and kidney) were harvested and fixed in 4% paraformaldehyde. The organs were then embedded in paraffin, sectioned, and stained with H&E staining. All images were viewed using a light microscope (20× magnification; Leica Microsystems, Wetzlar, Germany).
Statistical analyses
All experimental data were analyzed using the professional statistical software GraphPad Prism 7 and OriginPro 9. Measured data were expressed as mean ± SD, and the t-test or one-way ANOVA was used to analyze the differences between groups. P<0.05 was considered to be statistically significant.
Results and discussion
Preparation of PB
The concentration of H+ solution, the mass of PVP, and iron sources (K3[Fe(CN)6]) are vital to the preparation of PB nanoparticles. First, we investigated the influence of the concentration of H+ on the preparation of PB nanoparticles. With no addition of H+, PB microparticles exhibited cuboid and cube morphologies with distinct corner angles (). When the concentration of H+ increased from 0 to 0.001 M, microparticle size decreased and PB nanoparticles started to appear (). With further increase in the concentration of H+ to 0.1 M, the cuboid PB microparticles transformed into cubed PB nanoparticles and size decreased (). After a further increase in H+ concentration to 0.5 M, the corner angle of the cube PB nanoparticles disappeared (). The PB nanoparticles then became spherical with an H+ concentration of 1 M (2 M) (). Finally, with an increase in H+ concentration to 4 M, nanoparticle size increased (). From these results, it can be seen that the size and morphology of PB particles can be regulated by changing H+ concentration. In the preparation of PB particles, PVP acts as both a reductant and a stabilizer, being vital to both the preparation and stability of PB particles. Subsequently, the effects of PVP on the preparation of PB particles were explored with an iron source of 396 mg and an H+ concentration of 1 M. Without the addition of PVP, PB particles could not be obtained. When the concentration of PVP increased to a range of 0.005–0.05 g/mL, PB nanoparticles with a size of approximately 20 nm were obtained (). However, when PVP concentration was increased to 0.125 g/mL, the PB nanoparticles became spherical and the size increased to 69.05±8.17 nm (). The corner angles began to form with further increase in PVP concentration to 0.2 g/mL (). The iron source (K3[Fe(CN)6]) also influenced on the size of PB particles in a range of 50–300 nm (). We investigated the stability of the abovementioned PB particles within 24 hours. Except for the samples labeled as “d” (K3[Fe(CN)6]: 518 mg, PVP: 5 g, H+: 1 M), “j” (K3 [Fe(CN)6]: 396 mg, PVP: 5 g, H+ : 1 M), and “p” (K3 [Fe(CN)6]: 396 mg, PVP: 8 g, H+ : 1 M) (), which showed no significant change, all other samples became unstable within 1 day. We selected one of the three samples to confirm the mass preparation of PB nanoparticles. In this study, the gram-scale PB nanoparticles were obtained without difficulty. This large-scale strategy for the preparation of PB nanoparticles will be beneficial for their further clinical transformation. Optimal PB nanoparticles (OPBs, K3 [Fe(CN)6]: 12.95 g, PVP: 125 g, H+ : 1 M) were selected for further investigation. In this work, the growth of PB particles was a multiple-step mechanism.Citation42 The formation process involves nucleation and growth processes. First, it was explosive nucleation that leads to a small nanoparticle. Then, the nanoparticles were formed by aggregation of small nanoparticles in a highly ordered way with the addition of PVP. The nanoparticles would further aggregate to reduce the surface energy caused by internal defects and pores. PVP was used as a capping agent that could stabilize the particles.
Figure 1 Preparation and TEM images of PB particles.
Notes: (A) When the concentration of H+ solution varies from 0 to 4M (A1: 0 M; A2: 0.001 M; A3: 0.01 M; A4: 0.1M; A5: 0.5 M; A6: 1M; A7: 2 M; A8: 4 M). (B) When the concentration of PVP varies from 0.005-0.2 g/mL (B1: 0.005 g/mL; B2: 0.025 g/mL; B3: 0.05 g/ mL; B4: 0.2 g/mL). (C) When the mass of iron source (K3[Fe(CN)6]) varies from 32-518 mg (C1: 32 mg; C2: 64 mg; C3: 132 mg; C4: 518 mg). Insets represent the particle size distribution.
Abbreviations: TEM, Transmission electron microscopy; PB, Prussian blue; PVP, polyvinylpyrrolidone.
![Figure 1 Preparation and TEM images of PB particles.Notes: (A) When the concentration of H+ solution varies from 0 to 4M (A1: 0 M; A2: 0.001 M; A3: 0.01 M; A4: 0.1M; A5: 0.5 M; A6: 1M; A7: 2 M; A8: 4 M). (B) When the concentration of PVP varies from 0.005-0.2 g/mL (B1: 0.005 g/mL; B2: 0.025 g/mL; B3: 0.05 g/ mL; B4: 0.2 g/mL). (C) When the mass of iron source (K3[Fe(CN)6]) varies from 32-518 mg (C1: 32 mg; C2: 64 mg; C3: 132 mg; C4: 518 mg). Insets represent the particle size distribution.Abbreviations: TEM, Transmission electron microscopy; PB, Prussian blue; PVP, polyvinylpyrrolidone.](/cms/asset/95b943ad-cee2-464f-a2b1-4678fa528907/dijn_a_12190642_f0001_c.jpg)
Characterization of OPBs
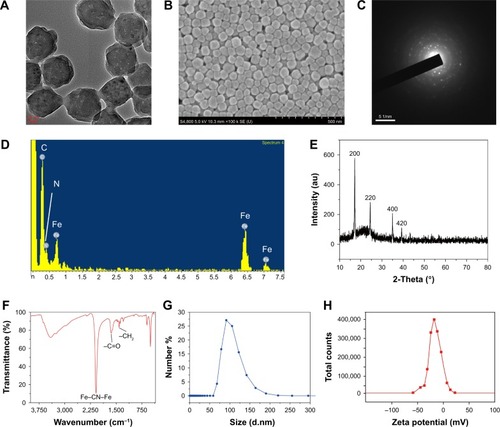
The OPBs were prepared via a simple synthetic route by mixing substantial amounts of K3[Fe(CN)]6 and HCl solution using PVP as the stabilizer to ensure good colloidal stability. TEM and SEM images of OPBs showed a spherical structure with a uniform size of 69.05±8.17 nm (). The corresponding elemental mappings showed the element composites of OPBs (). The selected area electron diffraction (SAED) patterns demonstrated the crystal structure of OPBs (). Energy-dispersive spectrometry (EDS; ) analysis shows the composition of C, N, and Fe elements. The X-ray powder diffraction (XRD) data revealed four characteristic peaks of PB at 17.4° (200 diffraction planes), 24.5° (220 diffraction planes), 35.2° (400 diffraction planes), and 39.5° (420 diffraction planes), which is consistent with the standard PB crystal card (JCPDS73-0689; ). FT-IR displayed a characteristic peak around 2,085 cm−1 of Fe2+-CN-Fe3+ ().Citation44 Meanwhile, the absorption peak at 1,670 cm−1 was characteristic of the C=O group of PVP. The hydrodynamic diameter of the average particle was 126 nm, indicating the presence of individual nanoparticles in the solution (). The nanoparticles owned negative charge with an average zeta potential of -19.1 mV ().
Figure 2 Charaterization of the OPBs.
Notes: (A) TEM and (B) SEM images of OPBs. (C) SAED patterns of OPBs. (D) EDS of the nanoparticles. (E) XRD of the nanoparticles. (F) FT-IR of the nanoparticles. (G) Size distribution and (H) zeta potential of the nanoparticles.
Abbreviations: OPBs, optimized Prussian blue nanoparticles; TEM, Transmission electron microscopy; SEM, scanning electron microscope; SAED, selected area electron diffraction; EDS, energy-dispersive X-ray spectroscopy; XRD, X-ray diffraction; FT-IR, Fourier transform infrared spectroscopy.
Stability of OPBs
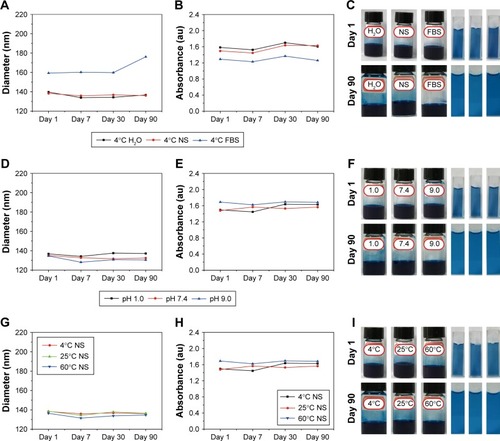
The physiological stability of nanomedicine is vital to their biomedical application. The colloidal stability of OPBs was investigated through incubation with various solutions. Hydrodynamic diameter and UV-vis absorption properties were measured to verify the stability of the prepared OPBs. First, the stability of OPBs in various solutions including water, saline, and FBS was explored. The hydrodynamic diameter and the absorbance at 690 nm of OPBs dispersed in water and NS remain unchanged even after 90 days (). The hydrodynamic diameter of OPBs in the FBS was greater than those in the water or NS, which is ascribed to the absorption of protein on the surface of the OPBs (). After 90 days, the hydrodynamic diameter of OPBs showed a small increase from ~160 to ~180 nm, which may be ascribed to the segmental metamorphic FBS (). The outstanding stability of OPBs in water or saline demonstrated their suitability for iv administration. Subsequently, the effect of pH on the stability of OPBs was investigated. There was no significant change in OPBs in solutions with different pH values when using measurements of hydrodynamic diameter and UV-vis absorption at 690 nm (). The stability of OPBs in a solution with a pH value of 1 suggests their potential biomedical application through oral administration. These results indicated that the prepared OPBs remained stable in various pH solutions, being suitable for drug administration by either iv or oral administration. Furthermore, the effect of temperature on the OPB solutions was studied. The OPB solutions were stable at different temperatures including 4, 25, and 60°C even after 90 days (). The stability of OPBs at different temperatures indicated that they could easily be stored in a robust environment. Unlike other reported research into PB nanoparticles, the “in situ modification” synthetic strategy had several advantages: first, simplicity without involving complicated post-translations; second, ease of mass preparation of PB nanoparticles in gram scale; and third, low cost and green.
Figure 3 Stability assessment measured using changes in hydrodynamic diameter and UV-vis absorption.
Notes: OPBs were dispersed in solutions with different pH value (A–C), or different solutions including H2O, NS, FBS (D–F) or under different temperature (G–I) and incubated over a period of 90 days. (A, D, G) Variation of size distribution of OPBs. (B, E, H) The variation of absorption at 808 nm. (C, F, I) Digital photographs of OPBs solution at day 1th and day 90th.
Abbreviations: OPBs, optimized Prussian blue nanoparticles; UV-vis, ultraviolet-visible spectroscopy; NS, normal saline; FBS, fetal bovine serum.
Biosafety of the prepared OPBs
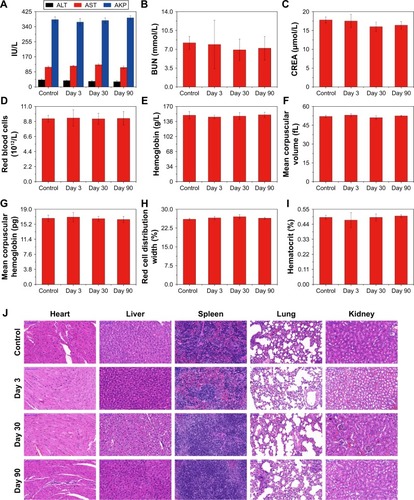
We used the hemolysis test and standard CCK-8 assays to determine the biocompatibility of the prepared OPBs. The hemolytic rate of OPBs was <10%, even at a concentration of 800 ppm (). The standard CCK-8 assay was used to determine the relative viability of 4T1 cells (murine breast cancer cells) exposed to OPBs. After cells were incubated with OPBs at various concentrations for 24 and 48 hours, no significant cytotoxicity was observed even at a high concentration of up to 200 ppm (). Then, we investigated the in vivo biosafety of OPBs using an in vivo blood biochemistry test, blood routine analysis, and H&E staining examination. Mice were iv injected with OPBs at a dose of 20 mg/kg. The mice exhibited no abnormal behavior during the test process. The results of murine serum biochemistry assays and complete blood routine tests of mice were measured after iv administration at 3, 30, and 90 days. We paid close attention to the hepatic and kidney function parameters. The results showed that no significant differences in the levels of these serum markers, including alanine transaminase (ALT), glutamic oxaloacetic transaminase (AST), ALP, blood urea nitrogen (BUN), and serum creatinine (CREA) between the experimental and control groups, suggesting no hepatic and kidney toxicity of OPBs (). The other vital hematological indicators including RBCs, hemoglobin (HB), mean corpuscular volume (MCV), and mean hemoglobin content (MCH), along with RBC distribution width (RDW) and hematocrit (HCT) were tested. All these markers remained within normal ranges, and as expected, there was no significant difference between those groups, suggesting a good hemocompatibility for OPBs (). H&E staining of the main organs including liver, spleen, kidney, lung, and heart of the mice at 3, 30, and 90 days was done to further evaluate the potential tissue damage, inflammation, or lesions caused by OPBs. In comparison with the control group, no pathological toxicity, severe side effects, cell necrosis, or inflammatory infiltrates were found after 90 days (). It can be concluded that OPBs possess good biological compatibility at our tested dose (20 mg/kg) after systemic administration for up to 90 days.
Figure 4 In vivo toxicology assessment of OPBs.
Notes: (A–C) Blood biochemistry test: (A) ALT, AST, and AKP; (B) BUN; (C) CREA. (D–I) Routine blood analysis: (D) RBC; (E) Hb; (F) MCV; (G) MCH; (H) RDW; (I) HCT. (J) H&E staining images of tissues (heart, liver, spleen, lung, and kidney) of the mice harvested from the control, 3, 30, and 90 days after intravenous injection of OPBs.
Abbreviations: OPBs, optimized Prussian blue nanoparticles; ALT, alanine transaminase; AST, glutamic oxaloacetic transaminase; AKP, alkaline phosphatase; BUN, blood urea nitrogen; CREA, serum creatinine; RBC, red blood cell; Hb, hemoglobin; MCV, mean corpuscular volume; MCH, and mean hemoglobin content; RDW, red blood cell distribution width; HCT, hematocrit; H&E staining, hematoxylin-eosin staining.
Photothermal conversion property, PAI, and MRI of OPBs
The OPBs displayed a broad absorption band from 400 to 1,000 nm with a strong absorption peak at ~690 nm (). In order to investigate the photothermal properties, OPBs with various concentrations were exposed to an 808 nm laser at different power densities from 0.3 to 1.5 W/cm3. The temperature of the OPBs solutions rapidly increased under NIR irradiation, and this was power density dependent (). The OPB solutions also showed a concentration-dependent temperature increase under laser irradiation, whereas DI water showed no significant temperature change (). Therefore, the photothermal properties of OPBs exhibited a certain concentration/laser power density and irradiation time dependence. Subsequently, the photothermal stability of OPBs was tested. It was found that OPBs remained to be rather robust photothermal heaters after seven cycles of NIR laser-induced heating (808 nm laser at 1 W/cm3, 5 minutes laser irradiation of each cycle; ). The temperature of each solution could reach a similar maximum temperature, and there was no significant change in the absorption peak of the UV-NIR absorption curve before or after laser irradiation (), demonstrating the excellent photothermal stability of OPBs. In addition, IR thermal images were acquired to monitor the photothermal effect of OPBs; these indicated that OPB temperature could reach up to around 50°C at a power density of 1 W/cm3 and 55°C at a power density of 1.5 W/cm3 (). In addition, cells in the group incubated with OPBs under laser irradiation showed the lowest cell viabilities ( and ). These results indicated that the prepared OPBs were good photothermal conversion agents for potential PTT.
Figure 5 Photothermal conversion property, magnetic resonance imaging, and photoacoustic imaging of OPBs.
Notes: (A) UV-vis absorption spectroscopy of OPBs aqueous solution. (B) Temperature profiles of aqueous 100 ppm OPBs at different power densities (0.3, 0.5, 0.8, 1.0, 1.5 W/cm2) at a wavelength of 808 nm. (C) Temperature curves of aqueous solutions of OPBs at different concentrations (0, 12.5, 25, 50, 100, 200 ppm) at a power density of 1.0 W/cm2 and a wavelength of 808 nm; (D) Temperature curves of OPBs aqueous solution before and after irradiation at a power density of 1.0 W/cm2 at a wavelength of 808 nm for 7 cycles of irradiation. (E) UV-vis absorption spectra of OPBs aqueous solution before and after irradiation at a power density of 1.0 W/cm2 at a wavelength of 808 nm for 7 cycles of irradiation (insets are representative photographs of OPBs before and after irradiation). (F) Photothermal imaging of OPBs aqueous solution. (G) Photoacoustic images and corresponding signal intensity plots of OPBs solution. (H) T1-weighted and (I)T2-weight MRI phantoms of OPBs acquired from a 0.5 T MRI system. The longitudinal relaxivity (r1) and transverse relaxivity (r2) were determined to be 0.1165 and 0.2699 mM-1S-1, respectively.
Abbreviations: OPBs, optimized Prussian blue nanoparticles; UV-vis, ultraviolet-visible spectroscopy; MRI, magnetic resonance imaging; r1, the longitudinal relaxivity; r2, the transverse relaxivity; min, minutes; MSOT, multi-spectral optical tomography system.
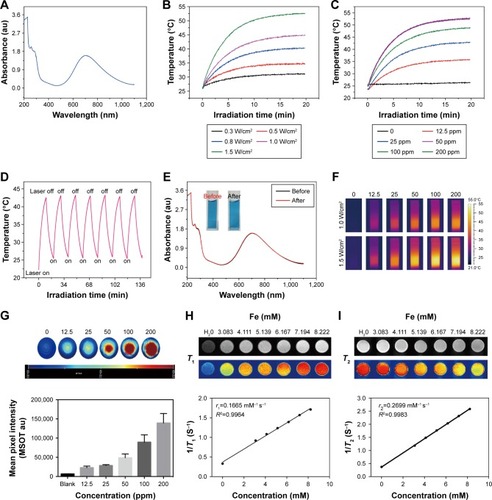
The good photothermal conversion property and biocompatibility suggested that OPBs can be used as an appropriate PAI contrast agent to improve the photoacoustic signal-to-noise ratio. In this study, we placed different concentrations of OPBs into Eppendorf tubes to generate PAI on an MSOT. The prepared OPBs exhibited obvious concentration-dependent PAI signals (). The PAI signal intensity of OPBs was linearly correlated in the concentration range of 0–200 ppm.
In order to study the potential application of OPBs as MRI contrast agents, we used a Newman’s small-scale MRI analyzer to test their T1 and T2 relaxation times of OPBs and then imaged the small test tube samples. Consequently, both the longitudinal and transverse relaxivity values, r1 and r2, were determined from the slope of the plot of 1/T1 and 1/T2 vs sample molar concentration of [Fe], respectively. The longitudinal relaxation rate r1 was 0.1665 mM−1 s−1, and the transverse relaxation rate r2 was 0.2699 mM−1 s−1 (). The numeric values of r1 and r2 were consistent with the study by Shokouhimehr et al (r1 was 0.20 mM−1 s−1, and r2 was 1.22 mM−1 s−1 at 1.5 T).Citation20 The ratio of r2/r1 was small when compared with most metal oxide nanoparticles exceeding 10,Citation45 which agreed with literature reports.Citation46 We also used spin echo sequences to obtain T1-weighted images and T2-weighted images of OPBs at various concentrations. As the concentration of OPBs increased, the T1-weighted image gradually became brighter and the T2-weighted image gradually darkened (), indicating that OPBs could be used as MRI contrast agents.
Dual-mode imaging and PTT of OPBs for tumors in vivo
As a proof of concept, OPBs with good physiological and biocompatibility were explored to achieve dual-mode imaging and PTT for cancer in vivo. After iv administration of the prepared OPBs, T1-weighted MRI of the tumors was obtained at 30 minutes, 2 hours, 6 hours, and 24 hours, respectively (). The MRI signal at the tumor site continued to increase and was remarkably enhanced compared to the pre-injection image. Quantitative analysis of T1-weighted MRI signal intensity increased to its highest of 2.08-fold after 6 hours. To further verify the PAI capability of OPBs, we also injected OPBs into the 4T1 tumor-bearing mice to obtain cross-sectional PAI images before and after injection. The average PAI signal intensity at the tumor site clearly became brighter after treatment with OPBs compared to the control group (). These results demonstrated that the prepared OPBs can achieve PAI and MRI dual-mode imaging for tumors in vivo.
Figure 6 Dual-mode imaging and photothermal therapy of OPBs for tumor in vivo.
Notes: (A) T1-weighted imaging in 4T1 tumor-bearing mice before and after intravenous injection of OPBs at different time points. (B) The corresponding of MR signal intensities at the tumor area. (C) Photoacoustic imaging of 4T1 tumor-bearing mice before and after injection of OPBs. (D) Thermal imaging of 4T1 tumor-bearing mice before and after injection with normal saline (control) or OPBs followed by 808 nm laser irradiation for 5 min. (E) Corresponding temperature change curves at tumor sites. (F) Relative tumor volume growth curves and (G) representative dissected tumor digital photos of 4T1 tumor bearing mice after PTT. (H) Changes in body weight during PTT. (I) H&E stained slices of tumor tissues collected from different groups after treatment (Magnification, ×200).
Abbreviations: OPBs, optimized Prussian blue nanoparticles; MRI, magnetic resonance imaging; PTT, photothermal therapy; H&E, hematoxylin-eosin.
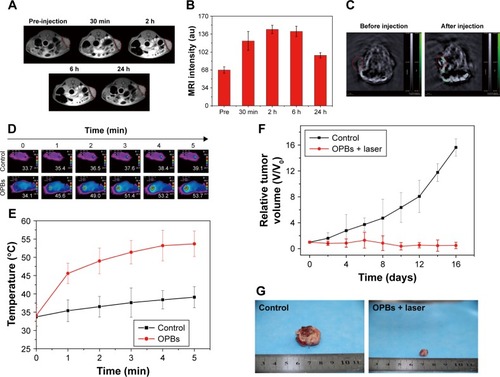
We then used a 4T1 tumor-bearing mouse model to explore the in vivo photothermal therapeutic effects of OPBs. After the tumors reached 60 mm3, OPBs were intravenously injected at a dose of 10 mg/kg. The mice were divided into two groups randomly (six mice in each group): control group and OPBs injection + laser group. An 808 nm NIR laser was used to irradiate the tumor site for 10 minutes after injection of OPBs. During the PTT process, an IR thermal camera was used to recode the tumor temperature changes (). The temperature of the tumors in the OPBs + NIR laser group rapidly increased to around 54°C, much higher than that of tumors in the control group (below 40°C; ). Compared with the control group, the OPBs injection + laser group showed significant suppression in tumor growth and no obvious surrounding relapse (). In addition, the body weight of the mice remained relatively stable during the 2-week experiment, indicating no significant systemic side effects during PTT (). After the tumors were dissected, H&E stained sections further evaluated the therapeutic effect of OPB nanoparticles. No obvious necrosis or karyolysis was found in the control group (). In the OPB injection + laser group, mouse tumor tissue structure of the mice was almost completely destroyed and the number of severely necrotic cells increased significantly. Our results suggested that the prepared OPBs were successful photothermal conversion agents with good photothermal therapeutic effects on tumors, successfully overcoming the insolubility of PB nanoparticles.
Conclusion
To address the insolubility of PB nanoparticles, a facile “in situ modification” synthetic strategy was developed. Through exploring the key factors in the preparation of PB nanoparticles, including the concentration of H+ solution, the mass of PVP, and iron sources (K3[Fe(CN)6]), the OPBs with excellent physiological stability were created using a simple protocol. This large-scale strategy for the preparation of PB nanoparticles will be useful for their further clinical use. The effects of media, pH, and temperature on the dispersible stability of OPBs were investigated by measuring the change in hydrodynamic diameter and absorbance at 690 nm for 90 days. The OPBs remained stable even after 90 days. Unlike the other reported research into PB nanoparticles, our prepared OPBs obtained using a facile but efficient strategy had several advantages, such as a simple development process, low cost, and easy mass preparation. The OPBs showed no significant toxicity in vivo for at least 90 days. In addition, the OPBs possessed the properties useful for MRI, PAI, and PTT for tumors both in vitro and in vivo. This study aimed to address the poor dispersible stability of PB nanoparticles and will promote PB-based nanomedicine for further clinical use. In future research, we will systematically investigate the long-term potential toxicity in vivo using both murine and non-human primate models.
Author contributions
XC, YZ, and BH designed research; YX, YZ, and XC prepared the nanoparticles and performed stability test; YX, WG, and YC performed and analyzed photoacoustic imaging; YZ, JC, and LC performed and analyzed magnetic resonance imaging; YX, XT, and YZ performed all photothermal assays; QT and SY helped analyzed the results; YX and YZ wrote the paper; all the authors checked the manuscript; and XC and BH supervised the work. All authors contributed to data analysis, drafting or revising the article, gave final approval of the version to be published, and agree to be accountable for all aspects of the work.
Acknowledgments
This work was supported by the National Natural Science Foundation of China (Grant No 81271597), Key international (regional) cooperative research projects (No 81720108023), Shanghai Key Discipline of Medical Imaging (No 2017ZZ02005), and Shanghai Sailing Program (No 18YF1419000).
Supplementary materials
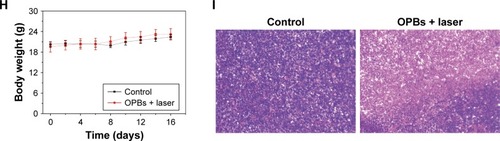
Figure S1 Typical SEM imaging and the corresponding elemental mappings of OPBs.
Note: Typical SEM imaging (A) and the corresponding elemental mappings of OPBs (iron (B), carbon (C), potassium (D), nitrogen (E), respectively). Abbreviations: OPBs, optimized Prussian blue nanoparticles; SEM, scanning electron microscope.
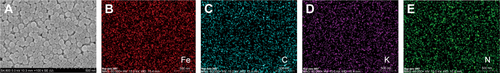
Figure S2 Hemolysis test.
Notes: (A) Schematics of hemolysis test. (B) Hemolysis percentages of RBCs incubated with OPBs at different concentrations. The insert was the digital photo illustrating the hemolysis effects.
Abbreviations: h, hours; min, minutes; OPBs, optimized Prussian blue nanoparticles; RBC, red blood cell.
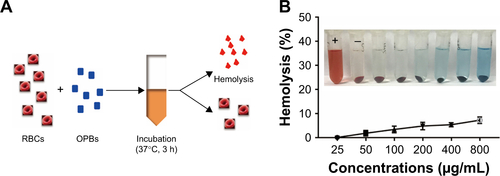
Figure S3 In vitro cytotoxicity.
Note: Cytotoxicity of OPBs in 4T1 cells after 24 and 48 hours of incubation.
Abbreviations: Ctrl, control; h, hours; OPB, optimized Prussian blue nanoparticle.
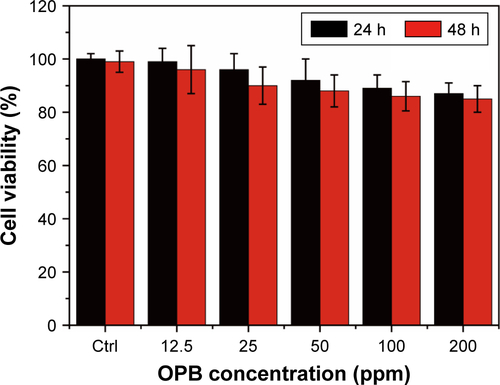
Figure S4 In vitro PTT effect.
Note: Viability of 4T1 cells incubated with different concentrations of OPBs before and after irradiation for 5 minutes using an 808 nm laser at a power density of 0.8 W/cm2.
Abbreviations: OPBs, optimized Prussian blue nanoparticles; PTT, photothermal therapy.
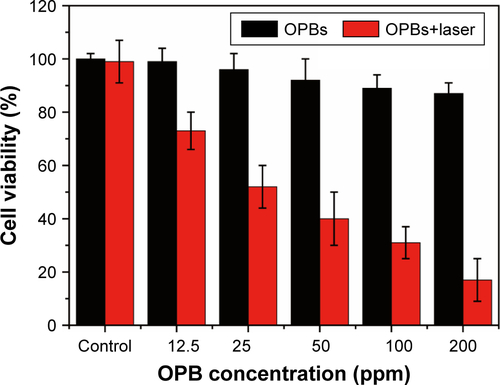
Figure S5 PTT effect assessed by fluorescence images.
Notes: Fluorescence images of 4T1 cells costained with calcein AM (live cells, green) and PI (dead cells, red) after different treatments: control, OPBs only, laser only, and OPBs plus laser. Scale bars: 50 mm.
Abbreviations: OPBs, optimized Prussian blue nanoparticles; PI, propidium iodide; PTT, photothermal therapy.
Disclosure
The authors report no conflicts of interest in this work.
References
- AyraultSLoss-NeskovicCFedoroffMGarnierECopper hexacyanoferrates: Preparation, composition and structureTalanta19944191435145218966087
- LarionovaJGuariYSangregorioCGuérinCCyano-bridged coordination polymer nanoparticlesNew J Chem200933611771190
- KongBSelomulyaCZhengGZhaoDNew faces of porous Prussian blue: interfacial assembly of integrated hetero-structures for sensing applicationsChem Soc Rev201544227997801826214277
- YouYWuXLYinYXGuoYGHigh-quality Prussian blue crystals as superior cathode materials for room-temperature sodium-ion batteriesEnergy Environ Sci20147516431647
- ZhangCXuYZhouMPotassium Prussian blue nanoparticles: a low-cost cathode material for potassium-ion batteriesAdv Funct Mater20172741604307
- AssisLMNLeonesRKanickiJPawlickaASilvaMMPrussian blue for electrochromic devicesJ Electroanal Chem20167773339
- WagnerCOetkenMPrussian blue – an electrochromic material with many different aspectsChemkon2016233111119
- YangFHuSZhangYA hydrogen peroxide-responsive O2 nanogenerator for ultrasound and magnetic-resonance dual modality imagingAdv Mater201224385205521122811026
- ChengLGongHZhuWPEGylated Prussian blue nanocubes as a theranostic agent for simultaneous cancer imaging and photothermal therapyBiomaterials201435379844985225239041
- CaiXJiaXGaoWA versatile nanotheranostic agent for efficient dual-mode imaging guided synergistic chemo-thermal tumor therapyAdv Funct Mater2015251725202529
- CaiXGaoWMaMA Prussian blue-based core-shell hollow-structured mesoporous nanoparticle as a smart theranostic agent with ultrahigh pH-responsive longitudinal relaxivityAdv Mater201527416382638926393889
- CaiXGaoWZhangLEnabling Prussian Blue with Tunable Localized Surface Plasmon Resonances: Simultaneously Enhanced Dual-Mode Imaging and Tumor Photothermal TherapyACS Nano20161012111151112628024381
- DelchetCTokarevADumailXExtraction of radioactive cesium using innovative functionalized porous materialsRSC Advances201221357075716
- ThompsonDFChurchCOPrussian blue for treatment of radiocesium poisoningPharmacotherapy200121111364136711714209
- YangYBrownellCSadriehNQuantitative measurement of cyanide released from Prussian BlueClin Toxicol2007457776781
- FuGLiuWFengSYueXPrussian blue nanoparticles operate as a new generation of photothermal ablation agents for cancer therapyChem Commun201248941156711569
- JingLLiangXDengZPrussian blue coated gold nanoparticles for simultaneous photoacoustic/CT bimodal imaging and photothermal ablation of cancerBiomaterials201435225814582124746962
- KegginJFMilesFDStructures and formulæ of the Prussian blues and related compoundsNature19361373466577578
- ShokouhimehrMSoehnlenESKhitrinABasuSHuangSDBiocom-patible Prussian blue nanoparticles: Preparation, stability, cytotoxicity, and potential use as an MRI contrast agentInorg Chem Commun20101315861
- ShokouhimehrMSoehnlenESHaoJDual purpose Prussian blue nanoparticles for cellular imaging and drug delivery: a new generation of T1-weighted MRI contrast and small molecule delivery agentsJ Mater Chem2010202552515259
- BuserHJSchwarzenbachDPetterWLudiAThe crystal structure of Prussian Blue: Fe4[Fe(CN)6]3.xH2OInorg Chem1977161127042710
- FuGLiuWLiYMagnetic Prussian blue nanoparticles for targeted photothermal therapy under magnetic resonance imaging guidanceBioconjug Chem20142591655166325109612
- YangYJingLLiXLinLYueXDaiZHyaluronic acid conjugated magnetic Prussian Blue@Quantum dot Nanoparticles for Cancer TheranosticsTheranostics20177246648128255343
- LiuYGuoQZhuXOptimization of Prussian blue coated NaDyF4: x%Lu nanocomposites for multifunctional imaging-guided photothermal therapyAdv Funct Mater2016262851205130
- ZhuWLiuKSunXMn2+-doped Prussian blue nanocubes for bimodal imaging and photothermal therapy with enhanced performanceACS Appl Mater Interfaces2015721115751158225965554
- KandanapitiyeMSValleyBYangLDFryAMWoodwardPMHuangSDGallium analogue of soluble Prussian blue KGa[Fe(CN)6]⋅nH2O: synthesis, characterization, and potential biomedical applicationsInorg Chem20135262790279223463984
- HuangYHuLZhangTMn3[Co(CN)6]2@SiO2 Core-shell Nanocubes: Novel bimodal contrast agents for MRI and optical imagingSci Rep2013312647265324026007
- PromdetPRodríguez-GarcíaBHenryAMultimodal Prussian blue analogs as contrast agents for X-ray computed tomographyDalton Trans20184734119601196730074599
- DelongchampDMHammondPTHigh-contrast electrochromism and controllable dissolution of assembled Prussian blue/polymer nanocom-positesAdv Funct Mater2004143224232
- UemuraTKitagawaSPrussian blue nanoparticles protected by poly(vinylpyrrolidone)J Am Chem Soc2003125267814781512822995
- XuePCheongKKYWuYKangYAn in-vitro study of enzyme-responsive Prussian blue nanoparticles for combined tumor chemotherapy and photothermal therapyColloid Surf B Biointerfaces201512527728325465756
- DongAYeXChenJA generalized ligand-exchange strategy enabling sequential surface functionalization of colloidal nanocrystalsJ Am Chem Soc20111334998100621175183
- KooijmansSAAFliervoetLALvan der MeelRPEGylated and targeted extracellular vesicles display enhanced cell specificity and circulation timeJ Control Release2016224778526773767
- SzigetiKHegedűsNRáczKThallium labeled citrate-coated Prussian blue nanoparticles as potential imaging agentContrast Media Mol Imaging201820184110
- ShibaFNitoMKawakitaKOkawaYSize control of monodisperse Prussian blue nanoparticles by enforced-nucleation and additional-growth procedures in a citrate reduction systemParticulate Sci Technol2015336671676
- LiWPSuCHTsaoLCChangCTHsuYPYehCSControllable CO release following near-infrared light-induced cleavage of iron carbonyl derivatized Prussian blue nanoparticles for CO-assisted synergistic treatmentACS Nano20161012110271103628024357
- JingLShaoSWangYYangYYueXDaiZHyaluronic acid modified hollow Prussian blue nanoparticles loading 10-hydroxycamptoth-ecin for targeting thermochemotherapy of cancerTheranostics201661405326722372
- MimaYHashimotoYShimizuTKiwadaHIshidaTAnti-PEG IgM is a major contributor to the accelerated blood clearance of polyethylene glycol-conjugated proteinMol Pharm20151272429243526070445
- ZhangPSunFLiuSJiangSAnti-PEG antibodies in the clinic: current issues and beyond PEGylationJ Control Release2016244Pt B18419327369864
- ChenWZengKLiuHCell membrane camouflaged hollow Prussian blue nanoparticles for synergistic photothermal-/chemotherapy of cancerAdv Funct Mater201727111605795
- YenFLWuTHTzengCWLinLTLinCCCurcumin nanoparticles improve the physicochemical properties of curcumin and effectively enhance its antioxidant and antihepatoma activitiesJ Agric Food Chem201058127376738220486686
- MingHToradNLKChiangYDWuKCWYamauchiYSize- and shape-controlled synthesis of Prussian Blue nanoparticles by a polyvi-nylpyrrolidone-assisted crystallization processCryst Eng Comm2012141033873396
- YangWGuoWLeWAlbumin-bioinspired Gd:CuS nanotheranostic agent for in vivo photoacoustic/magnetic resonance imaging-guided tumor-targeted photothermal therapyACS Nano20161011102451025727791364
- JungYMParkYSarkerSLeeJJDembereldorjUJooSWSurface-induced thermal decomposition of [Ru(dcbpyH)2-(CN)2] on nanocrystalline TiO2 surfaces: temperature-dependent infrared spectroscopy and two-dimensional correlation analysisSol Energ Mat Sol C2011951326331
- HifumiHYamaokaSTanimotoACitterioDSuzukiKGadolinium-based hybrid nanoparticles as a positive MR contrast agentJ Am Chem Soc200612847150901509117117851
- DumontMFHoffmanHAYoonPRBiofunctionalized gadolinium- containing prussian blue nanoparticles as multimodal molecular imaging agentsBioconjug Chem201425112913724328306