
Abstract
Objective
The objective of this study was to evaluate the performance of surface-enhanced Raman spectroscopy (SERS) in the prediction of early biochemical recurrence after radical prostatectomy (RP).
Patients and methods
We synthesized monodisperse gold nanoparticles as SERS-enhanced substrates and analyzed preoperative plasma samples of patients who underwent RP. The roles of clinical risk model (Cancer of the Prostate Risk Assessment [CAPRA] score) and distinctive SERS spectra on prediction of early biochemical recurrence were evaluated. The principal component analysis and linear discriminant analysis (PCA-LDA) were used to manage the spectral data and develop diagnostic algorithm.
Results
A total of 306 preoperative plasma Raman spectra from 102 patients were collected. SERS spectrum from those who developed early biochemical recurrence were compared to those who remained biochemical recurrence-free. The SERS detected more abundant circulating free nucleic acid bases in biochemical recurrence population, presenting significant stronger intensities at SERS spectral bands 725 and 1,328 cm−1. The addition of Raman spectral peak 1,328 cm−1 to CAPRA postsurgical (CAPRA-S) score significantly improved the predictive power of logistic regression model compared to simple CAPRA score (P<0.001). Meanwhile, the leave-one-out cross-validation method was used to validate the PCA-LDA model and revealed the sensitivity, specificity, and accuracy of 65.8%, 87.5%, and 79.4%, respectively. The receiver operating characteristic (ROC) curve was used to evaluate the performance of different models. Area under the ROC curve of the CAPRA-S score model alone was 0.77, however, when combined with Raman spectral peak 1,328 cm−1, it improved to 0.81.
Conclusion
Our primary results suggested that SERS could be a meaningful technique for prediction of early biochemical recurrence in prostate cancer.
Introduction
Prostate cancer (PCa) remains the second most common malignancy diagnosed in men worldwide.Citation1 About 30% of the patients who received radical prostatectomy (RP) will develop biochemical recurrence within 5 years.Citation2 Previous studies indicated that time to biochemical recurrence was a significant risk factor of cancer progression. Men who experienced early biochemical recurrence (at ≤2 years of RP) were more likely to suffer clinical metastases and cancer-specific mortality.Citation3,Citation4 Since patients with high risk cancer progression may benefit from early postoperative androgen blockade or external beam radiation, it could be meaningful to identify those who have high risk of early biochemical recurrence.Citation5,Citation6 Various models based on patients’ clinical and pathologic parameters have been developed for predicting disease recurrence. Among them, the Cancer of the Prostate Risk Assessment (CAPRA) score is widely validated and considered as the best performing tool for disease outcome prediction after RP.Citation7,Citation8 The potential predictors of early biochemical recurrence such as Gleason score, tumor stage, and prostate-specific antigen (PSA) level were reported to be not effective enough for patients and physicians to make adjuvant therapy decision.Citation9,Citation10
Evidences suggested that PCa has a unique metabolism during the cancer development and progression. Therefore, the circulating metabolic biomolecules could be potential source of diagnostic and prognostic biomarkers for PCa.Citation11 Metabolomics studies demonstrated that various components in blood and tissue were significantly different between recurrent and non-recurrent PCa cases, including phosphorylcholine, glutamate, cysteine, and lipids.Citation12,Citation13 In addition, a study implied that preoperative urine and serum metabolite profiling could supplement clinical variables in predicting early biochemical recurrence after RP, suggesting that it could be meaningful to extract component information in preoperative blood for disease recurrence prediction.Citation13,Citation14 However, the conventional methods in molecule analysis including mass spectrometry, proton nuclear magnetic resonance spectroscopy (1H-NMR), ELISA, which, more or less, were cumbersome in sample preprocessing, sophisticated in data analysis, and costly in reagent kits.
Surface-enhanced Raman spectroscopy (SERS) might be a suitable technology for analyzing blood components due to its capacity for substance recognition at the molecular level, with quick response, high accuracy and sensitivity, as well as minimal sample requirement.Citation15 In the present study, we performed SERS analysis of preoperative plasma and evaluated its predictive value of early biochemical recurrence (at ≤2 years after RP). The performance of distinct Raman spectral peaks was compared to a validated clinical model and CAPRA postsurgical (CAPRA-S) score, and the area under the receiver operating characteristic (ROC) curve was calculated when Raman peaks were added to the CAPRA-S model.
Patients and methods
Patients and samples collection
From January 2013 to May 2015, 102 patients were included in this study. Patients of early biochemical recurrence were identified as those who developed PSA relapse at ≤2 years after RP (PSA ≥0.2 ng/mL, confirmed at least once 2 weeks later). Patients of biochemical recurrence free survival (bRFS) were defined as those who maintained serum PSA <0.2 ng/mL for >2 years. Inclusion criteria were as follows: 1) clinically localized PCa subjected to RP, 2) without neoadjuvant treatment before RP, 3) without adjuvant treatment after RP, and 4) followed until biochemical recurrence or for up to 2 years after RP. Detailed clinical information of all subjects and the preoperative blood sample were collected after the informed consent was signed. This study was conducted in accordance with the Declaration of Helsinki and the experimental protocol was approved by the Institutional Ethics Committee of RenJi Hospital affiliated to Shanghai Jiao Tong University, School of Medicine (approval no Renji[2013]126).
CAPRA-S scores of the two groups (biochemical recurrence group and bRFS group) were calculated and patients were classified as low risk (CAPRA-S 0–2), intermediate risk (CAPRA-S 3–5), and high risk (CAPRA-S 6–10) as previously defined.Citation8 Blood samples were previously collected before RP. After 12 hours of overnight fasting, 5 mL of blood samples was collected from the subjects between 6:00 and 7:00 am with the use of an anticoagulant (EDTA) and was then transported to the biobank in RenJi Hospital. Plasma was obtained by centrifugation at 3,000 rpm for 10 minutes and stored at −80°C until SERS analysis.
Gold nanoparticles (Au-NPs) synthesis and SERS measurement
Monodisperse citra-stabilized Au-NPs with a quasi-spherical shape of 60 nm were synthesized following a kinetically controlled seeded growth strategy via the reduction of HAuCl4 by sodium citrate.Citation16 The Au-NP solution was concentrated by centrifugation at 10,000 rpm for 10 minutes, and the final concentration was obtained for SERS measurement.
Prior to SERS measurement, 10 µL of plasma was homogenously mixed with 20 µL of prepared Au-NPs, and the mixture was then kept incubated at 4°C for 3 hours. A droplet (3 µL) of the resulting mixture was transferred onto a silicon plate for SERS measurement. Renishaw Raman microscope (inVia™; Gloucestershire, UK) was used for the collection of SERS spectra with a spectral resolution of ~1 cm−1. Samples were excited with a 633-nm He-Ne laser with a power of 50 mW. The spectral data acquisition time was 1 second using a Leica DM2500 microscope equipped with an objective lens of L50 (N.A. 0.5) and the spectrum was acquired using WiRE 3.2 software over a wave number range of 400–1,800 cm−1. To collect comprehensive information on the samples, three SERS spectra from different areas of each sample were collected.
Statistical analysis
Fluorescence background in the spectra data was removed using a Vancouver Raman algorithm based on the fifth-order polynomial fitting method. Patients’ clinical variables and spectra data were compared between two groups of patients using Mann–Whitney U test, independent-sample test, and chi-squared test appropriately. The relationship between Raman peak 1,328 cm−1 and early biochemical recurrence was assessed using Cox regression analysis and Kaplan–Meier analysis.
Principal component analysis and linear discriminant analysis (PCA-LDA) was used to analyze the spectra data and developed diagnostic algorithm. The PCA-LDA model was then validated using the leave-one-out cross-validation method. The ROC curve was generated for Raman spectral peak, CAPRA-S score, adjusted model combined with CAPRA-S score and Raman spectral peak, and the PCA-LDA model based on Raman spectra. The corresponding area under the curve (AUC) was calculated. All statistical analyses were performed using the R-statistical package (R Foundation for Statistical Computing, Vienna, Austria), with P<0.05 as statistically significant.
Results
A total of 102 patients were included in this study. Overall, 38 patients developed early biochemical recurrence with a median time to recurrence of 10.6 months, and 64 patients remained bRFS with a median follow-up time of 42.8 months. As shown in , compared to bRFS group, the biochemical recurrence group had significantly higher preoperative serum PSA (P=0.001), higher proportion of positive surgical margins (P=0.004), higher pathologic Gleason score (P=0.011), and more advanced clinical stage (P=0.019). Moreover, the CAPRA score was asymmetrically distributed. In the bRFS group, 37.5% of the men were low risk (CAPRA-S 0–2) and 3% were high risk (CAPRA-S 6–10), while in the biochemical recurrence patient group, 10.5% of the men were low risk (CAPRA-S 0–2) and 47% were high risk (CAPRA-S 6–10).
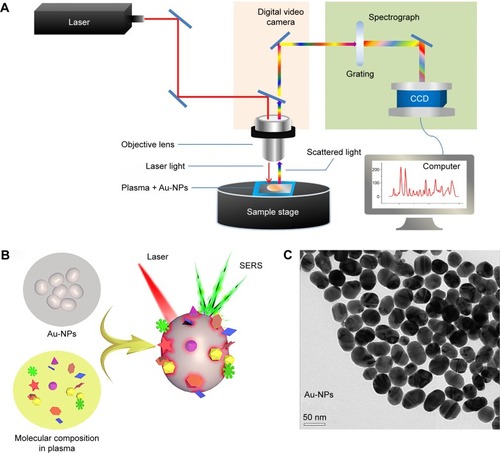
displays a schematic diagram of SERS monitor system. shows the inelastic scattering mechanism of SERS. Components in blood sample were absorbed onto surface of Au-NPs and excited by laser, then Raman spectra were scattered from chemical bonds within molecules and collected by Raman monitor system. is the transmission electron microscopy image of Au-NPs, which shows the substance bases of SERS in microcosmic perspective. The Au-NPs show homogeneous quasi-spherical shape, with diameter of 60±10 nm, which can amplify the Raman signal of molecules because of the local electromagnetic fields on metal surfaces.
Figure 1 (A) Schematic diagram of the SERS analysis of blood plasma. (B) The mechanism of SERS based on Au-NPs. (C) TEM image of Au-NPs.
Note: The scale bars indicate 50 nm.
Abbreviations: AU-NPs, gold nanoparticles; CCD, charge coupled device; SERS, surface-enhanced Raman spectroscopy; TEM, transmission electron microscopy.
SERS spectra features of the plasma samples
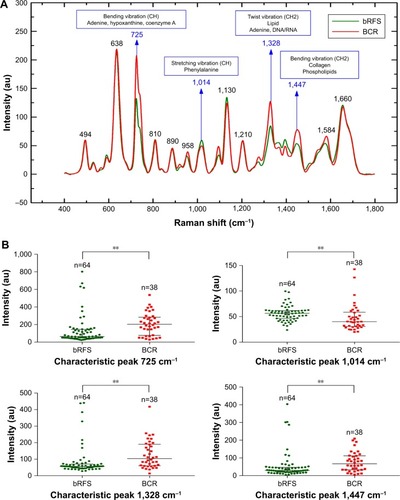
The mean plasma Raman spectra of the early biochemical recurrence patients (red line) and bRFS patients (cyan line) are shown in . In all patients, the holistic Raman spectral features were demonstrated in the following peaks with tentative biochemical assignments ():Citation19–Citation23 638 cm−1 (C−S twist/l-tyrosine); 725 cm−1 (CH bending vibration in adenine, hypoxanthine, and coenzyme A); 810 cm−1 (C−C−O stretching vibration/l-serine); 1,014 cm−1 (C−H stretching vibration/phenylalanine); 1,130 cm−1 (C−N stretching vibration/d-mannose); 1,328 cm−1 (CH2 twist vibration/lipids and C–H vibration in DNA/RNA); 1,584 cm−1 (C=C bending/acetoacetate); and 1,660 cm−1 (C=C stretching vibration/amide I). When comparing the plasma Raman spectra between the two groups, the patients of early biochemical recurrence had shown stronger intensities at 725 (P<0.01), 1,328 (P<0.01), and 1,447 cm−1 (P<0.01), while lower intensity at 1,014 cm−1 (P<0.01) (). According to the biochemical assignments of Raman spectra peaks, blood of patients who developed early biochemical recurrence might contain higher concentrations of adenine, hypoxanthine, and coenzyme A (725 cm−1), lipids and DNA/RNA bases (1,328 cm−1), and collagen and phospholipids (1,447 cm−1), while lower concentrations of phenylalanine (1,014 cm−1) than those who remained bRFS.
Table 1 Tentative assignments of significant SERS peaks observed in plasmaCitation17,Citation19–Citation23
Figure 2 (A) Comparison of the normalized mean SERS spectra from 38 early biochemical recurrence and 64 bRFS plasma samples. (B) Box plots of the four significant SERS peak intensities (725, 1,014, 1,328, and 1,447 cm−1) for the two groups.
Notes: The line within each box represents the median, while the lower and upper boundaries of the box indicate first and third quartiles, respectively. Comparison of the spectra data via Mann–Whitney U test, **P<0.01.
Abbreviations: BCR, biochemical recurrence; bRFS, biochemical recurrence free survival; SERS, surface-enhanced Raman spectroscopy.
Evaluation of Raman spectra for the prediction of early biochemical recurrence
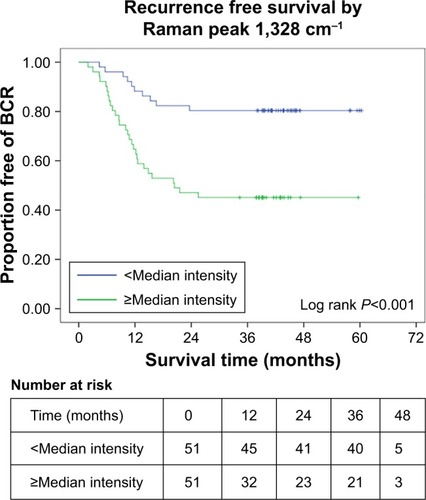
Cox regression proportional hazard analysis was utilized to evaluate the prognostic value of Raman spectra for early biochemical recurrence. As shown in , the intensities of Raman peak 1,328 cm−1 were associated with risk of early biochemical recurrence (HR: 1.97, 1.41–2.74, 95% CI, P<0.001, when 1,328 cm−1 increase by a quarter), and remained significantly associated after adjusting for the CAPRA-S score (HR 1.67, 1.19–2.33, 95% CI, P=0.003) in multivariate model. The relevance of Raman peak 1,328 cm−1 to early biochemical recurrence status was validated in Kaplan–Meier curve (). Patients with high intensity (≥median intensity) in Raman peak 1,328 cm−1 were more likely to develop early biochemical recurrence than those with low intensity (<median intensity) (54.9% vs 19.6%, P<0.01).
Table 2 Univariate and multivariate Cox proportional hazard analyses of Raman peaks and CAPRA-S
Figure 3 Kaplan–Meier curve showing association of Raman peak 1,328 cm−1 and risk of early biochemical recurrence.
Abbreviation: BCR, biochemical recurrence.
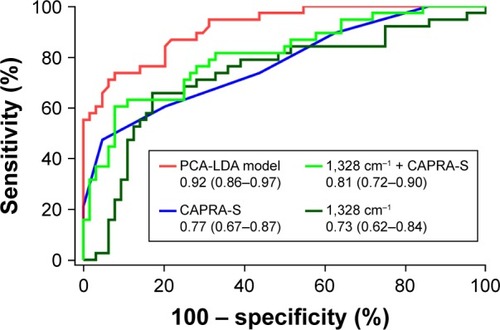
Meanwhile, we used PCA to analyze these spectra and extracted the first 13 principal components, which accounted for 88.9% of the variance to perform the LDA. As shown in , the PCA-LDA model can clearly discriminate the plasma spectra of biochemical recurrence from bRFS. We applied leave-one-spectrum-out cross-validation method to validate the LDA discrimination model and revealed the diagnostic sensitivity, specificity, and accuracy of 65.8%, 87.5%, and 79.4%, respectively. We used the ROC curve to evaluate the performance of clinical model CAPRA-S score, the Raman peak 1,328 cm−1, the Raman peak 1,328 cm−1 combined with CAPRA score, and PCA-LDA model based on SERS spectra. As shown in , the AUC for the PCA-LDA model was 0.92 (0.86–0.97), the Raman peak 1,328 cm−1 was 0.73 (0.62–0.84, 95% CI), the CAPRA-S was 0.77 (0.67–0.87, 95% CI), and when combined Raman peak 1,328 cm−1 to CAPRA-S, the AUC value improved to 0.81 (0.72–0.90, 95% CI).
Figure 4 PCA and scatter plots of LDA score of biochemical recurrence and bRFS plasma SERS spectra.
Abbreviations: BCR, biochemical recurrence; bRFS, biochemical recurrence free survival; LDA, linear discrimi nant analysis; PCA, principal component analysis; SERS, surface-enhanced Raman spectroscopy.
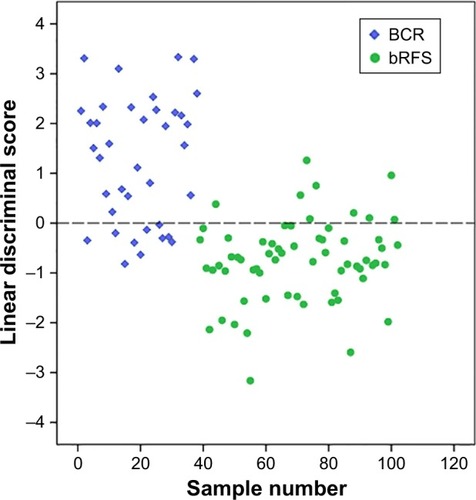
Figure 5 Comparison of ROC curves of PCA-LDA model, Raman peak 1,328 cm−1 combined with CAPRA-S score, CAPRA-S score alone, and Raman peak 1,328 cm−1 alone.
Abbreviations: CAPRA-S, Cancer of the Prostate Risk Assessment postsurgical score; PCA-LDA, principal component analysis and linear discriminate analysis; ROC, receiver operating characteristic.
Discussion
It is valuable to identify patients who will develop early biochemical recurrence after RP because timely adjuvant therapy could improve their clinical outcomes.Citation4,Citation5 Previous studies indicated that blood chemical component information could be meaningful to supplement clinical risk stratification.Citation12–Citation14 In this study, we conducted overall analysis of comprehensive components in preoperative plasma using SERS technique and evaluated the value of corresponding Raman spectra for prediction of early biochemical recurrence (biochemical recurrence at ≤2 years of RP). Our results showed the intensity of Raman peak 1,328 cm−1 was significantly associated with risk of early biochemical recurrence and could improve performance of CARPA-S scoring system for early biochemical recurrence prediction in patients treated by RP.
Raman spectroscopy (RS) is an optical technique relied on the energetic changes in inelastic light scattered from chemical bonds within the sample itself. Accordingly, the RS can provide native fingerprint information on the sample determined by the constituents and the environment, which have been successfully used in discriminating benign from cancer tissue in other malignancies such as breast cancer, kidney cancer, and PCa.Citation17,Citation18 SERS combined RS with metallic nanosubstrate, which can achieve 106–108 times of Raman signal enhancement caused by electromagnetic effect and enable collection of high quality Raman spectra signal.Citation19 SERS is suitable for bio-sample analysis such as blood, secretions, and saliva for its advantages of quick response, high accuracy and sensitivity, and slight samples requirement, which have been used to detect nasopharyngeal, gastric, cervical, and hepatocellular cancers by analyzing blood.Citation20–Citation23 Our group also reported value of SERS in early detection of PCa by analyzing components of serum and expressed prostatic secretion.Citation24
In this study, significantly stronger intensities at Raman spectral peaks 725, 1,328, and 1,447 cm−1, and lower intensities at 1,014 cm−1 (P<0.01) were identified in the early biochemical recurrence group compared to bRFS group. According to the tentative biochemical assignments, blood of early biochemical recurrence patients might contain higher concentrations of nucleic acid bases like adenine, hypo-xanthine, DNA/RNA bases (725 and 1,328 cm−1), a group molecules of lipid metabolism like coenzyme A (725 cm−1), lipids (1,328 cm−1), and phospholipids (1,447 cm−1). It should be explained that the same vibrational bond can be distributed in many other molecules, so that the individual Raman spectral peak could be a mixture of different molecules. Previous studies have reported that PCa patients had higher concentration of cell-free DNA in plasma as compared to men with benign prostatic hyperplasia.Citation25,Citation26 In addition, elevated blood cell-free DNA concentration was significantly associated with increased risk of biochemical recurrence within 2 years of RP, indicating more aggressive nature of cancer.Citation27,Citation28 The increased nucleic acid bases mostly originated from the increased tumor cell proliferation rate, which was considered as an important parameter for cancer detection and monitoring.Citation29 However, several recent studies reported that the detection of circulating tumor cells did not correlate significantly with clinical characteristics, or the development of biochemical recurrence. Of course, larger cohorts with extended follow-up are needed to validate these findings. In our study, although the SERS spectra could only provide rough information of nucleic acid bases, like concentrations of adenine, hypoxanthine, rather than determined aberrant tumor DNA sequences, the Raman spectral peaks corresponded well to the entire change of blood nucleic acid bases. It was recognized that time to biochemical recurrence may be closely associated with the risk of clinical metastases,Citation4,Citation5 hence we speculated that those Raman spectral features in our study might be emblem of occult metastases in patients who developed early biochemical recurrence. In other words, the distinct Raman spectral peaks 725 (coenzyme A), 1,328 (lipids), and 1,447 cm−1 (phospholipids) might also result from dysregulation of lipid metabolism, such as increased lipid accumulation, upregulation of several lipogenic enzymes (coenzyme A), and dysregulation of phospholipid metabolism.Citation30 SERS peak at 1,014 cm−1 was found lower in biochemical recurrence plasma as compared to bRFS, indicating a decrease in the percentage of phenylalanine relative to the total SERS-active molecular composition. Decrease in Raman signals of phenylalanine were also observed in nasopharyngeal cancer, blood, and gastric malignancy tissues,Citation19,Citation20 suggesting that the phenylalanine metabolism was probably associated with tumor formation and progression.
Since the SERS was comprehensive for sample analysis, the Raman spectra of plasma mostly reflected rough and mixed information of various components in blood. The value of distinct Raman peaks for early biochemical recurrence prediction was evaluated and 1,328 cm−1 was considered valuable for early biochemical recurrence prediction. The typical Raman spectral peak 1,328 cm−1 was associated with significant risk of early biochemical recurrence in univariate and multivariate Cox regression models and stronger intensity of Raman indicated higher risk of early biochemical recurrence. Kaplan–Meier curve showed patients with high intensity (≥median intensity) in Raman peak 1,328 cm−1 were more likely to develop early biochemical recurrence within 2 years. These results indicated that Raman peak 1,328 cm−1 could be an independent risk factor for early biochemical recurrence. The CAPRA-S score was considered as performing tool for recurrence prediction after RP, which was well validated in the Shared Equal Access Regional Cancer Hospital database, which included a large, multi-institutional cohort of patients.Citation8 The CAPRA-S score incorporated all important risk factors including PSA, Gleason score, positive surgical margin, seminal vesicle invasion, and T-stage. The clinical characters in our study were consistent with previous studies. The early biochemical recurrence group contained significantly higher proportion of high risk (6–10) CAPRA-S than bRFS group (47% vs 3%). The CAPRA-S and Raman peak 1,328 cm−1 were both significantly independent predictor of early biochemical recurrence. Although the Raman peak 1,328 cm−1 did not perform better than CAPRA-S alone for early biochemical recurrence prediction, discrimination was better when combined them together. In addition, PCA-LDA model based on SERS spectra showed good ability of discriminating early biochemical recurrence from bRFS patients, and then was validated by the leave-one-spectrum-out cross-validation method, which revealed the diagnostic sensitivity, specificity, and accuracy of 65.8%, 87.5%, and 79.4%, respectively.
Several limitations for our study should be stated. First, the study was conducted in a single center and the sample size was relatively small. To reduce variation, we collected three SERS spectra from different regions of each sample for data analysis, and the results demonstrated that the Raman spectra between two groups were significantly different. Further study with larger sample number would be desirable to validate our results. Second, the component changes reflected by SERS were on the basis of tentative assignments in published documents and RS database, which may be confirmed by other methods in future studies. Despite those limitations, our study firstly reported the promising results of SERS analysis of serum components for the prediction of early biochemical recurrence, which might be meaningful for developing individual treatment strategies. Our preliminary study might promote the application of SERS in medicine.
Conclusion
In conclusion, in this preliminary study, we have reported the value of SERS analysis of preoperative plasma to identify patients with high risk of early biochemical recurrence (at ≤2 years of RP) after RP. The addition of distinct SERS spectra could improve the power of classic clinical model for early biochemical recurrence prediction in PCa patients.
Acknowledgments
This study was supported by National Natural Science Foundation of China (81572536, 81672850), Science and Technology Commission of Shanghai Municipality (14140901700, 16411969800), the Joint Research Foundation for Innovative Medical Technology of Shanghai Shenkang Hospital Development Center (SHDC12015125), Shanghai Municipal Education Commission (15ZZ058), Shanghai Municipal Commission of Health and Family Planning (201640247), Shanghai Municipal Education Commission-Gaofeng Clinical Medicine Grant Support (20152215), Key Disciplines Group Construction Project of Pudong Health Bureau of Shanghai (PWZxq2014-05), and Innovation Fund for Translational Research of Shanghai Jiao Tong University School of Medicine (15ZH4002).
Supplementary material
Table S1 Clinical and pathologic information of the study subjects
Disclosure
The authors report no conflicts of interest in this work.
References
- SiegelRLMillerKDJemalACancer statistics, 2016CA Cancer J Clin201666173026742998
- NovaraGFicarraVMocellinSSystematic review and meta-analysis of studies reporting oncologic outcome after robot-assisted radical prostatectomyEur Urol201262338240422749851
- FreedlandSJHumphreysEBMangoldLARisk of prostate cancer-specific mortality following biochemical recurrence after radical prostatectomyJAMA2005294443343916046649
- FossatiNKarnesRJCozzariniCAssessing the optimal timing for early salvage radiation therapy in patients with prostate-specific antigen rise after radical prostatectomyEur Urol201669472873326497924
- AbugharibAJacksonWCTumatiVVery early salvage radiotherapy improves distant metastasis-free survivalJ Urol2017197366266827614333
- MessingEMManolaJYaoJImmediate versus deferred androgen deprivation treatment in patients with node-positive prostate cancer after radical prostatectomy and pelvic lymphadenectomyLancet Oncol20067647247916750497
- TilkiDMandelPSchlommTExternal validation of the CAPRA-S score to predict biochemical recurrence, metastasis and mortality after radical prostatectomy in a European cohortJ Urol201519361970197525498570
- PunnenSFreedlandSJPrestiJCMulti-institutional validation of the CAPRA-S score to predict disease recurrence and mortality after radical prostatectomyEur Urol20146561171117723587869
- WalzJChunFKKleinEANomogram predicting the probability of early recurrence after radical prostatectomy for prostate cancerJ Urol2009181260160819084864
- HansenJBianchiMSunMPercentage of high-grade tumour volume does not meaningfully improve prediction of early biochemical recurrence after radical prostatectomy compared with Gleason scoreBJU Int2014113339940724053339
- KellyRSVander HeidenMGGiovannucciEMucciLAMetabolomic biomarkers of prostate cancer: prediction, diagnosis, progression, prognosis, and recurrenceCancer Epidemiol Biomarkers Prev201625688790627197278
- MaxeinerAAdkinsCBZhangYRetrospective analysis of prostate cancer recurrence potential with tissue metabolomic profilesProstate201070771071720017167
- McdunnJELiZAdamKPMetabolomic signatures of aggressive prostate cancerProstate201373141547156023824564
- StablerSKoyamaTZhaoZSerum methionine metabolites are risk factors for metastatic prostate cancer progressionPLoS One201168e2248621853037
- LaneLAQianXNieSSERS nanoparticles in medicine: from label-free detection to spectroscopic taggingChem Rev201511519104891052926313254
- BastúsNGComengeJPuntesVPuntesVKinetically controlled seeded growth synthesis of citrate-stabilized gold nanoparticles of up to 200 nm: size focusing versus Ostwald ripeningLangmuir20112717110981110521728302
- JermynMDesrochesJAubertinKA review of Raman spectroscopy advances with an emphasis on clinical translation challenges in oncologyPhys Med Biol20166123R370R40027804917
- AubertinKTrinhVQJermynMMesoscopic characterization of prostate cancer using Raman spectroscopy: potential for diagnostics and therapeuticsBJU Int2018122232633629542855
- SchlückerSSurface-enhanced Raman spectroscopy: concepts and chemical applicationsAngew Chem Int Ed Engl201453194756479524711218
- FengSChenRLinJNasopharyngeal cancer detection based on blood plasma surface-enhanced Raman spectroscopy and multivariate analysisBiosens Bioelectron201025112414241920427174
- FengSChenRLinJGastric cancer detection based on blood plasma surface-enhanced Raman spectroscopy excited by polarized laser lightBiosens Bioelectron20112673167317421227679
- FengSLinDLinJBlood plasma surface-enhanced Raman spectroscopy for non-invasive optical detection of cervical cancerAnalyst2013138143967397423529624
- XiaoRZhangXRongZNon-invasive detection of hepatocellular carcinoma serum metabolic profile through surface-enhanced Raman spectroscopyNanomedicine20161282475248427520725
- ShaoXPanJWangYEvaluation of expressed prostatic secretion and serum using surface-enhanced Raman spectroscopy for the noninvasive detection of prostate cancer, a preliminary studyNanomedicine20171331051105927979746
- FengJGangFLiXPlasma cell-free DNA and its DNA integrity as biomarker to distinguish prostate cancer from benign prostatic hyperplasia in patients with increased serum prostate-specific antigenInt Urol Nephrol20134541023102823779229
- YinCLuoCHuWDingXYuanCWangFQuantitative and qualitative analysis of circulating cell-free dna can be used as an adjuvant tool for prostate cancer screening: a meta-analysisDisease Markers201620164112
- BastianPJPalapattuGSYegnasubramanianSPrognostic value of preoperative serum cell-free circulating DNA in men with prostate cancer undergoing radical prostatectomyClin Cancer Res20071318 Pt 15361536717875764
- WroclawskiMLSerpa-NetoAFonsecaFLCell-free plasma DNA as biochemical biomarker for the diagnosis and follow-up of prostate cancer patientsTumour Biol20133452921292723715778
- Di MeoABartlettJChengYPasicMDYousefGMLiquid biopsy: a step forward towards precision medicine in urologic malignanciesMol Cancer20171618028410618
- WuXDanielsGLeePMonacoMELipid metabolism in prostate cancerAm J Clin Exp Urol20142211112025374912