
Abstract
Background
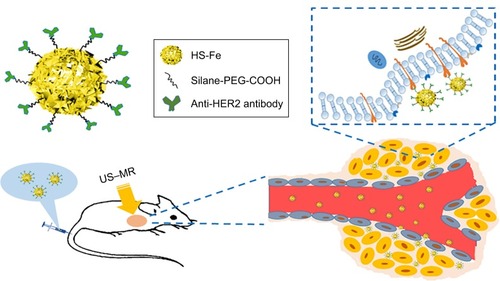
Multimodal contrast agents with low toxicity and targeted modification have opened up new possibilities for specific imaging of breast cancer and shown broad application prospects in biomedicine and great potential for clinical transformation. In this work, a potential multifunctional imaging agent was developed by doping Fe into hollow silica nanoparticles (HS-Fe NPs), followed by modification with specific anti-HER2 antibodies, enabling the NPs to have dual-mode ultrasound (US)–magnetic resonance (MR)-specific imaging capacity with low toxicity.
Methods
Anti-HER2 antibodies were conjugated to silane–polyethylene glycol (PEG)–COOH-modified HS-Fe (HS-Fe-PEG) NPs to produce HER2-targeted HS-Fe-PEG (HS-Fe-PEG-HER2) NPs. The toxicity of HS-Fe-PEG-HER2 NPs on targeted cells in vitro and blood and organ tissue of mice in vivo was investigated. Distribution in vivo was also studied. Confocal laser-scanning microscopy and flow cytometry were used to evaluate the targeting ability of HS-Fe-PEG-HER2 NPs in vitro. US and MR instruments were used for imaging both in vivo and in vitro.
Results
The obtained HS-Fe-PEG-HER2 NPs (average diameter 234.42±48.76 nm) exhibited good physical properties and biosafety. In solution, they showed obvious enhancement of the US signal and negative contrast in T2-weighted MR imaging. The binding rate of HS-Fe-PEG-HER2 NPs to targeted cells (SKBR3) was 78.97%±4.41% in vitro. US and MR imaging in vivo confirmed that the HS-Fe-PEG-HER2 NPs were delivered passively into the tumor region of SKBR3 and bound specifically to tumor cells. Target enhancement was better than untargeted and targeted competition groups.
Conclusion
HS-Fe-PEG-HER2 NPs have potential as a low-cytotoxicity and dual-mode US–MR-specific imaging agent.
Introduction
Breast cancer is a malignancy with high internal heterogeneity at the molecular level.Citation1 Individualized therapies can be formulated according to different molecular subtypes. Breast cancer–treatment methods include surgery, chemoradiotherapy, endocrine therapy, and molecular targeted therapy. Among these, targeted therapy is aimed mainly at HER2-overexpression breast cancer.Citation2–Citation4 At present, immunohistochemistry is used mainly to analyze HER2-protein expression in pathological tissue obtained by coarse-needle biopsy or surgical resection.Citation5,Citation6 However, this method is invasive, time-consuming, and costly, and some patients might need multiple examinations to obtain accurate immunohistochemical results. Therefore, we envisaged a simpler, faster, and visualized preoperative examination method to obtain HER2 information from breast lesions.
Conventional ultrasound (US) and magnetic resonance (MR) are the main means of breast screening.Citation7,Citation8 Enhanced-imaging examinations improve the detection sensitivity and diagnostic accuracy of early breast cancer.Citation9–Citation13 However, current clinical application of US or MR imaging (MRI) results cannot provide molecular classification information for lesions, and most are suitable only for single imaging. Moreover, large-particle contrast agents can be used only for angiography.
The rise of molecular probes and development of nano-multimodal imaging technology provided the opportunity to solve these clinical problems.Citation14–Citation17 Although many studies showed good imaging or therapeutic results, safety and patient tolerance remained key to clinical conversion.Citation18–Citation20 SiO2 nanoparticles (NPs) are widely used in biomedical and other fields, because of their adjustable particle size, functionality, stability, and good biocompatibility.Citation21–Citation23 Pohaku et al prepared a novel type of NP by doping iron(III) into hollow silica (HS) nanoshells, which could be degraded in serum at physiological temperature.Citation24 Yu et al invented a new metal-doping method, in which hollow, nanometer-sized silica microspheres were prepared by doping them with Mn and proved to be highly biocompatible in vivo.Citation25 Taking advantage of the reported metal-doping method,Citation25,Citation26 we doped Fe, rich in the human body, into SiO2 NPs to prepare HER2-targeted Fe-doped HS NPs that could be applied to both US and MRI, with the advantages of both, which might improve diagnostic sensitivity and specificity in HER2-positive breast cancer ().
Methods
Material
Iron(II) acetate was obtained from Titan Technology (Shanghai, China). Silane–polyethylene glycol (PEG)– COOH (molecular weight 2,000) was obtained from Ruixi Biological Technology (Xian, China). Hydroxylamine hydrochloride, 1-ethyl-(3-dimethylaminopropyl)carbodiimide (EDC) hydrochloride, and N-hydroxysuccinimide (NHS) were purchased from Aladdin Chemistry (Shanghai, China). Rabbit antihuman HER2 monoclonal antibody and fluorescein isothiocyanate (FITC)–conjugated rabbit antihuman HER2 monoclonal antibody were obtained from Abcam (Cambridge, UK). Tetraethyl orthosilicate and other chemical reagents were purchased from Sinopharm Chemical Reagent (Shanghai, China).
Preparation of HS-Fe NPs
SiO2 NPs were prepared by a previously reported modified Stöber experimental process.Citation27 Briefly, 1.5 mL deionized water, 50 mL ethanol, and 2.5 mL ammonia were mixed completely and slowly heated to 55°C at a stirring rate of 1,000 rpm for 5 minutes. Subsequently, 2 mL tetraethyl orthosilicate was dripped into the mixture at 8 mL/hour with a syringe pump and stirred for an additional 5 hours. This mixture was centrifuged (10,000 rpm, 5 minutes) and washed with deionized water twice.
Then, 30 mg SiO2 NPs and 200 mg iron(II) acetate were dissolved completely in 18 mL deionized water. The mixture was transferred to a high-temperature reactor and reacted for 24 hours in an oven at 180°C under hydrothermal conditions. The chemical reaction was terminated and the mixture was cooled to room temperature. The resulting HS-Fe was centrifuged (9,000 rpm, 5 minutes), washed with an ethanol–deionized water solution (v:v 1:1) five times, and dispersed in deionized water for use.
Preparation of HS-Fe-PEG NPs
For synthesis of HS-Fe-PEG NPs, 30 mg silane–PEG-COOH was dissolved in 10 mL ethanol and 10 mL ammonia, and then 10 mg HS-Fe NPs was added. After 24 hours’ incubation with shaking at 37°C, the HS-Fe-PEG NPs were centrifuged (8,000 rpm, 4 minutes) and redispersed in PBS three times.
Preparation of HS-Fe-PEG-HER2 NPs
To activate the -COOH groups in HS-Fe-PEG NPs to conjugate with anti-HER2 antibody, 8 mg EDC and 12 mg NHS were added to 30 mg HS-Fe-PEG suspended in 20 mL PBS. The mixture was stirred at 37°C for 4 hours. To remove excess EDC and NHS polymer, the yield was centrifuged (10,000 rpm, 5 minutes) with PBS three times. Then, 20 mg HS-Fe-PEG and 20 µL anti-HER2 antibody were suspended in 20 mL PBS. After 12 hours’ incubation at 37°C with shaking, HS-Fe-PEG-HER2 NPs were collected by centrifugation (10,000 rpm, 5 minutes) with PBS and washed three times, then dispersed in PBS for use.
Characterization
Size distribution and ζ-potential of SiO2, HS-Fe, HS-Fe-PEG, and HS-Fe-PEG-HER2 NPs were tested by dynamic laser scattering (ZS3690; Malvern Instruments, Malvern, UK). Dimensions and structure of NPs were detected with transmission electron microscopy (TEM; JEM-2100F; Jeol, Tokyo, Japan).
In vitro US–MRI
The US-imaging capability of HS-Fe-PEG-HER2 NPs in vitro as a contrast-enhancement agent was evaluated by a US diagnostic instrument (MyLab 90; Esaote, Genoa, Italy) with an LA522 linear transducer (Esaote). Different concentrations (0.5, 1, 1.5, 2 mg/mL) of HS-Fe-PEG-HER2 NPs suspended in PBS and PBS only as a control group were contained in 2 mL Eppendorf tubes, and the tubes were imaged in a deionized water tank. Simultaneous imaging of conventional B and contrast-enhanced US (CEUS) modes in the second harmonic imaging program of the US diagnostic instrument was used to observe US-imaging effects in real time. Parameters set were mechanical index 0.06, frequency 7.5 MHz, gain 40%, depth 15 mm, and power 11%. The relative signal value was derived from the instrument’s image software, and fitting curves were drawn by MatLab.
Inductively coupled plasma atomic emission spectroscopy (ICP-AES; Varian Medical Systems, Palo Alto, CA, USA) was used to determine the Fe concentration of HS-Fe-PEG-HER2 NPs. With deionized water as a control group, samples with various Fe concentrations (2.9, 1.6, 0.8, 0.39, 0.2, 0.1 mM) were dispersed in deionized water. All these were placed in 2 mL Eppendorf tubes and measured with a 0.5 T MRI scanner (MiniMR-60, Niumag, Shanghai, China) to obtain T1- and T2-weighted MRI. Through fitting plots of the inverse relaxation times 1/T1 and 1/T2 s−1 vs Fe concentration (mM), the relaxation coefficients r1 and r2 were obtained.
Biocompatibility and biodistribution
Cytotoxicity
The cytotoxicity of HS-Fe-PEG-HER2 NPs was evaluated with CCK8 assays (Dojindo, Kumamoto, Japan). All experimental cell lines – SKBR3, MDA-MB231, and the normal human hepatocyte cell line LO2 – purchased from the Institute of Biochemistry and Cell Biology, Shanghai Institutes for Biological Sciences, Chinese Academy of Sciences (Shanghai, China) were seeded in 96-well plates at a density of 105 cells/well. Different concentrations of HS-Fe-PEG-HER2 (10, 20, 50, 100, 200 µg/mL) and PBS (negative control) were added to the cells. Wells containing each concentration group were punctured with five compound holes and incubated for 12 hours and 24 hours separately, followed by the addition of 10 µL CCK8 to each hole and 5 minutes of incubation at 37°C. A microplate reader (Varioskan Flash; Thermo Fisher Scientific, Waltham, MA, USA) measured the absorbance at 490 nm.
Apoptosis
After cells had adhered to the walls of six-well plates, the PBS control group and HS-Fe-PEG-HER2 NPs at different concentrations (50, 100, 200 µg/mL) were added to each well, followed by 24 hours of incubation. Wells containing each group were punctured with three compound holes. Cells (4×10⁵) were collected by centrifugation (1,500 rpm, 5 minutes) with PBS and washed twice. Cells were suspended in 100 µL binding buffer, and then 5 µL annexin V–FITC and 5 µL propidium iodide staining solution were added. Binding buffer (400 µL) was mixed gently after incubation for 10 minutes at room temperature, and cells were detected with flow cytometry (FCM; Beckman Coulter, Brea, CA, USA).
Toxicity in vivo
Animal experiments in the study followed the guidelines set by the China Council on Animal Care and were approved by the Ethics Committee and Animal Care Committee of Ruijin Hospital, Shanghai Jiao Tong University School of Medicine. Toxicity tests were conducted on healthy BALB/c white mice (4 weeks, 50% female, 50% male, n=3 each) provided by Vital River Laboratory Animal Technology (Beijing, China). Uninjected mice were used as the control group.
Weight was recorded every 4 days for a month after injection of HS-Fe-PEG-HER2 NPs in quantities of 5, 10, or 15 mg/kg via the tail vein. Blood was collected from the orbit at 1 hour, 4 hours, 8 hours, 24 hours, 7 days, and 14 days after 15 mg/kg HS-Fe-PEG-HER2 NP injection for hematological study. Serum indicators in biochemistry tests comprised five hepatic indices (ALT, ALP, AST, total bilirubin, and direct bilirubin) and two kidney-function indices (blood urea nitrogen and serum creatinine). Major blood-cell analysis included red blood cells, white blood cells, platelets, monocytes, hemoglobin, and lymph cells. Mice were killed and tissue samples (heart, liver, spleen, lung, kidney) taken. After fixation with 4% paraformaldehyde, paraffin-embedded sections were used for H&E staining and histopathological analysis.
Distribution in blood circulation and organs
Healthy BALB/c mice (n=4) were injected with PBS solution containing HS-Fe-PEG-HER2 NPs (10 mg/kg). At specific times (15 and 30 minutes and 1, 2, 4, 8, and 12 hours), 100 µL peripheral blood was collected from the tail vein, and blood samples were digested with concentrated nitric acid and deionized water. The Fe concentration in blood was measured by ICP-AES.
BALB/c white mice (n=4) were killed at 6, 12 or 24 hours after HS-Fe-PEG-HER2 NPs had been injected. Hearts, livers, spleens, lungs, and kidneys were removed and predigested in 5 mL concentrated nitric acid at room temperature. When the organs had completely dissolved, the mixture was placed on a heating plate preheated to 300°C, and 5 mL nitric acid was added again. Every 10–15 minutes, 3 mL deionized water was added until tissue had been fully digested. The content of Fe was determined by ICP-AES.
In vitro specific targeting studies
Two types of human breast cancer cell lines were used in this study: SKBR3 with high expression of HER2 antigen, and MDA-MB-231 with low expression of HER2 antigen. Qualitative observations were conducted in four groups: simple cells, targeted competition, untargeted, and targeted. For quantitative detection, five groups were included: besides the same four groups as in the qualitative observation, a group receiving only anti-HER2 antibody was set up.
Qualitative observation by CLSM
The two types of cells were seeded in confocal cell-culture dishes at a density of 105 cells/well. The untargeted and targeted-cell groups were treated with 100 µL HS-Fe-PEG NPs and HS-Fe-PEG-HER2 NPs, respectively. The targeted competition cell group was incubated with 20 µL anti-HER2 antibody for 30 minutes and then washed with PBS three times. After that, 100 µL HS-Fe-PEG-HER2 NPs was added. No NPs were administered in the simple-cell group. The groups were cultured for 30 minutes after these interventions. Cells were washed three times with PBS and then fixed with 4% paraformaldehyde for 20 minutes. Then, DAPI solution was used to stain cell nuclei for 5 minutes. Finally, confocal laser-scanning microscopy (CLSM; TCS SP5 II; Leica, Wetzlar, Germany) was used for qualitative observation.
Quantitative detection by FCM
SKBR3 and MDA-MB-231 were cultured in six-well plates. Wells containing each group were punctured with three compound holes and administered as described for CLSM. Cells in the anti-HER2-antibody-only group were treated with 20 µL FITC-conjugated anti-HER2 antibody for 30 minutes. After digestion and centrifugation (1,500 rpm, 5 minutes), 105 cells/well were collected in 1.5 mL Eppendorf tubes for detection of fluorescence intensity using FCM (Beckman Coulter).
Tumor US–MRI in vivo
Tumor model
Female BALB/c nude mice (4 weeks) were provided by Vital River Laboratory Animal Technology. To establish subcutaneous breast cancer tumors, each nude mouse was injected with 200 µL mixed suspension of 107 SKBR3 cells and Matrigel (Corning, NY, USA) into the upper back near the forelegs subcutaneously. The mice were used for US and MRI in vivo until tumor volume had grown to 100–200 mm3. Three mice were randomly selected to verify the expression of HER2 in tumor tissue by immunofluorescence.
Tumor imaging
Experiments were divided into three groups: targeted, untargeted, and targeted competition. Mice were anesthetized using 5% chloral hydrate (0.1 mL/10 g) peritoneal injections. Mice in the targeted and untargeted groups were injected with 200 µL HS-Fe-PEG-HER2 and HS-Fe-PEG PBS solution (10 mg/mL) through the tail vein. Mice in the targeted competition group were first injected with 20 µL anti-HER2 antibody diluted in 200 µL PBS solution. Thirty minutes after that, these mice were then injected with 200 µL HS-Fe-PEG-HER2 NPs.
US imaging was conducted using the MyLab 90 and LA522 linear transducer in second harmonic imaging-contrast mode to observe dual B-mode and CEUS images simultaneously in real time. Parameters were frequency 7.5 MHz, gain 40%, depth 37 mm, power 11%, and mechanical index 0.1. Mice were placed on a heating plate to maintain their body temperature. US gel was used on the tumors to minimize bubble interference. US images of the tumors of nude mice before and after injection were collected and then analyzed with time–intensity curves (TICs) by MatLab.
T2-weighted MRI was performed on a 3 T system (Signa; GE Healthcare, Little Chalfont, UK) with a small-animal coil (Chenguang, Shanghai, China). Anesthetized mice bearing tumors were scanned using a fast spin–echo sequence pre- and postinjection of NPs via the tail vein, with the following scan parameters: repetition time 1,800 ms, time to echo 33 ms, field of view 30×30 mm, matrix size 256×256, and slice thickness 1 mm. ImageJ analysis software was used to analyze and compare the MRI-signal intensity of the tumor areas.
Immunofluorescence of tumors
After the in vivo imaging experiments, mice were killed and tumors removed. H&E staining was performed on part of the tissue sections. Paraffin-embedded sections were dewaxed and EDTA buffer (pH 9) used for antigen repair. HER2 expression in tumor cells was confirmed by washing, sealing, and incubation with HER2 antibody. Nuclei were restained with DAPI and sealed. Images were then observed and captured under fluorescence microscopy.
Statistical analyses
Quantitative experimental data are recorded as means ± SD. Independent-sample data were analyzed with Student’s t-test. Statistical analysis was performed using SPSS 20.0. P<0.05 was considered statistically significant.
Results and discussion
Characterization of NPs
The initial SiO2 NPs were prepared by an adapted Stöber method.Citation27 TEM () showed that SiO2 was composed of uniform NPs with a mean diameter of 205.05±27.93 nm (). In accordance with previous studies,Citation25,Citation26 iron(II) acetate was used as an etching agent to synthesize HS-Fe NPs by the hydrothermal method. First, SiO2 NP surface was hydrolyzed to generate H4SiO4 under hydrothermal conditions, and active sites appeared. Then, active site-absorbed iron acetate produced CO2 and other gases and formed a gas– liquid interface. H4SiO4 reacted with iron ions to form thin sections that gradually accumulated at the gas–liquid interface. When SiO2 had been completely exhausted, Fe-doped silica NPs were generated in the nanospheres to form a thin sheet of iron silicate. As can be seen from TEM (), the HS-Fe NPs appeared as uniform hollow spheres with rough shell surfaces and a clear cavity structure. Their mean size was 216.78±38.33 nm (). Theoretically, NPs with a cavity structure can be used as US-imaging agents. In addition, the rough shell surfaces of the NPs prepared in this experiment presumably increased the specific surface area of the particles, which might have been conducive to enhancing the echo signal.
Figure 1 Characterization of NPs.
Notes: (A) TEM of SiO2. (B) DLS of SiO2. (C) TEM of HS-Fe NPs. (D) DLS of HS-Fe NPs. (E) Elemental mapping (O, Si, Fe) in HS-Fe NPs and (F) EDS of HS-Fe NPs. (G) Weight percentage of O, Si, Fe in HS-Fe NPs. (H) ζ-potential of SiO2, HS-Fe, HS-Fe-PEG, and HS-Fe-PEG-HER2 NPs.
Abbreviations: NPs, nanoparticles; TEM, transmission electron microscopy; DLS, dynamic light scattering; EDS, energy dispersive X-ray spectrometry; PEG, polyethylene glycol.
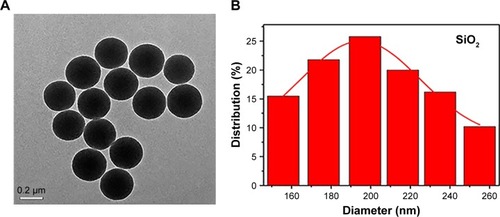
Energy-dispersive X-ray spectroscopy of HS-Fe () showed that the NPs contained O, Si, and Fe, with weight percentages of 47.87%, 18.78%, and 33.35%, respectively (). The distribution of O, Si, and Fe was demonstrated by elemental mapping of HS-Fe NPs (). This showed that the Fe content was doped mainly into the shells, where it was distributed uniformly. Considering the high magnetic susceptibility of Fe, this implied that the NPs would be detectable by MRI.
We also measured the average diameters of HS-Fe-PEG (227.13±40.51 nm) and HS-Fe-PEG-HER2 NPs (234.42±48.76 nm) and their ζ-potentials, which were -28.57±1.51 mV and -13.2±0.41 mV (), respectively. As a result of Fe doping, the ζ-potential of HS-Fe NPs (-37±4.03 mV) was higher than that of SiO2 (-54.12±4.21 mV). The ζ-potentials of HS-Fe-PEG and HS-Fe-PEG-HER2 were also changed with respect to that of SiO2, due to the modification with silane–PEG-COOH and the formation of a junction with anti-HER2 antibody, respectively. This series of ζ-potential changes provided a basis for the successful preparation of HS-Fe-PEG-HER2.
US–MRI in vitro
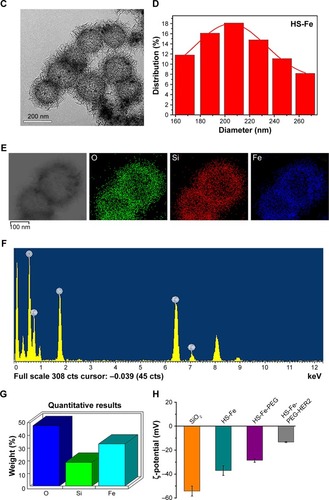
To investigate whether the designed and prepared HS-Fe-PEG-HER2 NPs were suitable for US and MRI, in vitro imaging experiments of different concentrations of HS-Fe-PEG-HER2 NP solution were carried out. US images were obtained in two imaging modes: B and CEUS. Quantitative analyses of CEUS images were conducted via TICs. As shown in , the HS-Fe-PEG-HER2 NP solution displayed US signals under both modes, but the nonlinear CEUS mode presented stronger and more obvious signals than the B-mode. In other words, the CEUS mode was more sensitive to the signal of the NPs. This could be interpreted as the novel NPs being more suitable for CEUS imaging conditions in existing US instruments. The signal strength of US images was enhanced with increasing concentration, and TICs also showed the same trend. No obvious US signal was found in the PBS control group. The results of US imaging in vitro indicated that the HS-Fe-PEG-HER2 NPs could be used as a contrast agent for US imaging.
Figure 2 In vitro US and T2-weighted MR images of HS-Fe-PEG-HER2 NPs.
Notes: (A) B-mode, CEUS images, and TICs of HS-Fe-PEG-HER2 NPs at different concentrations (2, 1.5, 1, 0.5 mg/mL) and PBS control. (B) Fitting curve of Fe concentration. (C) T2-weighted MR images of HS-Fe-PEG-HER2 NPs.
Abbreviations: US, ultrasound; MR, magnetic resonance; HS, hollow silica; PEG, polyethylene glycol; NPs, nanoparticles; B-mode, brightness mode; CEUS, contrast-enhanced US; TICs, time–intensity curves; ROI, region of interest.
The potential of HS-Fe-PEG-HER2 NPs as an MR-contrast agent was evaluated by detecting the longitudinal (T1) and transverse (T2) relaxation times of HS-Fe-PEG-HER2 NPs using a 0.5 T MR scanner. According to the fitting curve (), r1 was 0.742 mM/second, r2 4.657 mM/second, and the ratio of r2:r1 6.276. A T2-weighted MR-contrast imaging effect can be seen in . With the continuous increase in Fe concentration of the nanomaterials, the T2-weighted MR image gradually darkened. After comparison with the T1-weighted MRI (), we finally selected the T2-weighted MRI function of HS-Fe-PEG-HER2 NPs.
Biocompatibility and biodistribution
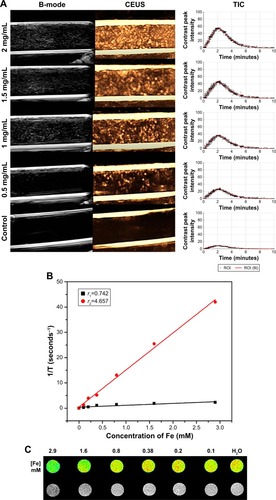
Many new nanoscale contrast agents have proven difficult to convert into clinical application, due to their toxicity and poor biosafety.Citation28–Citation32 Therefore, after determining the suitability of our contrast agent for imaging in vitro, we next systematically investigated its biotoxicity in vitro and in vivo. The cytotoxicity of HS-Fe-PEG-HER2 NPs in vitro was evaluated with CCK8. PBS was used as a negative control. As shown in , .80% of the SKBR3, MDA-MB-231, and LO2 cells remained active after coincubation with different concentrations of NPs (10, 20, 50, 100, 200 µg/mL) for 12 and 24 hours. This indicated that the material had low cytotoxicity. Further, apoptosis of cells exposed to HS-Fe-PEG-HER2 NPs was investigated by FCM with annexin V–FITC–propidium iodide. Various cells were incubated with PBS and HS-Fe-PEG-HER2 (50, 100, 200 µg/mL) for 24 hours to compare survival rates at each concentration. As shown in , survival rates of cells were .85% for all three types of cells at each concentration. There was no statistically significant difference among different concentrations for any of the cell types (P>0.05). This suggested that HS-Fe-PEG-HER2 had no effect on the survival of the three types of cells. Therefore, a preliminary conclusion could be drawn that it had low toxicity and could be further used to assess its biological safety in vivo.
Figure 3 In vitro cytotoxicity and apoptosis of HS-Fe-PEG-HER2 NPs on SKBR3, MDA-MB-231, and LO2 cells.
Notes: (A) Cell viability analyzed by CCK8 at different concentrations of HS-Fe-PEG-HER2 NPs (10, 20, 50, 100, 200 mg/mL) and PBS for 12 and 24 hours. (B) Apoptosis detected by annexin V–FITC–PI at different concentrations of HS-Fe-PEG-HER2 NPs (50, 100, 200 mg/mL) and PBS for 24 hours and (C) comparison of normal cell-survival rates.
Abbreviations: HS, hollow silica; PEG, polyethylene glycol; NPs, nanoparticles; FITC, fluorescein isothiocyanate; PI, propidium iodide.
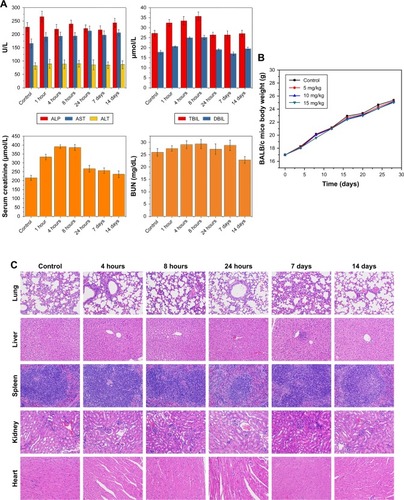
Accordingly, we monitored its biotoxicity in vivo. All in vivo experiments in this study were conducted by intravenous injection of NPs. This mode of administration has also been commonly used in other in vivo studies of nanoscale contrast agents with similar NP-size ranges.Citation33–Citation37 Serum biochemical indices () and the results of main blood-cell analysis () showed that all parameters were within the normal range at each time point. The body weight of mice also played an important role in the biosafety investigation of materials. As shows, there was no significant difference in body weight among mice injected with different doses of the material, and they all gained weight. This illustrated that HS-Fe-PEG-HER2 did not affect the growth of mice. H&E-stained tissue sections of major organs at different times were similar to normal tissue (). Both in vitro and in vivo research data allowed to conclude that the new nanomaterial HS-Fe-PEG-HER2 had good biological safety and could be used for in-depth biomedical research.
Figure 4 In vivo toxicity of HS-Fe-PEG-HER2 NPs on healthy BALB/c mice.
Notes: Control group received no NP injections. (A) Blood biochemical markers at different time points (1 hour, 4 hours, 8 hours, 24 hours, 7 days, 14 days). Liver function (ALP, AST, ALT, total bilirubin, direct bilirubin), kidney function (creatinine and BUN). (B) Weight changes over time after injection with HS-Fe-PEG-HER2 NPs (5, 10, 15 mg/kg). (C) H&E staining (400×) of lung, liver, spleen, kidney, and heart at 4 hours, 8 hours, 24 hours, 7 days, and 14 days.
Abbreviations: HS, hollow silica; PEG, polyethylene glycol; NPs, nanoparticles; BUN, blood urea nitrogen.
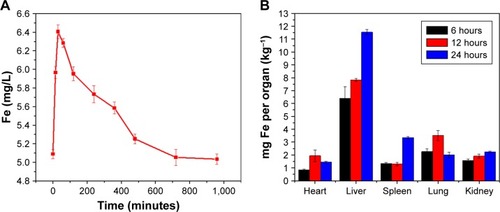
The biodistribution of HS-Fe-PEG-HER2 NPs was monitored via the distribution of Fe. The Fe content in the peripheral blood and main organs was determined by ICP-AES in healthy BALB/c mice. The results () showed that the Fe content in peripheral blood increased immediately after injecting the HS-Fe-PEG-HER2 NPs and reached a peak at 30 minutes. With time, the Fe content in peripheral blood decreased gradually. Fe in peripheral blood recovered to the preinjection level within 12 hours. Fe contents in the main organs (heart, brain, spleen, lungs, liver, and kidneys) of the mice were measured at 6, 12, and 24 hours after intravenous injection to further study the biological distribution of HS-Fe-PEG-HER2 NPs over time. The results () showed that HS-Fe-PEG-HER2 NPs accumulated gradually in the liver, spleen, and kidneys, while their uptake level began to decline 12 hours after injection in the heart and lungs and continued to decline throughout the remaining time. The liver had the highest NP content 24 hours after injection. These results preliminarily indicated that the NPs were mainly absorbed and metabolized by the liver and spleen. All these experimental results testified that the HS-Fe-PEG-HER2 NPs had good biocompatibility.
Figure 5 (A) Peripheral blood curve of injected HS-Fe-PEG-HER2 NPs in BALB/c mice; (B) time variance in biological distribution of HS-Fe-PEG-HER2 NPs in major organs.
Abbreviations: HS, hollow silica; PEG, polyethylene glycol; NPs, nanoparticles.
Targeting capability in vitro
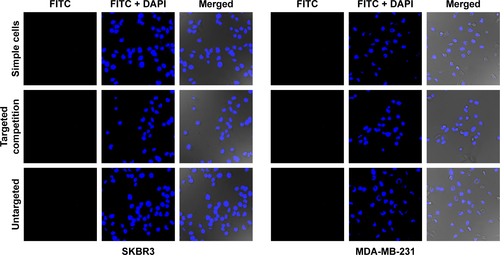
CLSM was used to make a subjective observation on the targeted binding effect of HS-Fe-PEG-HER2 NPs. The targeted material in this investigation was developed by linking the HS-Fe-PEG NPs with FITC-labeled anti-HER2 antibody, and appeared green under laser excitation. Since HER2 is a transmembrane-receptor protein, fluorescence is concentrated primarily at the cell membrane when the antibody-labeled luciferin binds specifically to it. Images of the targeted group were consistent with this proposed mechanism (). Spots or circles of green fluorescence appeared on the SKBR3 cell membranes, whereas no fluorescence was observed in MDA-MB-231 cells. Both cell types exhibited negative fluorescence in the untargeted, targeted competition, and simple-cell groups ().
Figure 6 (A) Confocal microscopy of SKBR3 and MDA-MB-231 incubation with HS-Fe-PEG-HER2 NPs. (B) FCM detected the combined effect of different materials with SKBR3 and MDA-MB-231 cells. HER2 antibodies in HS-Fe-PEG-HER2 labeled with FITC (green), nuclei labeled with DAPI (blue).
Abbreviations: HS, hollow silica; PEG, polyethylene glycol; NPs, nanoparticles; FCM, flow cytometry; FITC, fluorescein isothiocyanate.
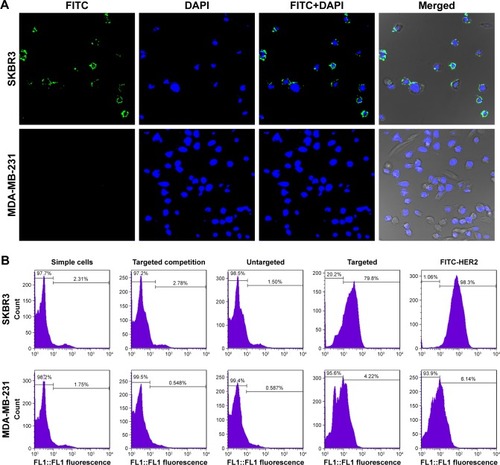
FCM was further used to quantify the targeted binding rate. In addition to the four groups included in the qualitative observation, we additionally set up a control group of pure fluorescent antibody under conditions of cell incubation. By evaluating the expression of HER2 antigen on cell surfaces in this sample, a reference standard was established for quantitative comparison with the binding rate of the targeted group. When cells were treated with the pure fluorescent antibody, parameters including fluorescent antibody dosage and incubation time were set the same as those of the targeted group. Incubation time was limited to 30 minutes in order to reduce the effect of endocytosis on the specific binding fluorescence load. From the FCM results (), it could be seen that the binding rate of pure FITC-labeled HER2 antibody with SKBR3 was as high as 96.9%±2.87%, illustrating that the sample of SKBR3 cells overexpressed HER2 protein. Meanwhile, the binding ratio of the targeted material to SKBR3 was about 78.97%±4.41%, which was statistically significant compared with both the targeted competition and untargeted groups (78.97%±4.41% vs 2.11%±0.52%, 78.97%±4.41% vs 2.13%±0.61%; P<0.05). The binding rates of SKBR3 and MDA-MB231 in the targeted groups were significantly different (78.97%±4.41% vs 3.39%±0.61%; P<0.05). This indicated that the targeted material had good affinity with the specifically targeted SKBR3 cells, and also indirectly proved that the anti-HER2 antibody successfully conjugated to HS-Fe-PEG NPs.
Tumor imaging
Nude mouse model with xenografts of SKBR3 cells
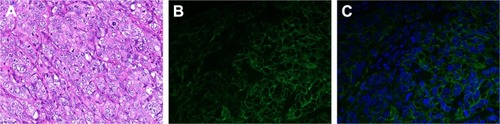
A nude mouse model of a subcutaneous xenograft breast cancer tumor was established using an SKBR3 cell-suspension injection to simulate the highly HER2-expressing human breast cancer environment. In order to verify the expression of HER2 antigens in the tumors, we not only performed immunofluorescence detection on the mice after the in vivo imaging test but also randomly selected three mice for tissue assays of the same tumors when the tumor volume met the requirements of the imaging test, without performing in vivo imaging. H&E staining revealed the structure of tumors (). Immunofluorescence analysis showed blue fluorescence from tumor nuclei (), while HER2 emitted green fluorescence from tumor-cell membranes (), thereby directly displaying the distribution of tumor cells and the expression of antigen. Therefore, it was concluded that a subcutaneous xenograft model of human breast cancer SKBR3 cells had been successfully established.
US in vivo
In vivo US-imaging experiments were performed using a linear array probe capable of providing 7.5 MHz ultrasonic frequency. Changes in US signals were simultaneously monitored by a dual imaging system of B-mode and CEUS, which is frequently used for clinical US examinations. It could be seen that in the targeted group, the US signal of HS-Fe-PEG-HER2 NPs was significantly enhanced in the tumor region after tail-vein injection (). In the targeted competition and untargeted groups, enhanced sites were dispersed and signal enhancement of tumor regions weaker (). The tumor-enhancement effect of CEUS was better than that of B-mode, which was consistent with the conclusion of US imaging in vitro.
Figure 7 In vivo US imaging (B-mode, CEUS, and TICs).
Notes: (A) Targeted group; (B) targeted competition group; (C) untargeted group. Pre-and postintervention (a1, b1, c1 and a2, b2, c2, respectively) US of tumor area; and grayscale time-dependent curves for US of tumor area (a3, b3, c3).
Abbreviations: US, ultrasound; B-mode, brightness mode; CEUS, contrast-enhanced US; TICs, time–intensity curves; ROI, region of interest.
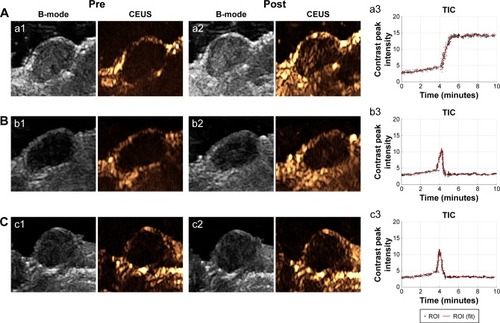
To quantify the increased signal of CEUS in the tumor area, we selected the largest section of the tumor as the measurement area of interest, read the average signal value in the area of interest, and plotted the contrast peak intensity over time. From the TICs (), we could see that the signal intensity of the tumor region in the targeted group increased gradually from about 4 minutes to 5 minutes to reach a peak value, and maintained a stable high level until 10 minutes. This might have been due to the smallness of the targeted NPs, which were able to pass through the endothelial gap of tumor neovascularization into tumor tissue and bind to the specific HER2 antigen on the surface of tumor cells through the specific anti-HER2 antibody that they carried. Moreover, because they were tightly bound and not easily detached, due to the antibody-antigen-specific binding effect, the tumor region maintained a steady high US signal over time, at least within 10 minutes of observation. However, in the targeted competition and untargeted groups, the US signal in the tumor area showed a transient increase at about 4 minutes, but the increase in intensity of the peak was lower than that in the targeted group (). Subsequently, the signal intensity decreased rapidly and remained low. This might have been due to the absence of a specific binding effect, causing the NPs to reside in the tumors for only a short time before being removed by blood circulation. These results indicated that the HS-Fe-PEG-HER2 NPs could be used for the real-time monitoring of tumors by US imaging.
MRI in vivo
In order to replicate more closely the working conditions of actual medical imaging, we chose a 3 T magnetic-field intensity for the MRI test, which corresponded to the high field intensity applied in human body imaging in clinical practice. Subcutaneous xenograft tumors in nude mice were transplanted under the skin of the back of the forelegs, which was roughly in the same transverse section as the lungs. Therefore, transverse MRI of tumors in this study showed mainly lungs and tumors.
Based on the results of the in vitro imaging experiment, T2-weighted MRI was adopted to conduct MRI of tumor-bearing mice. Compared with the MRI preinjection, tumor areas in the targeted group were dimmed after HS-Fe-PEG-HER2 injection (). MRI of tumors in the targeted group after injection was also darker than that in the other two groups after injection. However, there was no significant change in visual observation between pre- and postinjection of NPs in the targeted competition or untargeted groups (). Although other artifacts were avoided as far as possible in the experiment, the anesthetic used in this experiment was chloral hydrate solution, which causes inevitable adverse reactions, such as convulsions, affecting image quality.
Figure 8 In vivo MR imaging.
Notes: (A) Targeted group; (B) targeted competition group; (C) untargeted group. MR images of tumor area pre- and postinjection (a1, b1, c1 and a2, b2, c2, respectively) with corresponding contrast agent. (D) Corresponding MR signal-intensity percentages in tumor regions of interest.
Abbreviation: MR, magnetic resonance.
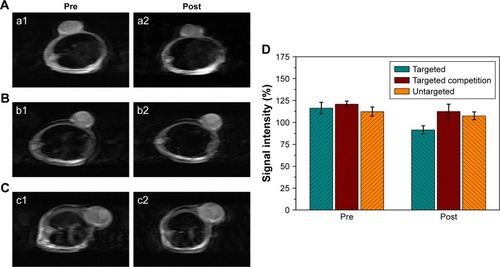
Figure 9 Immunofluorescence images of tumor-tissue slices (400×).
Notes: (A) H&E staining of tumor. (B) Fluorescein isothiocyanate–labeled tumor cells (green) of tumor sections. (C) DAPI-labeled tumor-cell nuclei (blue) of tumor sections.
Scheme 1 Structure of HS-Fe-PEG-HER2 NPs and process of targeted imaging on BALB/c nude mice bearing SKBR3 human breast cancer cells.
Abbreviations: HS, hollow silica; US, ultrasound; MR, magnetic resonance.
ImageJ software quantified relative variations in T2-weighted MR-signal intensity in the tumors (). In the targeted group, the intensity of tumor lesions after intravenous injection decreased to 22% compared with the preinjection MRI (116.37%±6.53% vs 91.49%±4.76%). By contrast, only a slight reduction was seen in the targeted competition group (120.79%±3.50% vs 112.60%±8.28%) and the untargeted group (112.31%±5.14% vs 107.56%±4.38%) after injection. All these results demonstrated that HS-Fe-PEG-HER2 NPs could be used as a novel targeted negative-contrast agent for in vivo T2-weighted MRI. Data from the in vivo imaging experiments proved that HS-Fe-PEG-HER2 NPs were capable of specific targeting and could be used to perform US and MR dual-mode imaging, enabling highly effective imaging in vivo.
Conclusion
We developed HS nanospheres with good biocompatibility by the hydrothermal method. The targeted NPs modified with anti-HER2 antibodies had broad versatility for targeted imaging, being applicable as a contrast agent for both US imaging and MRI. This material could improve the diagnostic sensitivity and specificity of HER2-positive breast cancer and have broad application prospects and development potential in biopharmaceutical applications and clinical diagnosis and treatment.
Acknowledgments
This work was partially supported by the National Natural Science Foundation of China (grants 81701710 and 81671688).
Supplementary materials
Figure S1 T1-weighted magnetic resonance images of HS-Fe-PEG-HER2 NPs.
Abbreviations: HS, hollow silica; PEG, polyethylene glycol; NPs, nanoparticles.
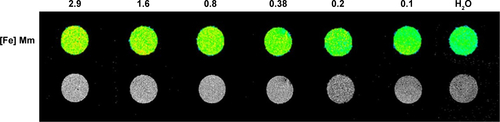
Figure S2 Major blood-cell analysis after treatment with HS-Fe-PEG-HER2 NPs at different times (0, 1 hour, 4 hours, 8 hours, 24 hours, 7 days, 14 days).
Notes: (A) red blood cells; (B) white blood cells; (C) platelets; (D) monocytes; (E) hemoglobin; (F) lymph cells.
Abbreviations: HS, hollow silica; PEG, polyethylene glycol; NPs, nanoparticles.
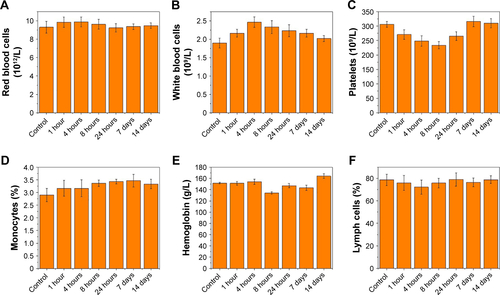
Figure S3 Confocal microscopy of SKBR3 and MDA-MB-231 incubation with corresponding groups.
Abbreviation: FITC, fluorescein isothiocyanate.
Disclosure
The authors report no conflicts of interest in this work.
References
- AndersonWFHow many etiological subtypes of breast cancer: two, three, four, or more?Breast Dis A Year Book Q2015264296297
- Von MinckwitzGProcterMDe AzambujaEAdjuvant pertuzumab and trastuzumab in early HER2-positive breast cancerN Engl J Med2017377212213128581356
- GianniLPienkowskiTImYHEfficacy and safety of neoadjuvant pertuzumab and trastuzumab in women with locally advanced, inflammatory, or early HER2-positive breast cancer (NeoSphere): a randomised multicentre, open-label, phase 2 trialLancet Oncol2012131253222153890
- SwainSMBaselgaJKimSBPertuzumab, trastuzumab, and docetaxel in HER2-positive metastatic breast cancerN Engl J Med2015372872473425693012
- WolffACHammondMEAllisonKHHarveyBEMcShaneLMDowsettMHER2 testing in breast cancer: American Society of Clinical Oncology/College of American Pathologists Clinical Practice Guideline Focused Update SummaryJ Oncol Pract201814743744129920138
- RakhaEAPinderSEBartlettJMUpdated UK recommendations for HER2 assessment in breast cancerJ Clin Pathol2015682939925488926
- LiedtkeCJackischCThillMAGO recommendations for the diagnosis and treatment of patients with early breast cancer: update 2018Breast Care201813319620830069181
- GradisharWJAndersonBOBalassanianRBreast cancer, version 4.2017, NCCN clinical practice guidelines in oncologyJ Natl Compr Canc Netw201816331032029523670
- WanCDuJFangHLiFWangLEvaluation of breast lesions by contrast enhanced ultrasound: qualitative and quantitative analysisEur J Radiol2012814e444e45021612882
- StanzaniDChalaLFBarrosNDCerriGGChammasMCCan Doppler or contrast-enhanced ultrasound analysis add diagnostically important information about the nature of breast lesions?Clinics2014692879224519198
- SzymanskiMSochaMWKowalkowskaMEDifferentiating between benign and malignant adnexal lesions with contrast-enhanced transvaginal ultrasonographyInt J Gynaecol Obstet2015131214715126254725
- KostopoulosSAVassiouKGLavdasENComputer-based automated estimation of breast vascularity and correlation with breast cancer in DCE-MRI imagesMagn Reson Imaging201735394527569368
- ChangRFChenHHChangYCQuantification of breast tumor heterogeneity for ER status, HER2 status, and TN molecular subtype evaluation on DCE-MRIMagn Reson Imaging201634680981926968141
- YangHCaiWXuLNanobubble–Affibody: novel ultrasound contrast agents for targeted molecular ultrasound imaging of tumorBiomaterials20153727928825453958
- LiJAnYLZangFCA dual mode targeting probe for distinguishing HER2-positive breast cancer cells using silica-coated fluorescent magnetic nanoparticlesJ Nanoparticle Res201315101980
- XuSYangFZhouXUniform PEGylated PLGA microcapsules with embedded Fe3O4 nanoparticles for US/MR dual-modality imagingACS Appl Mater Interfaces2015736204602046826327472
- WangYCaiDWuHFunctionalized Cu3 BiS3 nanoparticles for dual-modal imaging and targeted photothermal/photodynamic therapyNanoscale20181094452446229451575
- BrandWNoorlanderCWGiannakouCNanomedicinal products: a survey on specific toxicity and side effectsInt J Nanomedicine2017126107612928883724
- KhatriMBelloDPalAKEvaluation of cytotoxic, genotoxic and inflammatory responses of nanoparticles from photocopiers in three human cell linesPart Fibre Toxicol20131014223968360
- DhawanASharmaVToxicity assessment of nanomaterials: methods and challengesAnal Bioanal Chem2010398258960520652549
- YanYFuJWangTLuXControlled release of silyl ether camptothecin from thiol-ene click chemistry-functionalized mesoporous silica nanoparticlesActa Biomater201751347147828131940
- DoadrioALSánchez-MonteroJMDoadrioJCSalinasAJVallet- RegíMMesoporous silica nanoparticles as a new carrier methodology in the controlled release of the active components in a polypillEur J Pharm Sci2017971827818251
- MoJHeLMaBChenTTailoring particle size of mesoporous silica nanosystem to antagonize glioblastoma and overcome blood-brain barrierACS Appl Mater Interfaces20168116811682526911360
- Pohaku MitchellKKLibermanAKummelACTroglerWCIron(III)-doped, silica nanoshells: a biodegradable form of silicaJ Am Chem Soc201213434139971400322871140
- YuLChenYWuM“Manganese extraction” strategy enables tumor-sensitive biodegradability and theranostics of nanoparticlesJ Am Chem Soc2016138319881989427441571
- YecCCZengHCNanobubbles within a microbubble: synthesis and self-assembly of hollow manganese silicate and its metal-doped derivativesACS Nano2014866407641624878224
- YaoKXZengHCSimultaneous chemical modification and structural transformation of Stöber silica spheres for integration of NanocatalystsChem Mater2012241140148
- GretaJEgleDMariusSAccumulation and toxicity of superpara-magnetic iron oxide nanoparticles in cells and experimental animalsInt J Mol Sci20161781193
- ChanWTLiuCCChiang ChiauJSIn vivo toxicologic study of larger silica nanoparticles in miceInt J Nanomedicine2017123421343228496319
- AbbarajuPLJambhrunkarMYangYAsymmetric mesoporous silica nanoparticles as potent and safe immunoadjuvants provoke high immune responsesChem Commun2018541620202023
- CroissantJGFatieievYAlmalikAKhashabNMMesoporous silica and Organosilica nanoparticles: physical chemistry, biosafety, delivery strategies, and biomedical applicationsAdv Healthc Mater2018741700831
- MendesLPDelgadoJMFCostaADBiodegradable nanoparticles designed for drug delivery: the number of nanoparticles impacts on cytotoxicityToxicol In Vitro20152961268127425596133
- DingNSanoKKanazakiKIn vivo HER2-targeted magnetic resonance tumor imaging using iron oxide nanoparticles conjugated with anti-HER2 fragment antibodyMol Imaging Biol201618687087627351762
- LibermanAWuZBarbackCVHollow iron-silica nanoshells for enhanced high intensity focused ultrasoundJ Surg Res2014190239139824972734
- YangZLuoHCaoZDual-targeting hybrid nanoparticles for the delivery of SN38 to HER2 and CD44 overexpressed human gastric cancerNanoscale2016822115431155827203688
- ZhangNCaiXGaoWA multifunctional theranostic Nanoagent for dual-mode image-guided HIFU/Chemo-synergistic cancer therapyTheranostics20166340441726909114
- JiRLiXZhouCIdentifying macrophage enrichment in atherosclerotic plaques by targeting dual-modal us imaging/MRI based on biodegradable Fe-doped hollow silica nanospheres conjugated with anti-CD68 antibodyNanoscale20181043202462025530361722