
 ?Mathematical formulae have been encoded as MathML and are displayed in this HTML version using MathJax in order to improve their display. Uncheck the box to turn MathJax off. This feature requires Javascript. Click on a formula to zoom.
Abstract
Background
Lutein ester (LE) is an important carotenoid fatty acid ester. It is a form in which lutein is present in nature and is produced by free non-esterification and fatty acid esterification. LE is one of the safe sources of lutein. Increasing lutein intake can prevent and treat age-related macular degeneration. In addition, it can effectively inhibit gastric cancer, breast cancer, and esophageal cancer. However, the poor aqueous solubility of LE has impeded its clinical applications.
Objective
The objective of this study was to prepare lutein ester nanoparticles (LE-NPs) by liquid antisolvent precipitation techniques to improve the bioavailability of LE in vivo and improve eye delivery efficiency.
Materials and methods
The physical characterization of LE-NPs was performed, and their in vitro dissolution rate, in vitro antioxidant capacity, in vivo bioavailability, tissue distribution, and ocular pharmacokinetics were studied and evaluated.
Results
The LE freeze-dried powder obtained under the optimal conditions possessed a particle size of ~164.1±4.3 nm. The physical characterization analysis indicated the amorphous form of LE-NPs. In addition, the solubility and dissolution rate of LE-NPs in artificial gastric juice were 12.75 and 9.65 times that of the raw LE, respectively. The bioavailability of LE-NPs increased by 1.41 times compared with that of the raw LE. The antioxidant capacity of LE-NPs was also superior to the raw LE. The concentration of lutein in the main organs of rats treated with the LE-NPs was higher than that in rats treated with the raw LE. The bioavailability of LE-NPs in rat eyeballs was found to be 2.34 times that of the original drug.
Conclusion
LE-NPs have potential application as a new oral pharmaceutical formulation and could be a promising eye-targeted drug delivery system.
Introduction
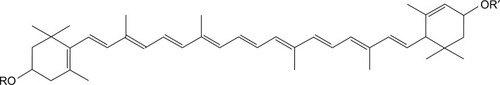
Lutein is a major carotenoid present in marigold,Citation1 pumpkin, cabbage, and other plants. The marigold flower contains high amounts of lutein (up to 30%–40%).Citation2 The human body is not capable of synthesizing lutein directly; thus, it can only be obtained from edible fruits, vegetables, or supplements. In nature, lutein is produced by free non-esterification and fatty acid esterification. A large amount of lutein is also present in yellow fruits and vegetables, such as mango, papaya, peach, and orange.Citation3 However, in these fruits and vegetables, lutein is present in esterified fatty acid form, such as myristic, lauric, and palmitic acids, which are called lutein esters (LEs; or lutein fatty acid ester).Citation4 LE (C72H116O4; molecular weight [MW] =1,045.71) is an important carotenoid fatty acid ester that contains small reddish brown granules. The main structure of LE is composed of two six-membered carbocyclic rings and two pairs of CO bonds containing a long chain of 18 carbon atoms connected together ().Citation5
Figure 1 Molecular structure of LE. RO and OR′ are fatty acids.
Abbreviation: LE, lutein ester.
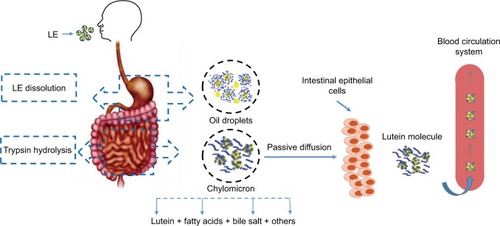
The hydrolysis of LE into lutein is a natural physiological process.Citation6 LE will be absorbed into the body and metabolized into the free state of lutein.Citation6,Citation7 A highly efficient system for hydrolyzing esterified compounds exists in the human gut. LE is mainly released from the food in the stomach, and then the oil droplets encapsulate the particles into the small intestine. Pancreatic lipase and isomerase break down the oil droplets to produce fatty acids and triglycerides. LE is hydrolyzed by trypsin, which is then hydrolyzed to lutein. Under the action of bile emulsification, lutein forms a mixed micelle with components such as fatty acids and bile salts. Passive diffusion in intestinal epithelial cells occurs through a non-flowing aqueous layer between the intestinal mucosa and the intestinal lumen as chylomicrons enter the lymph and blood ().Citation8 Bone et alCitation9 found that the bioavailability of lutein obtained by decomposition of LE is higher by ~61.6% than that of free lutein. LE is one of the safe sources of lutein.
Figure 2 Schematic representation of the metabolic pathway of LE in vivo.
Abbreviation: LE, lutein ester.
Eye health is one of the growing concerns worldwide. The WHO indicates that blindness is caused by cataracts, glaucoma, and age-related macular degeneration (AMD).Citation10 Low intake of yellow leafy vegetarian food is associated with risk of developing AMD.Citation11 The amount of lutein in the retina of patients with AMD is reduced, and increasing lutein intake to enhance the optical density of macular pigment has demonstrated prophylactic and therapeutic effects.Citation12 Therefore, daily intake of 6 mg of lutein from food can reduce the risk of developing AMD.Citation13 Lutein can also effectively inhibit gastric cancer,Citation14 breast cancer,Citation15 esophageal cancer,Citation16 and oral epithelial cancer.Citation17 However, the blood–eye barrier is the main physiological bar that suppresses the entry of drugs from blood vessels to the target tissues of the eye; this type of barrier includes blood–aqueous and blood–retinal obstacles. Drugs with large MW or poor water solubility have poor intraocular permeability when given by local or systemic administration. Although intravitreal injection can achieve effective therapeutic concentrations, this method is traumatic, of high risk, and susceptible to toxic effects on intraocular tissues. Targeted nanosized nutraceuticals are very important for the treatment of eye-related diseases.Citation18 Such nanoparticles (NPs) pass through the blood–eye barrier due to their smaller particle size to achieve an excellent therapeutic effect. Therefore, optimizing the water solubility of oral drugs is of great significance for promoting their transmembrane delivery and increasing the permeability of the blood–eye barrier. However, LE is difficult to be absorbed and metabolized by the body due to its slight solubility, which limits its bioavailability and efficacy.Citation4,Citation19
The preparation of a poorly water-soluble drug in the form of a solid dispersion can improve its bioavailability in vivo,Citation20 which can be achieved by changing the drug into crystal form, changing the crystal structure of the drug,Citation21 and using surfactants.Citation22 Many techniques have been attempted to reduce the particle size of lutein to increase its solubility; such techniques include cyclodextrin inclusion technology,Citation23 spray drying technology,Citation24 and supercritical fluid technique.Citation25 Spray drying technology can be easily controlled during production but shows disadvantages of aggregation of nanocrystals due to high surface free energy.Citation26 Supercritical fluid technology is an effective method used to reduce the particle size, but it has high equipment costs and produces low yield.Citation27
NPs increase their surface area due to their reduced particle size, which can increase their dispersion in water and improve bioavailability.Citation28–Citation30 Micronization technology is an important method used in the pharmaceutical industry to reduce the particle size of monomeric compounds.Citation31 Liquid antisolvent precipitation (LAP) is a promising technique and more effective for preparing ultrafine drug particles compared with other micronization technologies.Citation32–Citation34 The driving force of an LAP process is the supersaturation of a solution produced by mixing the drug solution and the antisolvent. Supersaturation and its spatial concentration are crucial for obtaining NPs with narrow particle size distributions.Citation35,Citation36 Compared with other micronization technologies, LAP has advantages of simplicity, easy operation, and lower cost, and can thus be used for industrial production.Citation35 This technology has been successfully applied in pharmaceutical industry to prepare resveratrol,Citation37 curcumin,Citation38 catechins,Citation39 rifampicin,Citation40 and amphotericin B.Citation32 However, application of LAP to prepare LE-NPs has not been reported previously. In the present study, LAP method was applied with tetrahydrofuran as the solvent and water as the antisolvent. The process engendered precipitations. As such, LE-NPs were prepared through lyophilization.
Materials and methods
Materials
LE (MW =1,045.71, purity ≥98%) was acquired from Shanghai Tongtian Biotechnology Co., Ltd. (Shanghai, China). Lutein (MW =568.87, purity =99%) was acquired from Hubei Yuancheng Science and Technology Co., Ltd. (Hubei, China). Poloxamer 188, ethanol, acetonitrile, methanol, 2,2-diphenyl-1-picrylhydrazyl (DPPH), potassium ferricyanide, FeCl3, NaH2PO4·2H2O, ethyl acetate, trichloromethane, n-hexane, acetone, petroleum ether, tetrahydrofuran, and dichloromethane were purchased from Sigma. Deionized water was obtained using Hitech-K flow water purification system (Hitech Instruments Co., Ltd., Shanghai, China).
Kunming strain mice (18–22 g, male) and Sprague Dawley rats (weight, 180–220 g) were obtained from Beijing HFK Bioscience Co., Ltd. (Beijing, China) and were used as subjects in the experiment. All animal operations were implemented in accordance with the Guidelines for the Care and Use of Experimental Animals of Harbin Medical University. Animal experiments were approved by the Ethics Committee of the Harbin Medical University.
Preparation of LE-NPs
Solvent and antisolvent selection
Excess LE was added to each solvent (chloroform, tetrahydrofuran, n-hexane, ethanol, acetone, ethyl acetate, dichloromethane, and deionized water). The mixture was sonicated for 10 minutes and then continuously stirred for 6 hours using a magnetic stirrer. The supersaturated solution was centrifuged at 4,000 rpm for 10 minutes to remove the precipitate. Drug concentration was measured by HPLC using 20 µL of the supernatant through the method described in the “HPLC condition” section.
Preparation of LE-NPs by LAP method
Briefly, LE was dissolved in tetrahydrofuran and sonicated for 10 minutes at a frequency of 40 kHz and a power of 250 W.Citation41 The solution was centrifuged at 4,000 rpm for 10 minutes to remove impurities. The above suspension was uniformly added to an aqueous solution containing Poloxamer 188 under constant agitation. The resulting suspension was passed through a rotary evaporator system (Rotary Evaporator R201BL; SENCO Technology, Shanghai, China) to remove the solvent tetrahydrofuran. The suspension was prefrozen in a refrigerator at −40°C for 2 hours and freeze-dried (−80°C) for 64 hours in a freeze-drying machine (Gamma 2-20 apparatus; Christ, Osterode, Germany) to obtain the LE-NPs. Each test was repeated at least three times.
Optimization of LE-NPs conditions
The single-factor method was used to study the operating conditions for optimizing the amorphous LE-NPs by LAP technique. In this method, only one parameter was changed, while the other parameters remained constant. Major elements affecting the particle size of LE-NPs were screened by preliminary experiments including drug concentration (20–60 mg/mL), additional amount of surfactant (1–5 mg/mL), antisolvent-to-solvent volume ratio (3:1–15:1), precipitation temperature (4°C–35°C), stirring time (125 minutes), and stirring speed (500–1,400 rpm). The minimum particle size was used as a criterion for selecting the best conditions for each factor. The obtained NPs were prefrozen at −40°C for 4 hours and subsequently lyophilized at −80°C for 64 hours to acquire the LE-NPs. The formula for supersaturation in solution is as follows:
HPLC condition
A Waters chromatographic instrument was used for HPLC.Citation42 A C18 reverse-phase column (250×4.6 mm, 5 µm; Dikma Technologies, Beijing, China) was used. The mobile phase was made up of acetonitrile and methanol in a volume ratio of 95:5 (v/v). The detection wavelength was set at 450 nm. The injection volume was 10 µL, and the flow rate was 1.0 mL/min. The column temperature was maintained at 25°C.
Characterization of LE-NPs
Detection of average particle size of LE-NPs
The average particle size of LE-NPs was determined by a dynamic light scattering device (ZetaPALS; Brookhaven Instruments) using a He–Ne laser (632.8 nm, 35 mW) as a light source. The sample was diluted with deionized water and tested. Three aliquots were taken for each experimental sample, and the data were acquired from the average.
Scanning electron microscopy (SEM)
SEM was used to detect the morphology of the original LE and LE-NPs (Quanta 200; FEI, Hillsboro, OR, USA). The sample was uniformly spread on a gold-coated conductive adhesive (JFC 1200 Fine Coating Machine; JEOL, Tokyo, Japan).
X-ray diffraction (XRD)
The crystal form of raw LE, LE-NPs, and Poloxamer 188 was detected and analyzed by an X-ray diffractometer (Philips, Amsterdam, the Netherlands). The sample was irradiated with a Cu target tube and was detected at 40 kV and 30 mA at 3°<2θ<60°.
Differential scanning calorimetry (DSC)
Thermal analysis of LE, LE-NPs, and Poloxamer 188 was conducted by DSC (Shimadzu, Kyoto, Japan). A 6 mg sample was placed in the sample cell and tested in an inert gas atmosphere (N2) at a heating rate of 10°C/min from 30°C to 300°C.
Thermogravimetry (TG)
The thermal stability of raw LE, LE-NPs, and Poloxamer 188 was detected using a TG analyzer (Diamond TG/DTA; PerkinElmer, Waltham, MA, USA). A 6 mg sample was placed in an inert gas atmosphere (N2) and heated from 40°C to 600°C at a constant heating rate of 10°C/min.
Gas chromatography (GC)
The tetrahydrofuran leftovers in the LE-NPs were tested with an Agilent 7890A gas chromatograph (Agilent Technologies, Santa Clara, CA, USA) with a HP-5 5% phenyl-methylsiloxane capillary column (30.0 m ×320×0.25 µm, nominal) equipped with a G1540N-210 FID detector. The LE-NPs ethanol solution at a concentration of 10 mg/mL was sonicated for 30 minutes and centrifuged at 10,000 rpm for 5 minutes. The gas chromatograph was set to an initial temperature of 40°C for 2 minutes, and the temperature was increased to 200°C for 2 minutes at a heating rate of 15°C/min. The tail flow was 25.0 mL/min. The hydrogen gas and air flow rate reached 40.0 and 400.0 mL/min, respectively. The injection volume was 2 mL, and the split ratio was 20:1.
Saturation solubility tests
The excessive amounts of raw LE and LE-NPs were obtained and separately added to 2 mL of artificial gastric juice (pH 1.2).Citation43 Thereafter, all the samples were placed in a water bath at 37°C with a stirring rate of 100 rpm and stirred continuously for 48 hours. The suspension was centrifuged at 10,000 rpm for 5 minutes. Then, 100 µL of the supernatant was thoroughly mixed with 900 µL of methanol under ultrasonic treatment for 30 minutes. The above suspension was centrifuged at 10,000 rpm for 10 minutes. Next, 10 µL of the supernatant was extracted and injected into the HPLC system. The analytical conditions are described in the “HPLC condition” section.
Dissolution rate tests
HPLC was performed to detect the dissolution rate of raw LE and LE-NPs. The experimental conditions of the process including the paddle peed and the dissolution temperature, set at 100 rpm, and 37.0°C±0.5°C, respectively. For the dissolution test experiment, artificial gastric juice (pH 1.2) was used as a solvent. First, 2.487 mg of raw LE and 6.393 mg of LE-NPs equating to 2.487 mg of LE (the amount of LE in LE-NPs was 38.9% as detected by HPLC) were added to 200 mL of artificial gastric juice. Then, 3 mL of dissolution medium was taken at 5, 15, and 30 minutes, and 1, 2, 3, 4, and 6 hours each time, and 3 mL of dissolution medium was added to ensure that the total volume of the dissolution medium remained unchanged. Next, 3 mL of the dissolution medium was centrifuged at a speed of 10,000 rpm for 10 minutes. Following centrifugation, 100 µL of the supernatant and 900 µL of methanol were transferred to a 2 mL centrifuge tube. The mixture was placed in an ultrasound machine for 20 minutes and then centrifuged for 15 minutes at 10,000 rpm. Later, 10 µL of the supernatant was extracted and injected into the HPLC system. The analytical conditions are described in the “HPLC condition” section.
Antioxidant capacity test
DPPH radical-scavenging activity test
Raw LE (5 mg), LE-NPs (containing 5 mg LE), and vitamin C (5 mg) were separately added to 5 mL of deionized water. The mixture was placed in an ultrasound machine for 10 minutes. The suspension was centrifuged at 10,000 rpm for 10 minutes. The supernatant obtained was configured to different concentrations (1–0.0156 mg/mL). Then, 1.5 mL of each sample was added to 1.5 mL of 95% ethanol DPPH solution (0.1 mmol/L). The suspension was thoroughly mixed under normal temperature and dark conditions. After 30 minutes of treatment, the mixture was tested for absorbance at 517 nm. The assay was repeated three times for each experiment. The DPPH-scavenging capacity (SC) of the sample was calculated as:
Measurement of the ABTS radical-scavenging activity
The sample was prepared in the same manner as above. A 0.2 mL sample was added to 4 mL of 2,2′-azino-bis(3-ethylbenzothiazoline-6-sulphonic acid) (ABTS) solution (7 mmol/L) and fully reacted at room temperature under dark conditions. After 30 minutes of treatment, the absorbance of the mixture at 734 nm was tested. The assay was repeated three times for each experiment. The ABTS-scavenging capacity (SC) of the sample was calculated by the following formula:
Measurement of reducing power
The sample was prepared in the same manner as described in the “DPPH radical-scavenging activity test” section. A 2 mL of the sample was mixed with 2 mL of 1% potassium ferricyanide solution and 2 mL of 0.2 M phosphate buffer (pH 6.6). The mixture was placed in a water bath at 50°C for 20 minutes. Then, 2 mL of 10% trichloroacetic acid was added to the mixture to terminate the reaction. The mixture was centrifuged at 3,500 rpm for 15 minutes. Next, 2 mL supernatant was added to 2 mL of deionized water and 0.4 mL FeCl3 (0.1%) aqueous solution. The mixture was allowed to react well for 10 minutes. The absorbance of the suspension was measured at 700 nm, and the experiment was repeated three times.
Bioavailability study
Condition of HPLC
A Waters chromatographic instrument was used for HPLC.Citation6 A C18 reverse-phase column (250×4.6 mm, 5 µm; Dikma Technologies) was used. The mobile phase A was made up of acetonitrile and water in a volume ratio of 9:1 (v/v), while the mobile phase B was ethyl acetate. The linear phase elution method was used. The mobile phase B was increased from 0% to 100% in 20 minutes. The injection volume was 10 µL, and the flow rate was 1.0 mL/min. The detection wavelength was set at 450 nm. The column temperature was maintained at 25°C.
Animals and treatment
Six female Sprague Dawley rats (weight between 180 and 240 g) were housed in a laboratory for 1 week and randomly assigned to two groups, with each group containing three rats. The rats were fasted for 12 hours before the experimental treatment and were free to drink water. Rats in both groups were given raw LE and LE-NPs (calculated according to LE) by intragastric administration at a dose of 50 mg/kg. After oral administration, blood was extracted from the eyeball of the rats in the raw LE and LE-NPs groups at 5, 15, 30, and 45 minutes, and 1, 2, 3, 4, 6, 8, 12, and 24 hours. The blood sample was added to a centrifuge tube with 1% heparin sodium and centrifuged at 3,000 rpm for 15 minutes. The supernatant was placed in a refrigerator at 4°C and treated on the same day.
Preparation of the plasma sample
Plasma samples were added to 0.4 mL of methanol and vortexed for 30 seconds to allow for thorough mixing. Subsequently, 0.6 mL of n-hexane was added and vortexed for 10 minutes, and the suspension was centrifuged at 4,500 rpm for 15 minutes. Finally, the supernatant was dried at 40°C under a gentle stream of nitrogen. The dried residue was redissolved in 100 µL of methanol. After ultrasonication for 2 minutes, the suspension was centrifuged at 11,000 rpm for 15 minutes, and 10 µL of the supernatant was extracted and injected into the HPLC system. The results showed that LE was hydrolyzed into lutein in the body. Thus, the content of lutein in the rat plasma was mainly detected.Citation8 The conditions of the test are as described in the “Condition of HPLC” section.
Organ distribution study
Animals and treatment
The rats were randomly assigned to 18 groups of three each. A total of 18 groups were given raw LE and LE-NPs (calculated according to LE) by intragastric administration at a dose of 50 mg/kg. Two groups of rats (LE-NPs and raw LE groups) were sacrificed at each time point, that is, 0.25, 0.5, 1, 2, 6, and 24 hours after the time of intragastric administration. A quick dissection of the heart, liver, spleen, lung, kidney, brain, and eye was conducted after the death of the rats, and the organs were then washed with saline more than three times. The excess water was dried, and the organs were placed in a refrigerator for freezing at −40°C.
Organ treatment
Accurately weighed samples of the heart, liver, spleen, lung, kidney, brain, and eye were placed in a glass homogenizer, and each sample was supplemented with two times the weight of physiological saline and then subjected to high-speed homogenization. Equal volumes of methanol were added, vortex-shocked for 5 minutes, and then the same volume of n-hexane was added and vortex-shocked for 10 minutes to fully mix the solution. After centrifugation at 11,000 rpm for 10 minutes, the supernatant was dried under a gentle stream of nitrogen at 40°C. The dried residue was redissolved in 100 µL of methanol. After ultrasonication for 15 minutes, the suspension was centrifuged at 11,000 rpm for 15 minutes, and 10 µL of the supernatant was extracted and injected into the HPLC system. The conditions of the test are as described in the “Condition of HPLC” section.
Statistical analysis
All samples were tested in triplicate. Results are shown as mean ± SD. One-way ANOVA and paired t-test was done using GraphPad Prism 5.0 software. ANOVA showed that P<0.05 can be considered statistically significant (*P<0.05, **P<0.01, and ***P<0.001).
Results and discussion
Optimization study
Effects of the surfactant
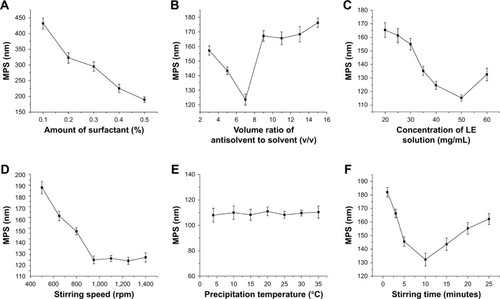
Under the same conditions as other experimental conditions (volume ratio of antisolvent to solvent: 1:9, drug concentration: 30 mg/mL, precipitation temperature: 25°C, stirring time: 10 minutes, stirring speed: 950 rpm), the effects of concentration of 0.1%, 0.2%, 0.3%, 0.4%, and 0.5% of the surfactant Poloxamer 188 on the average particle size of the resulting LE-NPs suspension were tested. As shown in , when the concentration of the surfactant Poloxamer 188 was increased from 0.1% to 0.5%, the average particle size of the corresponding LE was decreased from 432.2 to 189.3 nm. The reason is that Poloxamer 188 is a nonionic surfactant that promotes better dispersion of LE in aqueous solution.Citation44 Therefore, 0.5% was chosen as the optimal concentration of Poloxamer 188.
Figure 3 The effect of each factor on the mean particle size of LE-NPs.
Notes: Effect of the (A) amount of Poloxamer 188 surfactant, (B) volume ratio of antisolvent to solvent, (C) concentration of LE solution, (D) stirring speed, (E) precipitation temperature, and (F) stirring time. Values are presented as mean ± SD.
Abbreviations: LE, lutein ester; LE-NPs, lutein ester nanoparticles; MPS, mean particle size.
Volume ratio of antisolvent to solvent
Through solvent and antisolvent screening experiments, it was found that LE had the highest solubility in tetrahydrofuran and the lowest solubility in water, where tetrahydrofuran and water are mutually soluble. Tetrahydrofuran was used as the solvent, and water was used as the antisolvent in the experiment. The effects of volume ratio of antisolvent to solvent (1:3, 1:5, 1:7, 1:9, 1:11, 1:13, and 1:15) on the average particle size of LE were investigated under the same conditions as other experiments. As the volume ratio of anti-solvent to solvent increased (from 3 to 7), the mean particle size decreased from 157.2 to 123.6 nm (). When the ratio of antisolvent and solvent was gradually increased, the production rate of the crystal nuclei was higher and the growth rate of the crystal nuclei was lower, wherein a large number of particles with small diameters were generated. When the volume ratio was 7, the mean particle size was the smallest at around 123.6 nm. However, as the volume ratio increased to 15, the mean particle size began to increase to 176.3 nm. With the increase in the ratio of antisolvent and solvent, LE reached the saturation point in a short time to rapidly crystallize the precipitate in the solution. However, when the ratio of antisolvent and solvent increased to a certain value, the increase in the concentration of the solution in the unit system reduced the chance of intermolecular diffusion of the LE molecules, and the crystal particles had a tendency to agglomerate resulting in an increase in particle size.Citation45 Therefore, 7 was chosen as the optimal antisolvent-to-solvent volume ratio.
Drug concentration
The drug concentration was examined under the conditions of 0.5% surfactant, antisolvent and solvent ratio of 1:7, stirring rate of 950 rpm, temperature of 25°C, and stirring time of 10 minutes. The effect of drug concentration of 20, 25, 30, 35, 40, 50, and 60 mg/mL on the mean particle size of the resulting LE-NPs suspension was determined. The results () showed that as the drug concentration increased (from 20 to 50 mg/mL), the mean particle size decreased. From EquationEquation 1(1) , it was understood that increasing the drug concentration can increase the supersaturation of the system resulting in a crystal nucleation rate that is greater than the growth rate, which is advantageous for the generation of fine particles. When the drug concentration was higher than 50 mg/mL, the average particle size gradually increased. This was because when the drug concentration was too high, the amount of drug particles increased significantly at the interface between the solid-phase and the liquid-phase diffusion, which led to particle adhesion, agglomeration, and larger particle formation.Citation46 Therefore, 50 mg/mL was chosen as the optimal drug concentration.
Stirring speed
The stirring speed was examined under the conditions of 0.5% surfactant, stirring time of 10 minutes, antisolvent and solvent ratio of 1:7, drug concentration of 50 mg/mL, and temperature of 25°C. The effect of stirring speed of 500, 650, 800, 950, 1,100, 1,250, and 1,400 rpm on the mean particle size of the resulting LE-NPs suspension was determined. As shown in , when the stirring speed was raised from 500 to 950 rpm, the mean particle size gradually decreased from 187.3 to 120.2 nm because the degree of dispersion of the LE-NPs under low-speed agitation was uneven, and the phenomenon of agglomeration occurred resulting in an increase in the average particle size. The higher agitation rate did not cause agglomeration of the particles, thereby reducing the average particle size of the NPs. As the stirring speed was raised from 950 to 1,400 rpm, the average particle size was in a stable range and no fluctuation occurred in the range of particle size. Therefore, 950 rpm was chosen as the optimal stirring speed.
Precipitation temperature and stirring time
The precipitation temperature was examined under the conditions of 0.5% surfactant, stirring time of 10 minutes, antisolvent and solvent ratio of 1:7, drug concentration of 50 mg/mL, and stirring speed of 950 rpm. The effect of temperature of 4°C, 10°C, 15°C, 20°C, 25°C, 30°C, and 35°C on the average particle size of the resulting LE-NPs suspension was determined. As shown in , the change in temperature had no significant effect on the size of the particles. Therefore, it was convenient to select a room temperature of 25°C as the optimum temperature for the experimental operation.
The stirring time was examined under the conditions of 0.5% surfactant, temperature of 25°C, antisolvent and solvent ratio of 1:7, drug concentration of 50 mg/mL, and stirring speed of 950 rpm. The effect of stirring time of 1, 3, 5, 10, 15, 20, and 25 minutes on the mean particle size of the resulting LE-NPs suspension was determined. The relationship between the stirring time and the particle diameter is shown in . As the stirring time was raised from 1 to 10 minutes, the mean particle size gradually decreased from 181.1 to 134.3 nm because the degree of supersaturation in the system was increased and the recrystallization of the LE was complete with the extension of the stirring time resulting in the decrease of average particle size. With the increase of stirring time from 10 to 25 minutes, the average particle size continuously increased because smaller crystals in the solute were dissolved and redeposited into large crystals during the stirring process due to the Ostwald ripening effect. Therefore, 10 minutes was selected as the optimal stirring time for obtaining the smallest particle size.
Characterization of LE-NPs
SEM analysis
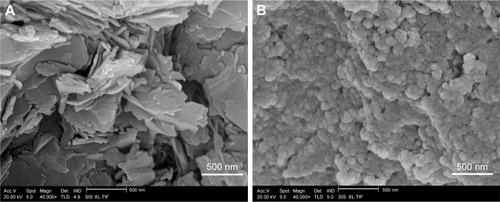
The morphology of the samples is shown in . The morphological characteristics of LE and LE-NPs were detected by SEM. The raw LE exhibited an irregular layered crystal morphology with a particle size of 3–45 µm (). The LE-NPs obtained and lyophilized under the optimum conditions exhibited a regular uniform spherical morphology with a particle size of ~160 nm (). Thus, compared with the raw LE, the particle size of the LE-NPs was significantly smaller and the dispersion was more uniform.
Figure 4 Morphology of samples observed by SEM.
Notes: (A) SEM image of raw LE. (B) SEM image of LE-NPs.
Abbreviations: LE, lutein ester; LE-NPs, lutein ester nanoparticles; SEM, scanning electron microscopy.
Particle size distribution
The LE-NPs obtained under the optimum conditions were tested using a laser particle size analyzer, and the resulting normal distribution curve is shown in . is the normal distribution curve of the LE-NPs suspension with an average particle size of 109.1±3.4 nm, while is the normal distribution curve of the LE-NPs freeze-dried powder after the fresh distribution of the NPs with a mean particle size of 164.1±4.3 nm. The particle size of the lyophilized powder of the LE-NPs measured by laser particle size analyzer was consistent with that determined by SEM. The particle size of the LE-NPs freeze-dried powder was slightly larger than that of the LE-NPs because the particles were agglomerated during the freeze-drying process resulting in an increase in particle size.
Figure 5 Physical properties of the samples.
Notes: (A) Normal distribution curves: (a) suspension of LE-NPs and (b) redissolved LE-NPs lyophilized powder solution. (B) XRD results of each sample: (a) raw LE; (b) LE-NPs; and (c) Poloxamer 188. (C) DSC results of each sample: (a) raw LE; (b) LE-NPs; and (c) Poloxamer 188. (D) TG results of each sample: (a) raw LE; (b) LE-NPs; and (c) Poloxamer 188.
Abbreviations: DSC, differential scanning calorimetry; LE, lutein ester; LE-NPs, lutein ester nanoparticles; TG, thermogravimetry; XRD, X-ray diffraction.

XRD analysis
The XRD analysis of samples containing the raw LE, Poloxamer 188, and LE-NPs was carried out to evaluate the characteristics of the crystal structure (). Many diffraction peaks were observed in the XRD curve of the raw LE because of its crystal morphology especially at the two peaks of 2θ=17.8° and 2θ=22.4° (). Two broad peaks (at 2θ=20.3° and 24.5°) were found in the curve of Poloxamer 188 () with a crystalline structure. The curve of the LE-NPs shown in presented two broad diffraction peaks (at 2θ=20.3° and 24.5°) indicating that Poloxamer 188 existed in the NPs and that the LE-NPs were amorphous.
DSC analysis
The DSC test results of the samples are shown in . The crystal structure of the raw LE showed two melting peaks at about 55.5°C and 130.0°C in the thermal analysis test results (). The curve between 55.5°C and 130.0°C increased which could have been caused by the melted LE that continued to absorb heat until gasification. As shown in , the endothermic peak of Poloxamer 188 appeared at 56.34°C. The peak at 56.34°C shown in was attributed to Poloxamer 188, and the melting point peak of LE disappeared. This result demonstrates that LE in LE-NPs has a lower crystallinity than the raw LE. This result was consistent with the XRD results, and with the general notion that pharmaceutical formulation with amorphous or low crystallinity has good dissolution and bioavailability.
TG analysis
TG was used to detect the relationship between temperature and mass of a sample. shows the mass–temperature curve of the sample. Curve a indicates the weight loss of the raw LE starting from 105°C and a weight loss rate of 89.62%. Starting from 214.25°C, the LE-NPs lost nearly 98.62% of their weight, as shown in curve b in . Poloxamer 188 began to lose weight from 258.75°C and lost around 99.3% of its weight, and the weight loss was comparable with that of the other samples (curve c). The reason for this phenomenon may be that LE-NPs have a smaller particle size than the raw LE, and a higher specific surface area, and are therefore more likely to evaporate and decompose rapidly.
Residual solvent analysis
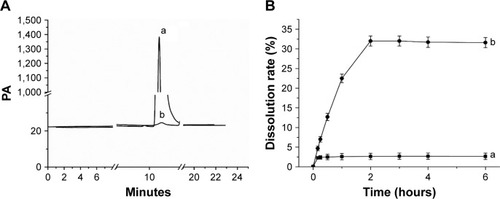
shows the GC analysis results of tetrahydrofuran residues. As shown in the chromatogram, the standard solution (curve a) eluted tetrahydrofuran at 10.7 minutes. Based on the regression equation (y=372.1x+24.038, R2=0.9997), the residual tetrahydrofuran content in the LE-NPs was 344.3 ppm. The International Conference on Harmonization of Technical Requirements for Registration of Pharmaceuticals for Human Use (ICH) limit for the tetrahydrofuran and class II solvents is 720 ppm. Therefore, LE-NPs with low amount of residual solvent can be used for pharmaceutical applications.
Figure 6 Solvent residue test and dissolution profiles.
Notes: (A) Results of the solvent residue test: (a) tetrahydrofuran standard solution gas chromatography test results and (b) LE-NPs in the tetrahydrofuran residual test results. (B) Dissolution profiles of LE: (a) raw LE and (b) LE-NPs. Values are presented as mean ± SD.
Abbreviations: LE, lutein ester; LE-NPs, lutein ester nanoparticles; PA, unit of current.
Solubility and dissolution rates
The solubility of raw LE and LE-NPs freeze-dried powder in artificial gastric juice at 37°C was 9.75±0.34 and 124.35±4.57 µg/mL (n=6), respectively, as revealed by standard curve regression equation (y=380.49x+160.07, R2=0.9997). The saturated solubility of LE-NPs was 12.75 times higher than that of LE. Da et al,Citation47 in 2015, found that the reconstituted suspension of lutein-loaded chitosan NPs showed a lutein solubility of ~58 µg/mL, and its solubility was significantly different from that of LE-NPs (P<0.05). The increased solubility was also due to the reduction of particle size based on the Oswald–Freundlich equation, which plays a good role in the dispersion of particles in the antisolvent precipitation process.Citation48 Therefore, drug particles having low crystallinity and small diameter have a higher dissolution rate and bioavailability than crystals.
shows the dissolution profiles of the raw LE and LE-NPs in the artificial gastric juice. The dissolution rates of LE and LE-NPs were 3.24% and 31.28%, respectively, and the dissolution rate of LE-NPs was 9.65 times higher than that of the raw LE. It indicated that the LE-NPs prepared by the LAP process were amorphous and therefore had a smaller particle size, which increased the dissolution rate. The Noyes–Whitney equation indicates that the dissolution rate of a drug is proportional to its surface area in the solvent. Thus, reduction in the particle size of the micronized product correspondingly increases the specific surface area of the drug, thereby increasing the contact area of the solid drug and the dissolution medium, and improving the dissolution rate of the drug.
Antioxidant capacity analysis
Scavenging effect on the DPPH radicals
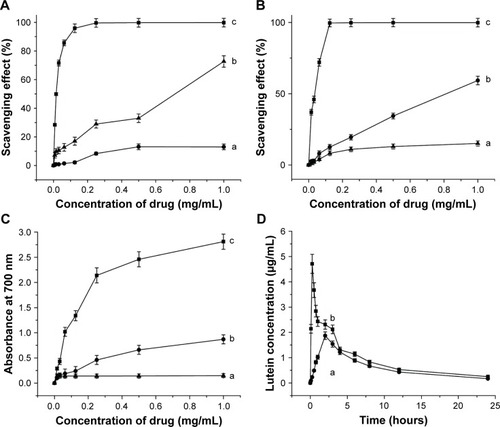
The DPPH radical-scavenging test is a method for evaluating the antioxidant capacity of natural antioxidants. The dose– response curves for DPPH radical scavenging capacity of vitamin C, raw LE, and LE-NPs are shown in . The radical-scavenging capacity of each sample increased with increasing concentration. When the concentration reached 1 mg/mL, the scavenging rate of LE-NPs was 72.73% (curve b), the removal rate of raw LE was 23.27% (curve a), and the clearance rate of vitamin C was 99.78% (curve c). The scavenging rate of DPPH free radicals of LE-NPs was 3.31 times that of the raw LE.
Figure 7 Antioxidant capacity and bioavailability tests.
Notes: (A) Scavenging effects on DPPH radical of different concentrations of the samples: (a) raw LE; (b) LE-NPs; and (c) vitamin C. (B) Scavenging effects on ABTS radical of different concentrations of the samples: (a) raw LE; (b) LE-NPs; and (c) vitamin C. (C) Reducing power of different concentrations of the samples: (a) raw LE; (b) LE-NPs; and (c) vitamin C. (D) Bioavailability test: (a) raw LE; and (b) LE-NPs. Values are presented as mean ± SD.
Abbreviations: ABTS, 2,2′-azino-bis(3-ethylbenzothiazoline-6-sulphonic acid); DPPH, 2,2-diphenyl-1-picrylhydrazyl; LE, lutein ester; LE-NPs, lutein ester nanoparticles.
Scavenging effect on the ABTS radicals
The ability to scavenge ABTS free radicals is also an important parameter for investigating antioxidant properties. The ABTS radical-scavenging test was applied, and the power test was reduced to compare the antioxidant capacity of raw LE and freeze-dried LE-NPs. As shown in , the ability to scavenge ABTS free radicals was enhanced with the rise in the concentration of each sample. When the concentration reached the maximum (1 mg/mL), raw LE, freeze-dried LE-NPs, and vitamin C showed an ABTS-scavenging rate of 15.11%, 59.33%, and 99.89%, respectively. The radical-scavenging effect of the freeze-dried LE-NPs (curve b) was higher than that of the raw LE (curve a). The ability of LE-NPs to scavenge ABTS free radicals was 3.93 times that of the raw LE indicating that the antioxidant capacity of LE-NPs was better than that of the raw LE.
Reducing power analysis
Antioxidants (reducing agents) donate electrons to eliminate free radicals by their own reduction. In this study, the reducing agent caused the reduction of potassium ferricyanide to iron, which reacted with FeCl3 to form Prussian blue, showing the largest light absorption peak at 700 nm. Therefore, the reducing ability of the sample can be detected by the absorbance at 700 nm. The dose–response curve for the reducing ability of the raw LE, LE-NPs, and vitamin C is shown in . The reducing power of the sample increased as the concentration increased. When the concentration reached the maximum of 1 mg/mL, the absorbance of the LE-NPs, raw LE, and vitamin C in the control group was 0.87, 0.15, and 2.81, respectively. The absorbance of the LE-NPs was 5.4 times that of the raw LE. The results thus showed that the in vitro antioxidant capacity of LE-NPs was higher than that of the raw LE, which was consistent with the results of the ABTS and DPPH radical scavenging.
Bioavailability analysis
The concentration of lutein was detected in the plasma because LE will be absorbed and metabolized into the free state of lutein in the living body. The mean drug concentration–time curves for oral administration of LE-NPs and raw LE are shown in . The absorption of the LE-NPs was significantly faster than that of the raw LE in vivo, and the lutein concentration in the plasma of the LE-NPs group was also higher than that of the raw LE group. Regarding the rate of absorption, the results revealed that the Tmax of LE-NPs (0.25 hour) was the shortest, and there was a significant difference (P<0.05) from the Tmax of raw LE (2 hours). Kamil et al, in 2016,Citation49 obtained a lutein-containing polymer NP by emulsion evaporation method, and showed that its Tmax (2.17 hours) was significantly different from that of LE-NPs (P<0.05). Therefore, it can be found by comparison that the LE-NPs obtained by the LAP technique can be absorbed faster in vivo.
The acquired data were analyzed by the pharmacokinetic software DAS2.0. The pharmacokinetic parameters of the LE-NPs and the raw LE were compared (). Concerning the extent of absorption, the results revealed the superiority of the LE-NPs to the raw LE as revealed by their Cmax and AUC values. The Cmax values were 4.71±0.213 and 1.87±0.164 mg/L for LE-NPs and raw LE, respectively (P<0.001). The lutein-containing polymer NPs obtained by Kamil et alCitation49 had a Cmax of 0.0902 µg/mL after oral administration in rats. There was a significant difference (P<0.001) compared with LE-NPs. On the other hand, the results showed that the AUC(0–24) value of the lutein in rats was 20.289±1.985 and 14.438±1.268 mg/L·h in the LE-NPs and raw LE groups, respectively, and the bioavailability of lutein in the LE-NPs group was 1.41 times that of the raw LE group. The LE-NPs may still show higher bioavailability than that of the lutein-containing polymer NPs at the same dose. Thus, the findings of the pharmacokinetic study indicate that LE-NPs prepared by LAP technique can improve bioavailability in vivo.
Table 1 Pharmacokinetic parameters of the compartment model for the LE-NPs and raw LE (n=3)
Organ distribution analysis
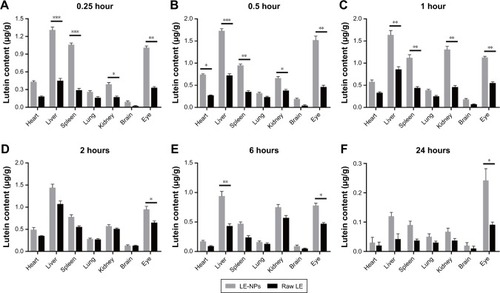
The average concentration–time histogram of each tissue in rats after intragastric administration of LE-NPs and raw LE is shown in . In the rats treated with the LE-NPs through the intragastric administration, Cmax appeared in the heart, liver, brain, and eye 0.5 hour after the treatment, and Tmax in the spleen, lungs, and kidneys was prolonged to 1 hour (). In the rats treated with the raw LE through the intragastric administration, Cmax appeared in the heart, liver, spleen, lung, brain, and eyes 2 hours after the treatment, and Tmax in the kidney was extended to 6 hours. The Cmax in each organ of the rats treated with LE-NPs was higher than the Cmax in each organ of the rats treated with the raw LE. The Cmax values in the heart, liver, spleen, lung, kidney, brain, and eye tissues of LE-NPs group were 2.11, 1.62, 2.04, 1.44, 2.3, 1.46, and 2.34 times higher than those of LE group, respectively. The AUC(0–24) values of LE-NPs (containing 50 mg/kg LE) in each organ after intragastric administration were in the following order: liver > eye > kidney > spleen > heart > lung > brain. The AUC(0–24) values of the same amount of pure LE after intragastric administration in rats were in the following order: liver > kidney > eye > spleen > lung > heart > brain. The ratios of LE-NPs and pure LE samples in the heart, liver, spleen, lung, kidney, brain, and eye of rats were 1.73, 1.95, 1.92, 1.26, 1.38, 1.69, and 2.34.
Table 2 Pharmacokinetic parameters of lutein in various tissues after oral administration of LE-NPs and primary LE (n=3)
Figure 8 Comparison of lutein concentration in the tissue after administration of LE-NPs and raw LE at different time points: (A) 0.25 hour; (B) 0.5 hour; (C) 1 hour; (D) 2 hours; (E) 6 hours; and (F) 24 hours.
Notes: Values are presented as mean ± SD. *P<0.05, **P<0.01, and ***P<0.001.
Abbreviations: LE, lutein ester; LE-NPs, lutein ester nanoparticles.
Ocular pharmacokinetics
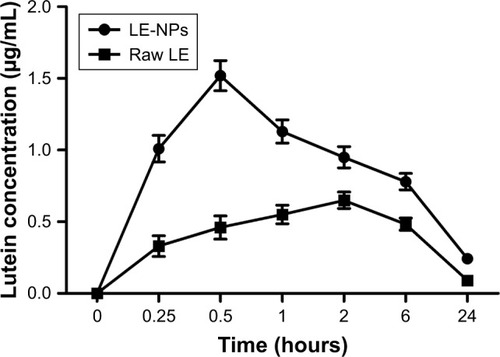
The mean ocular drug concentration–time profiles after oral administration of LE-NPs and LE drug are illustrated in . Regarding the absorption rate of the drug by the eye, the Tmax of the LE-NPs (0.5 hour) was shorter than that of the raw LE (2 hours), and the difference was statistically significant. Concerning the extent of absorption of the drug in the eye, the results revealed the superiority of the LE-NPs to the LE as revealed by their Cmax and AUC values (). The Cmax values were 1.52±0.116 and 0.65±0.0563 mg/L for LE-NPs and raw LE, respectively, which showed the Cmax values of the LE-NPs were significantly higher than those of the raw LE (P<0.05). On the other hand, the results showed that the AUC(0–24) value of lutein was 14.803±1.373 and 6.326±0.534 mg/L·h in the eyes of rats in LE-NPs and raw LE groups, respectively. Thus, the AUC(0–24) values of the LE-NPs were significantly higher than those of the raw LE (P<0.01). It can be seen from that the LE-NPs increase the residence time of lutein in the eye and delay its elimination. The results of ocular pharmacokinetic studies indicated that the LE-NPs system can enhance the ocular bioavailability of LE. Therefore, it can be stated that LE-NPs prepared by LAP technique is a high-efficiency ocular delivery system.
Figure 9 Concentration–time profile of lutein in the eye upon oral administration of LE-NPs or raw LE.
Note: Values are presented as mean ± SD.
Abbreviations: LE, lutein ester; LE-NPs, lutein ester nanoparticles.
Conclusion
In this study, LE-NPs were successfully prepared by LAP method using tetrahydrofuran as the solvent and deionized water as the antisolvent. Poloxamer 188 was selected as the surfactant to inhibit the particle aggregation. The LAP method was optimized by single-factor design to determine the optimal conditions for the process, including the amount of surfactant to be added, volume ratio of antisolvent to solvent, drug concentration, stirring speed, precipitation temperature, and stirring time, which were found to be 0.5%, 1:7, 50 mg/mL, 950 rpm, 25°C, and 10 minutes, respectively. LE nanosuspension with a mean particle size of 109.1±3.4 nm was prepared under the optimum conditions, and then a mean particle size of 164.1±4.3 nm was achieved for the LE-NPs by lyophilization. The results of XRD, DSC, and TG analyses indicated that the obtained LE-NPs were amorphous. The residues of tetrahydrofuran in LE-NPs met the requirements of ICH. The dissolution test results showed that the dissolution rate and solubility of LE-NPs were significantly higher than the raw LE. In addition, LE-NPs showed a higher DPPH- and ABTS-scavenging activity and a lower power than the raw LE, which could be explained by the decreased particle size accompanied by the increased water solubility. Moreover, the in vivo oral bioavailability of the LE-NPs was significantly higher compared with that of the raw LE; the bioavailability of the LE-NPs in the rat eyeballs was 2.34 times that of the raw LE. Thus, LE-NPs have potential application as a new oral drug formulation.
Acknowledgments
The authors are grateful for the precious comments and careful corrections made by the anonymous reviewers. They would also like to acknowledge the financial support from the National Key Research and Development Program (2017YFD060070601).
Disclosure
The authors report no conflicts of interest in this work.
References
- BanerjeeABhattacharyyaSGhoshSGhoshMAntioxidative role of lutein esters extracted from Indian marigold flower on soybean oil during heatingIndian J Chem Technol2015226297302
- WangTHanJTianYCombined process of reaction, extraction, and purification of lutein in marigold flower by isopropanol–KOH aqueous two-phase systemSep Sci Technol201651919
- Rodriguez-AmayaDBLatin American food sources of carotenoidsArch Latinoam Nutr1999493 Suppl 174S843S10971848
- KhalilMRailaJAliMStability and bioavailability of lutein ester supplements from Tagetes flower prepared under food processing conditionsJ Funct Foods201243602610
- MariuttiLRBMercadanteAZCarotenoid esters analysis and occurrence: what do we know so far?Arch Biochem Biophys2018648364329654730
- ZhangYHuiBDZhangLXHydrolysis of lutein ester during its digestion and absorption in vivoFood Science2007288461465
- FurrHCClarkRMIntestinal absorption and tissue distribution of carotenoidsJ Nutr Biochem199787364377
- GranadoFOlmedillaBGil-MartínezEBlancoILutein ester in serum after lutein supplementation in human subjectsBr J Nutr19988054454499924266
- BoneRALandrumJTCaoYHowardANAlvarez-CalderonFMacular pigment response to a supplement containing mesozeaxanthin, lutein and zeaxanthinNutr Metab20074112
- WHOGlobal data on visual impairment2012 Available from: http://www.who.int/blindness/GLOBALDATAFINALforweb.pdfAccessed March 17, 2019
- DwyerJHNavabMDwyerKMOxygenated carotenoid lutein and progression of early atherosclerosis: the Los Angeles Atherosclerosis StudyCirculation2001103242922292711413081
- RicherSStilesWStatkuteLDouble-masked, placebo-controlled, randomized trial of lutein and antioxidant supplementation in the intervention of atrophic age-related macular degeneration: the Veterans last study (lutein antioxidant supplementation trial)Optometry200475421622915117055
- SeddonJMAjaniUASperdutoRDDietary carotenoids, vitamins A, C, and E, and advanced age-related macular degeneration. Eye disease case-control Study GroupJAMA199427218141314207933422
- ZhouYWangTMengQZhaiSAssociation of carotenoids with risk of gastric cancer: a meta-analysisClin Nutr201635110911625726725
- MignoneLIGiovannucciENewcombPADietary carotenoids and the risk of invasive breast cancerInt J Cancer2009124122929293719330841
- GeXXXingMYYuLFShenPCarotenoid intake and esophageal cancer risk: a meta-analysisAsian Pac J Cancer Prev20131431911191823679292
- ChiuH-FLiaoJ-YLuYYAnti-proliferative, anti-inflammatory and pro-apoptotic effects of Dunaliella salina on human KB oral carcinoma cellsJ Food Biochem2017413e12349
- AshrafONasrMNebsenMSaidAMASammourOIn vitro stabilization and in vivo improvement of ocular pharmacokinetics of the multi-therapeutic agent baicalin: delineating the most suitable vesicular systemsInt J Pharm20185391–2839429374518
- Kotake-NaraENagaoAAbsorption and metabolism of xanthophyllsMar Drugs2011961024103721747746
- AlamMAAliRAl-JenoobiFIAl-MohizeaAMSolid dispersions: a strategy for poorly aqueous soluble drugs and technology updatesExpert Opin Drug Deliv20129111419144023043303
- KanaujiaPPoovizhiPNgWKTanRBHAmorphous formulations for dissolution and bioavailability enhancement of poorly soluble ApisPowder Technol2015285215
- RannehA-HIwaoYNoguchiSOkaTItaiSThe use of surfactants to enhance the solubility and stability of the water-insoluble anticancer drug SN38 into liquid crystalline phase nanoparticlesInt J Pharm20165151–250150527793711
- StancanelliRLøjknerLDLarsenKLStructural and spectroscopic features of lutein/butanoyl-β-cyclodextrin nanoassembliesJ Pharm Biomed Anal2012717121421822938801
- NalawadePGajjarAPreparation and characterization of spray dried complexes of lutein with cyclodextrinsJ Incl Phenom Macrocycl Chem2015831–27787
- ZhaoLTemelliFCurtisJMChenLEncapsulation of lutein in liposomes using supercritical carbon dioxideFood Res Int2017100Pt 116817928873676
- WeiQKeckCMMüllerRHSolidification of hesperidin nanosuspension by spray drying optimized by design of experiment (Doe)Drug Dev Ind Pharm201844111228967287
- ZheWChenJFLeYShenZGYunJPreparation of ultrafine beclo-methasone dipropionate drug powder by Antisolvent precipitationInd Eng Chem Res2007461448394845
- KniekeCAzadMAToDBilgiliEDavéRNSub-100 micron fast dissolving nanocomposite drug powdersPowder Technol20152714960
- HuJJohnstonKPWilliamsRONanoparticle engineering processes for enhancing the dissolution rates of poorly water soluble drugsDrug Dev Ind Pharm200430323324515109023
- KippJEThe role of solid nanoparticle technology in the parenteral delivery of poorly water-soluble drugsInt J Pharm20042841–210912215454302
- RogersTLJohnstonKPWilliamsROWrRSolution-based particle formation of pharmaceutical powders by supercritical or compressed fluid CO2 and cryogenic spray-freezing technologiesDrug Dev Ind Pharm200127101003101511794803
- ZuYSunWZhaoXPreparation and characterization of amorphous amphotericin B nanoparticles for oral administration through liquid antisolvent precipitationEur J Pharm Sci201453110911724345795
- ZuYWuWZhaoXEnhancement of solubility, antioxidant ability and bioavailability of taxifolin nanoparticles by liquid antisolvent precipitation techniqueInt J Pharm20144711–236637624882039
- LiYZhaoXZuYPreparation and characterization of micronized ellagic acid using antisolvent precipitation for oral deliveryInt J Pharm20154861–220721625841566
- ChenJ-FZhouM-YShaoLFeasibility of preparing nanodrugs by high-gravity reactive precipitationInt J Pharm2004269126727414698598
- ChenJ-FWangY-HGuoFWangX-MZhengCSynthesis of Nanoparticles with Novel Technology: High-Gravity Reactive PrecipitationInd Eng Chem Res2000394948954
- Davidov-PardoGJoyeIJMcclementsDJEncapsulation of resveratrol in biopolymer particles produced using liquid antisolvent precipitation. Part 1: preparation and characterizationFood Hydrocolloids2015457309316
- ThoratAADalviSVUltrasound-assisted modulation of concomitant polymorphism of curcumin during liquid antisolvent precipitationUltrason Sonochem201630354326703200
- Villanueva BermejoDIbáñezERegleroGTurnerCFornariTRodriguez-MeizosoIHigh catechins/low caffeine powder from green tea leaves by pressurized liquid extraction and supercritical antisolvent precipitationSep Purif Technol20151484956
- DjerafiRSwanepoelACramponCSupercritical antisolvent co-precipitation of rifampicin and ethyl celluloseEur J Pharm Sci201710216117128302396
- WuWWangLWangLPreparation of honokiol nanoparticles by liquid antisolvent precipitation technique, characterization, pharmacokinetics, and evaluation of inhibitory effect on HepG2 cellsInt J Nanomedicine2018135469548330271141
- TsaoRYangRYoungJCZhuHManolisTSeparation of geometric isomers of native lutein diesters in marigold (Tagetes erecta L.) by high-performance liquid chromatography-mass spectrometryJ Chromatogr A200410451–2657015378880
- ZhaoXDengYZhangYSilymarin nanoparticles through emulsion solvent evaporation method for oral delivery with high antioxidant activities, bioavailability, and absorption in the liverRSC Advances20166959313793146
- BaarsDCRundellSAHautRCTreatment with the non-ionic surfactant poloxamer P188 reduces DNA fragmentation in cells from bovine chondral explants exposed to injurious unconfined compressionBiomech Model Mechanobiol200652–313313916520961
- ZhangXChenHQianFChengYPreparation of itraconazole nanoparticles by anti-solvent precipitation method using a cascaded microfluidic device and an ultrasonic spray drierChem Eng J201833422642272
- ZhangH-XWangJ-XZhangZ-BLeYShenZ-GChenJ-FMicronization of atorvastatin calcium by antisolvent precipitation processInt J Pharm20093741–210611319446766
- DaYHLeeJSLeeHGChitosan/poly-γ-glutamic acid nanoparticles improve the solubility of luteinInt J Biol Macromol20168591526712702
- GrauMJKayserOMüllerRHNanosuspensions of poorly soluble drugs – reproducibility of small scale productionInt J Pharm2000196215515910699708
- KamilASmithDEBlumbergJBAsteteCSabliovCOliver ChenC-YBioavailability and biodistribution of nanodelivered luteinFood Chem201619291592326304429