
 ?Mathematical formulae have been encoded as MathML and are displayed in this HTML version using MathJax in order to improve their display. Uncheck the box to turn MathJax off. This feature requires Javascript. Click on a formula to zoom.
Abstract
Introduction and aim
Olmesartan medoxomil (OLM) is an antihypertensive drug with low oral bioavailability due to extensive first-pass metabolism. This study aimed to prepare transetho somes (TEs) for enhancing the transdermal delivery of OLM to avoid its oral problems.
Methods
TE formulae were prepared utilizing 51.31 full factorial design using various surfactants (SAAs) and different phospholipid-to-SAA ratios. The formulae were characterized regarding their entrapment efficiency percentage (EE%), particle size (PS), polydispersity index (PDI), zeta potential (ZP), and the amount of drug released after 6 hours (Q6h). Design Expert® software was employed to select the optimum formula.
Results
The optimum formula (TE14) had an EE% of 58.50%±1.30%, PS of 222.60±2.50 nm, PDI of 0.11±0.06, ZP of −20.80±0.30 mV, and Q6h of 67.40%±0.20%. In addition, TE14 was compared to transferosomes (TFs) in terms of elasticity and was found to show higher deformability index. Further, evaluation of ex vivo permeation using both rat and shed snake skin showed higher permeability of TE14 compared to TFs and OLM suspension. Confocal laser scanning microscopy confirmed the capability of the fluorolabeled TE14 to penetrate deep within the skin, while the histopathological study confirmed its safety. TE14 successfully maintained normal blood pressure values of rats up to 24 hours. Moreover, TE14 showed superiority in dermatokinetic study when compared with drug suspension.
Conclusion
Taken together, the obtained results confirmed the potential of employing TEs as a successful carrier for the transdermal delivery of OLM.
Introduction
Skin is regarded as the largest organ of the human body. From a pharmaceutical point of view, it offers advantages over other routes of administration, including avoidance of the first-pass metabolism, smaller fluctuations in plasma drug levels for repeated administration, and good patient compliance.Citation1 However, transdermal delivery is a challenging process for the drug molecule to exert its therapeutic action due to complex skin features. Skin is a multilayered organ consisting of many histological layers described as epidermis, dermis, and adipose tissue. The stratum corneum (SC) is the upper most layer of the epidermis with a thickness of 10–15 µm and represents the main barrier to drug flux.Citation2 The physicochemical properties of the drugs are highly decisive for their ability to pass the SC, and to permeate across the SC, it is required that the drugs have a molecular weight less than 500 g/mol and a log P-value of 1–3.Citation3
Olmesartan medoxomil (OLM) belongs to Biopharmaceutics Classification System class II with a limited oral bioavailability of 26% due to its poor solubility and extensive first-pass metabolism. OLM is bioactivated by ester hydrolysis to form the active olmesartan during absorption. The efficacy of OLM has been shown to be much higher or at least equivalent to many other prescribed antihypertensive agents.Citation4 An alternative technique to oral delivery of OLM is to integrate the drug into submicroscopic vesicles and give it through transdermal route, thereby obscuring the drug molecule and delivering it to systemic circulation in a controlled manner which subsequently avoids the first-pass metabolism.
Liposomes are defined as phospholipid (PC) vesicles consisting of one or more lipid bilayers enclosing aqueous compartment. Although few studies have suggested the possibility of transdermal drug delivery using liposomes, a large number of studies rather associate liposomes with topical drug delivery.Citation5 A new class of liposomes named transferosomes (TFs) were introduced by Cevc et alCitation6 as a drug delivery vehicle composed of a PC bilayer and surfactant (SAA). The presence of SAA imparts elasticity to the prepared vesicles which minimizes their rupture especially when applied to the skin. TFs contain both hydrophobic and hydrophilic entities which can enclose drug molecules with a wide range of solubility. They can deform and pass through the narrow constriction (from 5 to 10 times less than their own diameter) without measurable loss. This high deformability offers better penetration of vesicles. In addition, SAA presents in the vesicles can disrupt the packing of lipids and proteins within the SC.Citation7 Numerous reports have shown that transdermal drug delivery from TFs was more effective than that from rigid liposomes. Nevertheless, several studies showed that TFs were not able to penetrate the lower layers of SC. Ethosomes, on the other hand, which were developed by Touito et al,Citation8 are composed of PC and ethanol. Ethosomes enhance the skin permeation of drugs due to the interdigitating effect of ethanol on the lipid bilayer of vesicles and by increasing the fluidity of SC lipids.Citation9 Further, many attempts have been made for formulating transethosomes (TEs), containing both ethanol and SAA, which mimic the properties of both TFs and ethosomes.Citation10 TEs are able to cross intact skin by transcutaneous hydration gradient. Drying and partial dehydration of vesicles are considered to be the initial events in skin permeation by the vesicles after topical application. As a result, the vesicles become compressed or curved. The PC component of the vesicles has a tendency to evade a dry environment. Thus, to stay fully swollen, the vesicles follow the local hydration gradient and penetrate more strongly the hydrated layers of skin, reaching the epidermis and dermis.Citation11
Few studies have investigated the transdermal delivery of OLM.Citation12,Citation13 To the best of our knowledge, there is no published research about the use of TEs to enhance the transdermal delivery of OLM. Therefore, the aim of the present work was to evaluate the ability of TEs to enhance the transdermal permeability of OLM and investigate its safety. In addition, we wanted to evaluate the antihypertensive activity of OLM-loaded TEs and estimate the amount of OLM deposited in the skin of experimental animals. For this purpose, different variables influencing vesicles’ characteristics were studied employing 5Citation1.3Citation1 full factorial design using Design Expert® software to identify the optimum formula. SAA type (X1) and PC:SAA ratio (X2) were studied as independent variables, while entrapment efficiency percentage (EE%; Y1), particle size (PS; Y2), polydispersity index (PDI; Y3), zeta potential (ZP; Y4), and the amount of drug released after 6 hours (Q6h; Y5) were selected as dependent variables. The optimum TEs were evaluated for morphology and stability and compared to TFs in terms of elasticity and ex vivo permeation. Confocal laser scanning microscopy (CLSM) was employed to visualize the permeation of the optimum TEs through skin layers. Further, histopathological, pharmacodynamic, and dermatokinetic studies of OLM released from the optimum TEs were conducted in male Wistar rats.
Materials
OLM was gifted by FAP Pharmaceutical Co. (Cairo, Egypt). L-α phosphotidylcholine from egg yolk, Span 20 (S20), Span 60 (S60), sodium deoxycholate (SDC), cellulose membrane (12,000–14,000 molecular weight cutoff), and fluorescein diacetate (FDA) were purchased from Sigma Aldrich Chemical Co. (St Louis, MO, USA). Tween 20 (T20), Tween 80 (T80), potassium dihydrogen phosphate, and dipotassium hydrogen phosphate were obtained from El-Nasr Pharmaceutical Chemicals Co. (Cairo, Egypt). Ethanol 95%, chloroform, methanol, acetonitrile, and triethylamine (HPLC grade) were provided by Merck (Darmstadt, Germany). Angiosartan® 10 mg oral tablet, indicated in the manuscript as market tablet, was purchased from Chemipharm (Cairo, Egypt).
Methods
Preparation of OLM-loaded TEs
Vesicles were prepared using three different amounts of several SAAs, namely T20, T80, S20, S60, and SDC (5, 15, and 25 mg), and PC (75, 85, and 95 mg) adopting thin-film hydration method.Citation14 First, PC and SAA with OLM (25 mg) were weighed in a long-necked round-bottom flask and dissolved in 10 mL chloroform. By maintaining pressure under vacuum for 30 minutes, the organic phase was slowly evaporated at 60°C using a rotary evaporator (Rotavapor VV 2000; Heidolph, Schwabach, Germany) at 90 rpm till a thin clear film of vesicles was formed. The film was hydrated using 10 mL distilled water containing 4% (v/v) ethanol, at 60°C which is above the lipid phase transition temperature (Tc).Citation15 To ensure complete hydration of the film, glass beads were added and kept for 45 minutes.Citation16 The vesicles dispersion was left overnight at 4°C to obtain mature vesicles. For the purpose of comparison, OLM-loaded TFs (composed of 85 mg PC and 15 mg SDC) were prepared by the previously described method, except that in hydration step the film was hydrated with 10 mL distilled water.
Characterization and optimization of OLM-loaded TEs
Determination of EE%
The vesicular dispersion of the prepared formulae was centrifuged at 20,000 rpm for 1 hour at 4°C using a cooling centrifuge (Sigma 3-30 KS; Sigma Laborzentrifugen GmbH, Osterode am Harz, Germany). Then, the sediment was lysed using methanol and analyzed at λmax 257 nm13 using a UV–Vis spectrophotometer (Shimadzu UV1650 Spectrophotometer; Shimadzu Corp., Kyoto, Japan). EE% was determined by using the following equation:Citation17
Determination of PS, PDI, and ZP
The mean PS, PDI, and ZP of vesicles dispersions were determined for the prepared formulae using Malvern Zetasizer 2000 (Malvern Instruments Ltd., Malvern, UK). The measurements were performed after dilution.Citation18 The ZP evaluation was carried out by monitoring the electrophoretic movement of the particles in the electrical field. All measurements were performed in triplicate.
Determination of Q6h
Q6h was determined using the United States Pharmacopeia (USP) dissolution apparatus (Pharma Test, Hainburg, Germany) for 6 hours at 37°C. Samples of 2 mL (containing 5 mg OLM) from the prepared formulae were placed in plastic cylindrical tubes which have a permeation area of 3.14 cm2 with one end tightly covered with a cellulose membrane and the other end attached to the shaft of the USP dissolution apparatus instead of the baskets. The formulae were immersed in 50 mL PBS (pH 7.4) and ethanol mixture (30:20, v/v).Citation19 The sink condition was maintained in this volume. Aliquots were withdrawn at 1, 2, 3, 4, 5, and 6 hours. OLM in aliquots was analyzed by a UV spectrophotometer at λmax 257 nm. The experiment was performed in triplicate.
Assessment of the influence of different formulation parameters using 5Citation1.3Citation1 full factorial design
A complete 5Citation1.3Citation1 full factorial design was used to detect the influence of different variables on the aspects of OLM-loaded TE dispersions using minimum experimental runs. In the selected design, two factors were evaluated: one with five levels (X1: SAA type) and another with three levels (X2: PC:SAA ratio). The EE% (Y1), PS (Y2), PDI (Y3), ZP (Y4), and Q6h (Y5) were designated as dependent variables (). The experimental trials were performed with all possible combinations for preparing OLM-loaded TEs (). Design Expert software version 11 (Stat Ease, Inc., Minneapolis, MN, USA) was used to analyze experimental results to source independently the main effects of these factors followed by ANOVA to determine the significance of each factor.
Optimization of OLM-loaded TEs
For determining the optimum formula to be used for further investigations, the desirability function that predicts the optimum levels of investigated factors was calculated. The criterion set for selecting the optimum formula was achieving the least PS and PDI and the highest EE%, ZP (as absolute value), and Q6h.
Transmission electron microscopy (TEM)
Morphology of the optimum TEs was examined using a transmission electron microscope (JEOL JEM 1230; JEOL, Tokyo, Japan). The vesicular dispersion was placed in the form of a thin film on a carbon-coated copper grid, stained using phosphotungstic acid 1.5%, and then viewed and photographed.Citation17
Differential scanning calorimetry (DSC)
The thermal analysis of pure OLM, PC, SDC, physical mixture of OLM and transethosomal components, and the optimum TEs was performed using a differential scanning calorimeter (DSC-60; Shimadzu Corp.) calibrated with purified indium. Approximately 5 mg of each sample was mounted in a standard aluminum pan and heated at a temperature range of 10°C–250°C at a scanning rate of 5°C/min under inert nitrogen flow (25 mL/min).Citation18
Stability studies
Optimum TEs were stored at 4°C and 25°C for 45 days. Samples were withdrawn at 0 and 45 days. Stability was evaluated by comparing the initial measurements with results obtained after storage.Citation20 The EE%, PS, PDI, ZP, and Q6h of the vesicles were measured as described previously. Vesicles were examined visually for aggregation and change in their appearance. Statistical significance was analyzed by Student’s t-test using SPSS® software 22.0. Difference at P≤0.05 was considered significant.
Measurement of vesicles’ elasticity
Extrusion method was used for comparative assessment of elasticity of the bilayer for the prepared TFs and optimum TEs. Vesicles were extruded through a nylon filter with a diameter of 200 nm at 2.5 bar (Büchi Labortechnik AG, Flawil, Switzerland). Elasticity was expressed in terms of deformability index (DI) according to the following equation:Citation21
Ex vivo studies
Comparative study between ex vivo permeation through rat skin and shed snake skin
The transdermal permeability of OLM suspension, the prepared TFs, and optimum TEs through rat skin and shed snake skin was studied. Rat skin was excised from animals after being sacrificed. Shed snake skin was donated by Giza Zoo, Giza, Egypt. The setting of the test was similar to that used for the in vitro release, but the cellulose membrane was replaced by dorsal skin with the SC facing the donor compartment.Citation21 Aliquots were taken from the receiving compartment at time intervals of 2, 4, 8, 10, and 12 hours. Each sample was analyzed using HPLC. The studies were performed in triplicates, and the results were expressed as mean values ± SD. The permeation flux (Jmax) at 12 hours and the enhancement ratio (ER) were calculated according to the following equations:Citation22
Statistical significance was analyzed by one-way ANOVA using SPSS software 22.0. Post hoc analysis was performed using Tukey’s honestly significant difference (HSD) test. Difference at P≤0.05 was considered significant.
HPLC determination of OLM
An isocratic reversed-phase validated HPLC method was used for detection and quantification of OLM.Citation4 The apparatus used was an Agilent 1260 infinity LC system equipped with a quaternary pump, an auto-sampler unit, and a UV detector (Shimadzu Corp.). The stationary phase was Thermo® C18 (150×4.6 mm) column packed with a 5 µm size adsorbent. The mobile phase was composed of deionized water:triethylamine:acetonitrile (60:0.3:40, v/v/v), and the pH was adjusted to 6.3 with 18% phosphoric acid. The flow rate was set at 1 mL/min, and the detector was set at λmax 257 nm. Injection volume was 20 µL. The retention time of OLM was 3 minutes.
Ex vivo visualization using CLSM study
FDA-loaded TEs were formulated using the same method used for preparing the optimum TEs, but FDA at a concentration of 1% substituted OLM in the optimum formula. To simulate the application of TEs onto the skin surface, FDA-loaded TEs were applied on skin surface and allowed to remain for 6 hours. Dorsal rat skin was mounted with the SC facing the donor compartment in diffusion cells with the same setting used in the ex vivo permeation study. After that, the skin was rinsed with 10% ethanol. Longitudinal skin sections that were treated with vesicles and 1% FDA solution as a control were kept in paraffin wax and cut into sections using a microtome blade to compare and observe the distribution of vesicles in the skin layers.Citation23 The sample slides were examined using an inverted microscope (LSM 710; Carl Zeiss, Oberkochen, Germany). The excitation and emission wavelengths of FDA were λmax 497 nm and λmax 516 nm, respectively. The skin thickness was optically scanned under a ×40 objective lens (EC-Plan Neofluar 63x/01.40 Oil DICM27). Confocal images were taken and processed by means of LSM Image Browser software, release 4.2 (Carl Zeiss Microimaging GmbH, Jena, Germany).
In vivo studies
Eighty-seven male Wistar rats, weighing 150–200 g, with an average age of 7 weeks were used in the in vivo studies. The study design was approved by the ethical committee of the Faculty of Pharmacy, Cairo University (reference number = (PI) 1867). The use and handling of animals in all studies complied with the EU directive 2010/63/EU for animal experiment. The animals were kept in cages at a temperature of 22°C and relative humidity of 55%. Water and rodents chow were provided. The animals were kept in a dark:light cycle of 12 hours each. Rats were left for 7 days for adaptation before experiments. Nine animals were used in the histopathological study, 24 in the pharmacodynamic study, and 54 in the dermatokinetic study. For the administration of OLM suspension and optimum TEs in the in vivo studies, bottle caps were utilized which acted as drug pools with an area of 4.91 cm2. The bottle caps were fixed to dorsal rat skin which was shaved with an electric clipper 24 hours before application of the samples. Moreover, the samples were added nonocclusively into the drug pools.Citation24–Citation26
Histopathological study
Nine male Wistar rats were divided into three groups of three rats each. The treatment period was 1 day. Group I served as control, while groups II and III received OLM suspension and optimum TEs topically, respectively. Skin samples were fixed in 10% formol saline for 24 hours, followed by washing and dehydration using alcohol. Specimens were cleared in xylene and embedded in paraffin wax blocks and kept at 56°C for another 24 hours, followed by sectioning as paraffin bees wax tissue blocks at 4 mm by a sledge microtome (Rotary Leica RM2245; Leica Biosystems, Wetzlar, Germany). The specimens were deparaffinized and stained by H&E stains for histopathological examination using a light microscope (Axiostar Plus; ZEISS, Oberkochen, Germany).Citation24
Pharmacodynamic study
Pharmacodynamic study was carried out using animal tail noninvasive blood pressure (BP) system (NIBP 200 A; Biopac System, Inc., Goleta, CA, USA) based on cuff tail technique. Twenty-four male Wistar rats were divided into four groups (groups A–D) of six animals each. Group A was taken as a negative control. Hypertension was induced in the remaining groups (groups B–D) by subcutaneous injection of methyl prednisolone acetate (MPA; Depo-Medrol®; Pfizer, New York, NY, USA) (20 mg/kg/week) for 2 weeks. Group B served as hypertensive positive control and received no further treatment. Group C received market tablet (Angiosartan 10 mg) orally that was previously crushed and administered to the rats by using oral gavage.Citation27 Group D was subjected to transdermal treatment with 4 mL of optimum TEs (containing 10 mg OLM). The rats were then placed in the restrainer, and the BP in the tail was recorded at predetermined time intervals at 0, 1, 2, 4, 6, 8, and 24 hours.Citation28 Statistical significance was analyzed by one-way ANOVA using SPSS software 22.0. Post hoc analysis was performed using Tukey’s HSD test. Difference at P≤0.05 was considered significant. Percentage of reduction in BP from hypertensive control was calculated by the following equation:
Dermatokinetic study
Dermatokinetic study was done using 54 male Wistar rats which were divided into three groups of 18 animals each. Group I acted as control, while groups II and III received OLM suspension and optimum TEs topically, respectively. Half milliliter of each sample (OLM suspension and optimum TEs) was applied to dorsal rat skin on an area of 4.91 cm2, which was shaved 24 hours before application, as previously mentioned. After treatment, three animals from each group were sacrificed at different time intervals (1, 2, 4, 6, 8, and 10 hours). The excised skin was cut into pieces and sonicated in 5 mL methanol for 30 minutes. The extract was then filtered through a 0.45 µm filter, and the concentration of OLM was determined by HPLC. The destruction of animal carcasses was achieved by incineration.Citation24–Citation26 Dermatokinetic parameters such as Tmax, Cmax, and AUC0–10 were determined by employing Kinetica® 5 software (Thermo Fisher Scientific Inc., Waltham, MA, USA). Cmax and AUC0–10 were compared between the two treatments using ANOVA test. In addition, nonparametric signed-rank test (Mann–Whitney’s test) was employed for the comparison of medians of Tmax for the treatments using SPSS software 22.0. Difference at P≤0.05 was considered significant.
Results and discussion
Analysis of factorial design
Preliminary trials were performed (data not shown) to determine the effective ranges of the independent variables. Two independent variables were studied: the SAA type (X1) and PC:SAA ratio (X2). EE% (Y1), PS (Y2), PDI (Y3), ZP (Y4), and Q6h (Y5) were selected as dependent variables. Referring to the design analysis results in , the model selected was two-factor interaction and it was noted that the predicted R2 values were in reasonable agreement with the adjusted R2 in all responses except PDI. The negative predicted R2 value of PDI implies that the overall mean is a better predictor of the response.Citation29 This might be due to that PDI of the prepared TEs was not affected by the studied factors. The adequate precision with a ratio greater than 4 is desirable which was observed in all responses as shown in .
Table 3 Output data of the 51.31 full factorial analysis of TEformulations and predicted and observed values for the optimum TEformula (TE14)
The effect of formulation variables on EE%
Encapsulation of drugs within PC formulations offers desired delivery, enhanced stability, protection, and permeability depending on lipid composition and properties.Citation30 The effect of the independent variables, SAA type (X1) and PC:SAA ratio (X2), on the EE% of OLM in vesicles is shown in and is graphically illustrated as three-dimensional (3-D) surface plots in . SAA type (X1) had a significant effect on EE% (P<0.0001). The EE% for formulae containing S60 was higher compared to other formulations. This is in accordance with the results obtained by Aboud et alCitation31 and could be explained on the basis of hydrophilic–lipophilic balance (HLB) values of the SAAs which were 4.7, 8.6, 15, 16.7, and 23.4 for S60, S20, T80, T20, and SDC, respectively.Citation31,Citation32 It is well known that SAAs with lower HLB values are more lipophilic and would favor the entrapment of lipophilic drug.Citation26 This explains the increased EE% of OLM, which is a highly lipophilic drug with a log P-value of 5.6,Citation33 in formulae containing S60. Furthermore, the highly hydrophobic alkyl chains of S60 interact with the hydrophobic domain of the vesicles leading to more condensed layers and thus prevent drug leaching from vesicles.Citation34 On the other hand, SAAs with increased hydrophilicity like SDC form less rigid vesicles due to larger polar head groups and also increase drug solubilization in the aqueous medium during preparation which would lower the EE% of OLM.Citation35 In addition, the higher EE% values of S60 compared to S20 might be related to the Tc of the SAA that could be an important factor in explaining the effects of SAA on EE% of lipid-based vesicles. The Tc of S60 and S20 is 53°C and 16°C, respectively.Citation36 It was reported that the higher the Tc of SAA, the better is its ability to form a more ordered structure and a less leaky bilayer which may further improve the EE%. On the other hand, SAAs with lower Tc may result in irregular structural formation and increase the fluidity of the vesicles’ bilayers that in turn reduces the drug EE%.Citation37
Figure 1 Response 3-D plots for the effect of SAA type (X1) and PC:SAA ratio (X2) on (A) EE%, (B) PS, (C) PDI, (D) ZP, and (E) Q6h of OLM-loaded TEs.
Abbreviations: 3-D, three-dimensional; EE%, entrapment efficiency percentage; OLM, olmesartan medoxomil; PC, phospholipid; PDI, polydispersity index; PS, particle size; Q6h, amount of drug released after 6 hours; SAA, surfactant; TEs, transethosomes; ZP, zeta potential.
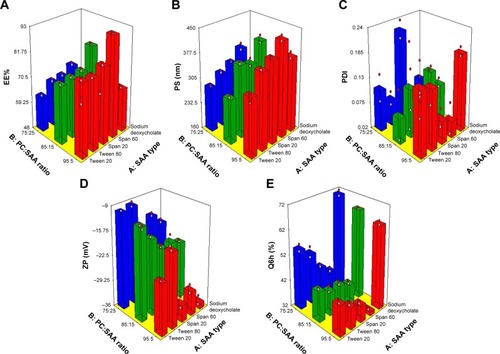
PC:SAA ratio (X2) also had a significant effect on EE% (P<0.0001). PC:SAA ratio of 95:5 showed the highest EE%, while changing the ratio to 75:25 lowered significantly the drug EE% which was irrespective of the SAA type. The results were in accordance with Ezzat et alCitation38 who reported that EE% decreased as PC amount decreased which could be attributed to the decrease in the space available for drug loading into the vesicles.Citation39
The effect of formulation variables on PS
The z-average diameter representing the mean hydrodynamic diameter of the particlesCitation40 was measured, and is presented in and graphically illustrated in 3-D surface plots (). It is noticeable that both SAA type (X1) and PC:SAA ratio (X2) influenced significantly (P<0.0001) the PS of the vesicles. Considering the SAA type, the PS was greater for formulae prepared using S60 than the equivalent formulations prepared using other SAAs. Yeo et alCitation41 stated that the PS of vesicles increases when HLB value of SAA decreases which is related to decrease in the hydrophilic portion of SAA. Thus, S60 with the lowest HLB value (4.7), as mentioned earlier, resulted in the highest PS. Further, the formulae prepared with S60 and T80 with an alkyl chain length of 18 carbon atoms showed larger PS when compared to their corresponding formulations prepared with S20 and T20 with an alkyl chain length of only C12, respectively. SAAs with a longer alkyl chain result in a larger core space of the vesicles with a greater diameter.Citation21 In addition, this may be attributed to the fact that the increase in alkyl chain length would result in an increase in the value of the critical packing parameter of the SAA which determines the aggregation state of the vesicles’ components.Citation42 On the other hand, the smallest vesicles were obtained upon incorporation of anionic SDC into the vesicles’ bilayers because of the steric repulsion between the charged molecules exposed from the outer layer of the vesicles’ membranes. This would increase the vesicles’ membranes curvature and thus lessen the size of the vesicles.Citation22 Furthermore, the high HLB value of SDC (23.4) also accounted for the small PS, as mentioned earlier.Citation32
With respect to PC:SAA ratio (X2), the PC:SAA ratio of 75:25 resulted in the smallest PS compared with the other two ratios. It is known that PC has a cylindrical shape because of the large volume of its hydrophobic tail. Moreover, SAA molecule has a cone-like shape because the amphiphilic head group needs more space than the cross-sectional area of the hydrophobic tail. When the cone-shaped SAAs interact with lipid bilayers, the hydrophobic tails of SAAs insert into the lipid bilayers and their head groups interact with the lipid polar fragments. Increasing the quantity of SAA increases the disparity between the hydrophobic chain lengths of PC and SAA, resulting in an increase in the curvature of lipid SAA aggregates. Consequently, the cone-shaped SAA generates perturbation to the closely packed lipid bilayers resulting in reduction of the PS.Citation43 It was also observed from the results that the PS was in accordance with the amount of drug entrapped into the vesicles. Therefore, the decrease in EE% would give another explanation for the lower PS of vesicles.Citation44
The effect of formulation variables on PDI
PDI is a measure of the width of unimodal size distributions. A value of 0 indicates homogenous dispersion, while a value of 1 indicates an entirely heterogeneous polydisperse population. An acceptable PDI should have a value below 0.5.Citation26,Citation45 PDI values are presented in and graphically illustrated in 3-D surface plots (). Factorial analysis of variance showed that both independent variables, SAA type (X1) and PC:SAA ratio (X2), showed no significant effect on PDI with P-values of 0.78 and 0.59, respectively. As observed from the results, the PDIs of the prepared vesicles were in general small which indicates good homogeneity and narrow size distribution.
The effect of formulation variables on ZP
Particle aggregation is less likely to occur for charged vesicles having a ZP of ≥|30|mV because of electrostatic repulsion.Citation46 The ANOVA results showed that both independent variables, SAA type (X1) and PC:SAA ratio (X2), showed a significant effect on ZP (P<0.0001) as depicted in and graphically illustrated as response 3-D plots in . The ZP of vesicles decreased when using Tweens rather than Spans which could be attributed to the higher HLB values of Tweens compared to Spans. Kim et alCitation47 stated that the HLB value of the SAA influences the competitive adsorption of OH ions at the interface which are present in the hydration medium. If the HLB value of the SAA is lower (the nonpolar interface is more), more OH ion adsorption will occur and consequently ZP will increase. In addition, the presence of (CH2-CH2-O)n in Tweens formed hydrogen bonds with water molecules and resulted in lower ZP values.Citation48 Furthermore, the addition of anionic SDC resulted in the highest ZP values compared to other SAAs. After ionization in water, SDC gets adsorbed on particle/water interface and forms an electric double layer. On the other hand, nonionic SAAs have more profound effect on extending the diffuse layer which generates lower ZP while anionic SAAs are held up more tightly around the particle and consequently have lesser effect on the thickness of the diffuse layer, retaining higher ZP values.Citation49
With respect to PC:SAA ratio (X2), vesicles with the greatest amount of PC exhibited the highest ZP. Although PC heads are zwitterionic and thus theoretically uncharged at neutral pH, they give rise to negative ZP value in water.Citation50,Citation51 This has been interpreted in terms of hydration layers formed around the surface and the orientation of lipid head groups.Citation52 Makino et alCitation53 postulated that the charge of PC bilayer is due to the direction of the dipole connecting the negative charge of phosphatidyl group and the positive charge of choline group in the head group of a lipid molecule. It was reported that in a medium of low ionic strength, the head group is oriented in such a way that the phosphatidyl group is outside with the choline group inside in the head group resulting in a negative surface charge.
The effect of formulation variables on Q6h
The release profile is an important marker used to predict the in vivo performance of the drug. It has been suggested that ethanol may provide the vesicles with soft flexible characteristics which allow easy drug diffusion through membranes. Furthermore, the presence of ethanol may decrease the hydration layer around the vesicles which facilitates the release of the drug.Citation17 Q6h values for TEs are shown in and graphically illustrated in 3-D surface plots (). The ANOVA results revealed that SAA type (X1) had a significant effect on drug release (P<0.0001). The release of OLM from TEs was in the following order: SDC > T20 > T80 > S20 > S60. The results were in accordance with Aboud et alCitation31 who reported that SAAs with low HLB value, long alkyl chain, and high Tc slow down the release. Moreover, Tweens as hydrophilic SAAs with high HLB value have greater solubilizing power on hydrophobic drugs compared with hydrophobic Spans with low HLB value.Citation54 In addition, vesicles prepared with SAAs of higher Tc (Spans) are more ordered, stable, and less leaky.Citation37 Furthermore, due to greater interaction between alkyl chains of SAA and PC in the case of SAAs with longer alkyl chain length (T80 and S60), the packing of the vesicles increases and becomes less permeable for the drug when compared with equivalent SAAs with shorter alkyl chain length (T20 and S20).Citation42 On the other hand, the results showed that the highest Q6h values were observed for formulae containing SDC. This could be attributed to that SDC produced the smallest PS compared to other SAAs which resulted in increasing the total surface area and hence increased the release rate.Citation31 Furthermore, the addition of SDC might have produced mixed micelles with PC which resulted in the enhancement of aqueous solubility of OLM in aqueous phase.Citation26
PC:SAA ratio (X2) showed a significant effect on Q6h (P<0.0001). Q6h decreased at high PC amount (95 mg) which could be attributed to that the lipid membranes are present in a firm state which hinders drug release.Citation31 Besides, Kriwet and Müller-GoymannCitation55 related the decrease in drug release with increased content of PC to the high affinity of hydrophobic drug to vesicles’ bilayers. On the other hand, when the amount of SAA increases, the formation of micelles within the bilayer may increase the membrane permeability and thus enhances drug release.Citation56
Selection of the optimum formula
To select the optimum formula, certain criteria were set in Design Expert software version 11. These criteria favored particles with the highest EE%, ZP (as absolute value), and Q6h and the lowest PS and PDI. The optimum formula was TE14 which met these criteria and composed of SDC as SAA and had a PC:SAA ratio of 85:15. TE14 showed an EE% of 58.50%±1.30%, a PS of 222.60±2.50 nm, a PDI of 0.11±0.06, a ZP of −20.80±0.30 mV, and a Q6h of 67.40%±0.20%. In order to validate the experiment, the predicted and observed responses of TE14 were compared and are shown in . A high correlation was observed between the observed and predicted values. Subsequently, TE14 was selected as the optimum formula for further investigations.
Transmission electron microscopy
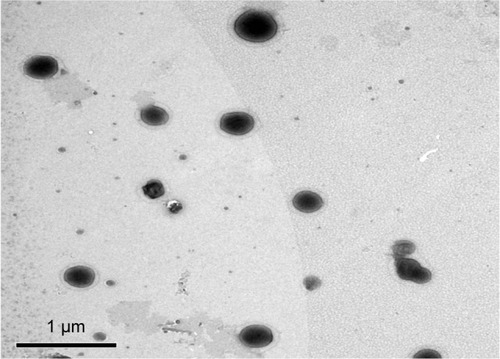
The external morphology of the optimum TE formula (TE14) was studied using TEM analysis. The morphological analysis of TE14 showed that the vesicles were spherical in shape and had a uniform size distribution (). The PS of the vesicles determined by Zetasizer agreed well with TEM results.
Figure 2 Transmission electron micrograph of the optimum TE formula (TE14).
Abbreviation: TE, transethosome.
Differential scanning calorimetry
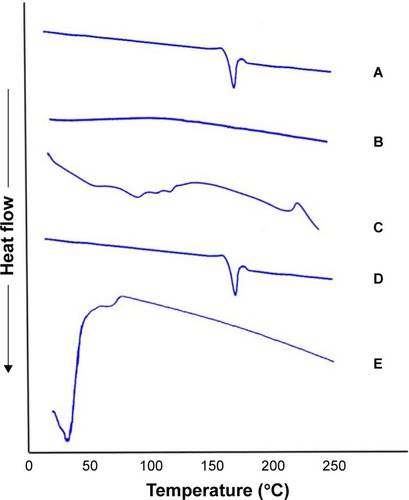
shows the thermograms of pure OLM, PC, SDC, physical mixture of OLM and transethosomal components, and TE14. The DSC scan of pure OLM depicted a single endothermic peak at 184.14°C.Citation33 The DSC thermal curve of PC did not show any thermal effect in the temperature range studied. The behavior observed corresponds to a large endothermic effect which occurs within a wide interval of temperatures.Citation57 Regarding SDC, its thermogram revealed the presence of a broad endotherm that started at 110.82°C probably due to the loss of water molecules followed by an exothermic recrystallization peak at 214°C.Citation58 The characteristic peak of OLM present in the thermogram of physical mixture supports that it still stayed in its crystal line nature.Citation59 The disappearance of the characteristic peak of the drug in DSC thermogram of TE14 might indicate the entrapment of the drug in vesicles due to interactions. Such interactions probably include formation of hydrogen bonds, Van der Waal’s attractive forces, or dipole–dipole forces at the hydroxyl groups of drug and both PC and SDC. These interactions might explain the formation of favorable vesicle shape and structure with good stability.Citation60
Figure 3 DSC thermogram of (A) OLM, (B) PC, (C) SDC, (D) physical mixture of OLM and transethosomal components, and (E) TE14.
Abbreviations: DSC, differential scanning calorimetry; OLM, olmesartan medoxomil; PC, phospholipid; SDC, sodium deoxycholate; TE, transethosome.
Stability study
Lipid vesicular formulations tend to fuse and disintegrate during storage which leads to changes in PS, PDI, and ZP. These changes also bring about drug leakage from the vesicles and reduction in the EE%.Citation20 Statistical analysis revealed that there was no significant difference in EE%, PS, PDI, and Q6h of the stored vesicles when compared to the fresh ones after 45 days at 4°C and 25°C (). In addition, no aggregation or change in appearance was observed after storage. These findings indicate good stability of TE14.
Table 4 Effect of storage on the physical properties of TE14
Measurement of vesicles’ elasticity
It is well known that the elasticity of vesicles could be accomplished by incorporating SAA into the vesicles’ bilayers. In the present study, TE14 contained SDC as SAA which is capable of weakening the lipid bilayers of the vesicles and consequently increases their deformability. Subsequently, the vesicles could overcome the skin penetration difficulty by squeezing themselves through channels of the SC that are less than one-tenth of their diameter.Citation7 Furthermore, the vesicles could induce a slight puffiness in corneocytes, due to the stress-dependent adaptability, which enables them to squeeze between the cells in the skin.Citation6 The results showed that TFs and TE14 possessed a DI of 6.52±0.52 and 14.94±0.63 g, respectively. Statistical analysis showed that there was a significant difference (P≤0.05) between the prepared formulae. The higher DI of TE14 could be attributed to the dual mechanism of both SAA and ethanol rather than SAA alone in case of TFs. It was reported by Maheshwari et alCitation9 that ethanol has the potential to fluidize the skin lipids due to its interdigitation effect on lipid bilayers, which leads to the formation of small pores as penetration pathways, hence justifying the superiority of TE14 over TFs.
Ex vivo studies
Ex vivo permeation through rat skin and shed snake skin
A wide range of animal models has been suggested as a suitable replacement for human skin and has been used to evaluate percutaneous permeation of drugs. The ex vivo permeation study was performed using two skin models: rat skin and shed snake skin. Rat skin is a full-thickness skin that consists of SC with underlying tissues of viable epidermis and dermis.Citation61 Shed snake skin is a nonliving tissue which can be obtained without sacrifices. It consists of three layers – beta, meso, and alpha layers – and is composed of two very different regions – scales and separating these, hinges; the scales are firm, while the hinges are soft.Citation62 From , it could be concluded that the amount of OLM permeated from the formulae (TFs and TE14) was significantly higher than the amount permeated from OLM suspension (P≤0.05). However, it was noticed that OLM permeated through both membranes in the same order: TE14 > TFs > OLM suspension (). The significant lower permeability of OLM suspension than both vesicular formulations may be referred to the characteristics of the drug. It is believed that the high log P-value of 5.6 might be the reason for the poor permeation of OLM.Citation33 A characteristic parabolic relationship between the skin permeability and lipophilicity of various drugs has been previously reported with the maximum permeability at log P of approximately 3–4.Citation63 For deformable vesicles, the case is different as studies have shown that these vesicles can penetrate as intact vesicles into the SC and thus the permeation of the drug is governed primarily by the permeability of the vesicles.Citation3 The greater permeation of TE14 over TFs is probably attributed to the greater DI and elasticity of the former which would permit rapid motion of vesicles across the membrane. Moreover, the presence of ethanol in TEs may facilitate the penetration of the vesicles by fluidizing skin lipids which results in the formation of additional penetration pathways.Citation9
Table 5 Ex vivo permeation of OLM suspension, TFs, and TE14 through rat skin and shed snake skin
Figure 4 Cumulative amount of OLM permeated per unit area across excised rat and shed snake skin via TFs and TE14 relative to drug suspension.
Abbreviations: OLM, olmesartan medoxomil; TFs, transferosomes; TE, transethosome.
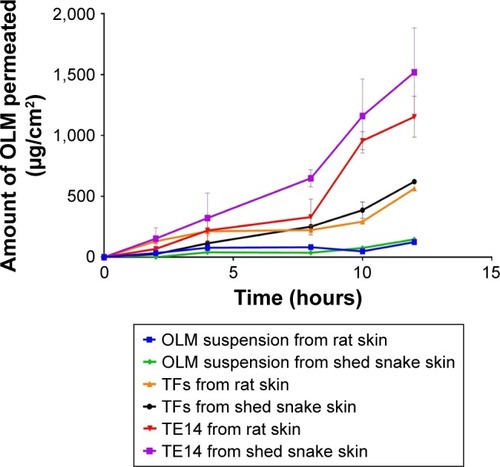
It is worthy to note that shed snake skin showed numerically (not significantly) higher permeability parameters with Jmax of 51.77±1.07 and 126.64±30.32 µg/cm2/h compared to 47.01±0.06 and 96.17±13.97 µg/cm2/h of rat skin for both TFs and TE14, respectively. This might be related to the difference in thickness of both membranes. Thickness of shed snake skin is approximately 0.02–0.03 mm,Citation64 while the thickness of hairless rat skin is 0.70–0.86 mm.Citation65 The obtained results justified the similarity of both skin types and the ability of utilizing them in further ex vivo studies.
Confocal laser scanning microscopy
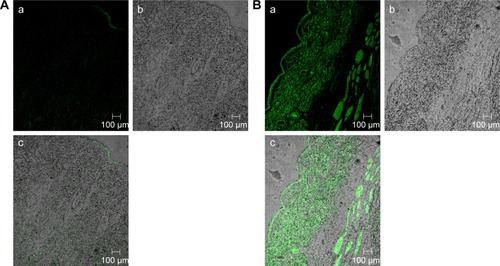
The efficacy of TE14 to permeate across skin was also examined by CLSM by utilizing a model lipid-soluble fluorophore (FDA) instead of OLM in TE14. Before imaging, we confirmed that the nontreated skin did not show any fluorescence in the detection range of the used fluorophore. Firstly, longitudinal section of the skin treated with 1% FDA solution () showed slight distribution of the dye in different skin layers. , which represents a longitudinal section of the skin treated with fluorolabeled TEs, shows the depth and the distribution of the dye through different skin layers. As observed from the previous figures, there was an extensive distribution of fluorescence throughout the skin layers from TEs compared to FDA solution. This might be related to the low penetration ability of FDA solution in contrast to the effective permeation of TE vesicles. Generally, skin permeation can occur through corneocytes as transcellular route, between corneocytes as paracellular route, and through appendages.Citation66 In addition, intense fluorescence was apparent near the hair follicles because of accumulation of TEs in this area. Moreover, the use of the TEs increased fluorescence intensity and the depth of penetration through subcutaneous layer. This effect is expected to have a positive impact on improving drug bioavailability. In summary, CLSM confirmed that the fluorescence intensity of FDA at different skin layers was relatively higher when encapsulated in TEs using follicular pathway as the main penetration pathway. These findings also confirmed that TEs facilitated accumulation of the OLM into skin layers, followed by creating a micro-reservoir system to sustain drug release into skin layers.Citation17
Figure 5 A tile scan confocal laser scanning microscope photomicrographs of (A) longitudinal section of rat skin treated with 1% FDA solution and (B) fluorolabeled TEs: (a) fluorescence light, (b) transmitted light, and (c) merge between fluorescence light and transmitted light.
Abbreviations: FDA, fluorescein diacetate; TEs, transethosomes.
In vivo studies
TE14 showed higher elasticity and permeability compared to TFs. Further, CLSM was used to visualize the complete distribution of TE14 through different skin layers. Consequently, TE14 was subjected to further in vivo investigations.
Histopathological study
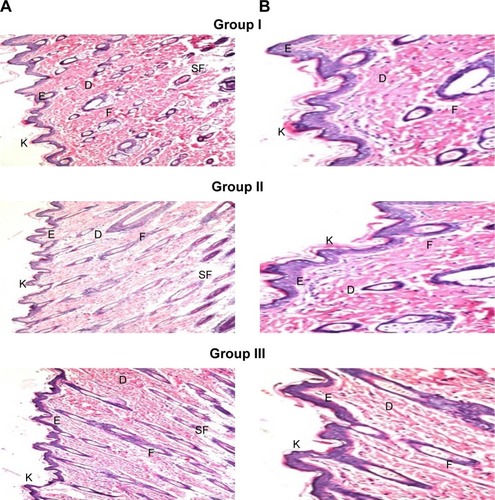
Skin irritation caused by permeation enhancers is considered a major limitation for transdermal administration.Citation67 Light microscopy examination of groups II and III that were treated with OLM suspension and TE14, respectively, showed no histopathological alterations in epidermal and dermal cells when compared to untreated skin sections (group I) (). These findings indicated that TE14 vesicles had acceptable tolerability.
Figure 6 Photomicrographs showing histopathological sections (H&E stained) of normal untreated rat skin (group I), rat skin treated with OLM suspension (group II), and rat skin treated with TE14 (group III). The magnification power of ×16 (A) to illustrate all skin layers and ×40 (B) to identify the epidermis and dermis, respectively.
Abbreviations: D, dermis; E, epidermis; F, hair follicles; K, keratin; OLM, olmesartan medoxomil; SF, subcutaneous fat; TE, transethosome.
Pharmacodynamic study
Administration of MPA elevated the BP above 150 mmHg in normotensive rats.Citation28 Transdermally applied TE14 vesicles showed the highest percentage reduction in BP at 4 hours (35.00%±12.00%), and BP was controlled for up to 24 hours (). This indicates that the drug permeated into systemic circulation in rats in a constant manner through TE14. Moreover, orally administered market tablet was able to maintain BP values at the normal level for up to 6 hours. After that, the market tablet failed to reduce the BP to normal value at 8 and 24 hours posttreatment. On the other hand, TE14 maintained normal BP values of 123.50±12.09 and 127.50±4.33 mmHg at 8 and 24 hours posttreatment, respectively. By comparing the effects of the treatments, the percentage reduction in mean rat BP by market tablet and TE14 was found to be 11.00%±4.00% and 31.00%±2.00%, respectively, at 24 hours posttreatment which confirmed that TE14 showed better antihypertensive activity in rat model in comparison with market tablet. Furthermore, post hoc analysis showed that there was no significant difference (P≥0.05) between the negative control group and TE14-treated group while there was a significant difference between market tablet-treated group and the negative control group at 24 hours posttreatment. These findings indicated that the developed vesicles were effective in returning the BP of MPA-induced hypertensive rats to normal values.
Table 6 Influence of market tablet and TE14 on mean blood pressure in MPA-induced hypertensive rats
Dermatokinetic study
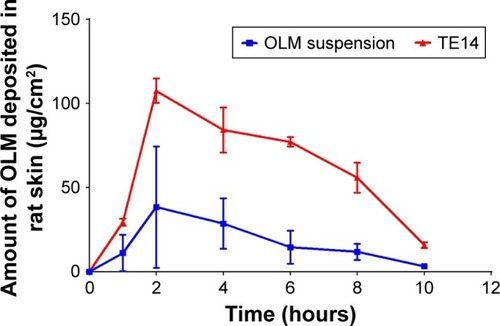
Dermatokinetic study is performed for determination of the amount of drug deposited in the skin.Citation68 The amount of OLM deposited from drug suspension and TE14 through rat skin at different time intervals is depicted in . The skin treated with TE14 showed a significantly higher Cmax of 108.04±6.44 µg/cm2 and an AUC0–10 of 680.46±17.99 µg⋅h/cm2 in the skin layers when compared to the drug suspension with a Cmax of 47.07±32.40 µg/cm2 and an AUC0–10 of 196.30±99.66 µg⋅h/cm2 (P<0.05). This could be related to the potency of SDC in the transethosomal constructs to form chemical bonding with keratocytes in the skin via electrostatic interaction of its anionic head group with the cationic sites of skin proteins. Hence, vesicles acted as drug carriers which not only softened the intercellular matrix of SC but also penetrated deeply to the target site of dermis where a depot from which the drug can be released was formed.Citation24 Furthermore, there was no significant difference between the Tmax of TE14 when compared to drug suspension.
Figure 7 Dermatokinetic study of TE14 and OLM suspension after topical application.
Abbreviations: OLM, olmesartan medoxomil; TE, transethosome.
Conclusion
In this work, TEs were formulated as transdermal delivery system for OLM. Fifteen formulae were prepared using thin-film hydration technique according to 5Citation1.3Citation1 full factorial design which was used to select the optimum formula (TE14) that displayed spherical morphology, reasonable drug EE%, small PS, and high OLM release. Moreover, TE14 was subjected to DSC studies which confirmed the entrapment of OLM within the transethosomal structure. The elasticity measurement and evaluation of ex vivo skin permeation using both rat and shed snake skin confirmed the superiority of TE14 over TFs due to the presence of both SAA and ethanol. CLSM further confirmed the potential of TEs to overcome the SC and penetrate deeply within the skin layers. Further, the in vivo histopathological study confirmed the non-irritancy of TE14 when applied on rat skin. Additionally, TE14 showed superiority over market tablet in pharmacodynamic study and was able to maintain BP at normal values for 24 hours. Moreover, dermatokinetic study showed significantly higher Cmax and AUC0–10 for TE14 when compared to drug suspension due to higher retention capacity of vesicles in rat skin. Taken together, the results confirmed that TEs could be considered as promising transdermal delivery system for OLM as they can avoid extensive first-pass metabolism of OLM. Further studies are needed to establish the therapeutic activity of TE14 in humans.
Disclosure
The authors report no conflicts of interest in this work.
References
- ChenMLiuXFahrASkin penetration and deposition of carboxyfluorescein and temoporfin from different lipid vesicular systems: in vitro study with finite and infinite dosage applicationInt J Pharm20114081–222323421316430
- SivaramanABangaAKNovel in situ forming hydrogel microneedles for transdermal drug deliveryDrug Deliv Transl Res201771162627562294
- KnudsenNina ØRønholtSSalteRDCalcipotriol delivery into the skin with pegylated liposomesEur J Pharm Biopharm201281353253922538098
- AlsofanyJMHamzaMYAbdelbaryAAFabrication of nanosuspension directly loaded fast-dissolving films for enhanced oral bioavailability of olmesartan medoxomil: in vitro characterization and pharmacokinetic evaluation in healthy human volunteersAAPS PharmSciTech20181952118213229700766
- AshtikarMNagarsekarKFahrATransdermal delivery from liposomal formulations – Evolution of the technology over the last three decadesJ Control Release201624212614027620074
- CevcGSchätzleinARichardsenHUltradeformable lipid vesicles can penetrate the skin and other semi-permeable barriers unfragmented. Evidence from double label CLSM experiments and direct size measurementsBiochimica et Biophysica Acta (BBA) – Biomembranes200215641213012100992
- Al ShuwailiAHRasoolBKAAbdulrasoolAAOptimization of elastic Transfersomes formulations for transdermal delivery of pentoxifyllineEur J Pharm Biopharm201610210111426925505
- TouitouEGodinBDayanNWeissCPiliponskyALevi-SchafferFIntracellular delivery mediated by an ethosomal carrierBiomaterials200122223053305911575480
- MaheshwariRGSTekadeRKSharmaPAEthosomes and ultradeformable liposomes for transdermal delivery of clotrimazole: a comparative assessmentSaudi Pharm J201220216117023960788
- GargVSinghHBhatiaASystematic development of Transethosomal gel system of piroxicam: formulation optimization, in vitro evaluation, and ex vivo assessmentAAPS PharmSciTech2017181587126868380
- KumarAPathakKBaliVUltra-adaptable nanovesicular systems: a carrier for systemic delivery of therapeutic agentsDrug Discov Today20121721–221233124122766375
- KamranMAhadAAqilMImamSSSultanaYAliADesign, formulation and optimization of novel soft nano-carriers for transdermal olmesartan medoxomil delivery: In vitro characterization and in vivo pharmacokinetic assessmentInt J Pharm20165051–214715827005906
- HathoutRMElshafeeyAHDevelopment and characterization of colloidal soft nano-carriers for transdermal delivery and bioavailability enhancement of an angiotensin II receptor blockerEur J Pharm Biopharm201282223024022820090
- RefaiHHassanDAbdelmonemRDevelopment and characterization of polymer-coated liposomes for vaginal delivery of sildenafil citrateDrug Deliv201724127828828165805
- VaronaSMartínACoceroMJLiposomal incorporation of lavandin essential oil by a thin-film hydration method and by particles from gas-saturated solutionsInd Eng Chem Res201150420882097
- DimitrovDLiJAngelovaMJainRSurface effects in preparation of cell-size liposomesFEBS Letters19841762398400
- AbdellatifMMKhalilIAKhalilMAFSertaconazole nitrate loaded nanovesicular systems for targeting skin fungal infection: In-vitro, ex-vivo and in-vivo evaluationInt J Pharm20175271–211128522423
- AbdelbaryAAl-MahallawiAAbdelrahimMAliAPreparation, optimization, and in vitro simulated inhalation delivery of carvedilol nanoparticles loaded on a coarse carrier intended for pulmonary administrationInt J Nanomedicine2015106339635326491298
- SafwatSIshakRAHHathoutRMMortadaNDNanostructured lipid carriers loaded with simvastatin: effect of PEG/glycerides on characterization, stability, cellular uptake efficiency and in vitro cytotoxicityDrug Dev Ind Pharm20174371112112528276784
- ZebAQureshiOSKimHSChaJHKimJKImproved skin permeation of methotrexate via nanosized ultradeformable liposomesInt J Nanomedicine2016113813382427540293
- Al-MahallawiAMKhowessahOMShoukriRANanotransfersomal ciprofloxacin loaded vesicles for non-invasive trans-tympanic ototopical delivery: in-vitro optimization, ex-vivo permeation studies, and in-vivo assessmentInt J Pharm20144721–230431424971692
- El ZaafaranyGMAwadGASHolayelSMMortadaNDRole of edge activators and surface charge in developing ultradeformable vesicles with enhanced skin deliveryInt J Pharm20103971–216417220599487
- KassemAAAbd El-AlimSHAsfourMHEnhancement of 8-methoxypsoralen topical delivery via nanosized niosomal vesicles: Formulation development, in vitro and in vivo evaluation of skin depositionInt J Pharm20175171–225626827956194
- AzizDEAbdelbaryAAElassasyAIInvestigating superiority of novel bilosomes over niosomes in the transdermal delivery of diacerein: in vitro characterization, ex vivo permeation and in vivo skin deposition studyJ Liposome Res2019291738529355060
- AbdelbaryAAAboughalyMHHDesign and optimization of topical methotrexate loaded niosomes for enhanced management of psoriasis: application of Box-Behnken design, in-vitro evaluation and in-vivo skin deposition studyInt J Pharm20154851–223524325773359
- Al-MahallawiAMAbdelbaryAAAburahmaMHInvestigating the potential of employing bilosomes as a novel vesicular carrier for transdermal delivery of tenoxicamInt J Pharm20154851–232934025796122
- TurnerPVBrabbTPekowCVasbinderMAAdministration of substances to laboratory animals: routes of administration and factors to considerJ Am Assoc Lab Anim Sci201150560061322330705
- AhadAAqilMKohliKSultanaYMujeebMAliAFormulation and optimization of nanotransfersomes using experimental design technique for accentuated transdermal delivery of valsartanNanomedicine20128223724921704600
- AlexanderDLJTropshaAWinklerDABeware of R(2): Simple, unambiguous assessment of the prediction accuracy of QSAR and QSPR modelsJ Chem Inf Model20155571316132226099013
- MendesACGorzelannyCHalterNSchneiderSWChronakisISHybrid electrospun chitosan-phospholipids nanofibers for transdermal drug deliveryInt J Pharm20165101485627286632
- AboudHMAliAAEl-MenshaweSFElbaryAANanotransfersomes of carvedilol for intranasal delivery: formulation, characterization and in vivo evaluationDrug Deliv20162372471248125715807
- KuniedaHOhyamaK-IchiThree-phase behavior and HLB numbers of bile salts and lecithin in a water-oil systemJ Colloid Interface Sci19901362432439
- BADNVeerabrahmaKDevelopment of olmesartan medoxomil lipid-based nanoparticles and nanosuspension: preparation, characterization and comparative pharmacokinetic evaluationArtif Cells Nanomed Biotechnol201846112613728290712
- JunyaprasertVBSinghsaPSuksiriworapongJChantasartDPhysicochemical properties and skin permeation of span 60/Tween 60 niosomes of ellagic acidInt J Pharm2012423230331122155414
- El-SayKMAbd-AllahFILilaAEHassanAE-SAKassemAEADiacerein niosomal gel for topical delivery: development, in vitro and in vivo assessmentJ Liposome Res2016261576825853339
- MokhtarMSammourOAHammadMAMegrabNAEffect of some formulation parameters on flurbiprofen encapsulation and release rates of niosomes prepared from proniosomesInt J Pharm20083611–210411118577437
- BnyanRKhanIEhtezaziTSurfactant effects on lipid-based vesicles propertiesJ Pharm Sci201810751237124629336980
- EzzatSMSalamaMMElmeshadANTeaimaMHRashadLAHPLC-DAD-MS/MS profiling of standardized rosemary extract and enhancement of its anti-wrinkle activity by encapsulation in elastic nanovesiclesArch Pharm Res201639791292527107862
- SinghBMehtaGKumarRBhatiaAAhujaNKatareOPDesign, development and optimization of nimesulide-loaded liposomal systems for topical applicationCurr Drug Deliv20052214315316305415
- DasSNgWKTanRBAre nanostructured lipid carriers (NLCs) better than solid lipid nanoparticles (SLNs): development, characterizations and comparative evaluations of clotrimazole-loaded SLNs and NLCs?Eur J Pharm Sci201247113915122664358
- YeoLOlusanyaTChawCElkordyABrief effect of a small hydrophobic drug (cinnarizine) on the physicochemical characterisation of Niosomes produced by thin-film hydration and microfluidic methodsPharmaceutics2018104185
- AkhterSKushwahaSWarsiMHDevelopment and evaluation of nanosized niosomal dispersion for oral delivery of ganciclovirDrug Dev Ind Pharm2012381849221726136
- ChenYQiaoFFanYHanYWangYInteractions of Cationic/ Anionic mixed surfactant aggregates with phospholipid vesicles and their skin penetration abilityLangmuir201733112760276928013540
- HathoutRMMansourSMortadaNDGuinediASLiposomes as an ocular delivery system for acetazolamide: in vitro and in vivo studiesAAPS PharmSciTech200781E1E12
- SalamaAHAburahmaMHUfasomes nano-vesicles-based lyophilized platforms for intranasal delivery of cinnarizine: preparation, optimization, ex-vivo histopathological safety assessment and mucosal confocal imagingPharm Dev Technol201621670671525996631
- KhalilRMAbdelbaryGABashaMAwadGEAEl-HashemyHAEnhancement of lomefloxacin Hcl ocular efficacy via niosomal encapsulation: in vitro characterization and in vivo evaluationJ Liposome Res201727431232327241274
- KimJYSongMGKimJDZeta Potential of Nanobubbles Generated by Ultrasonication in Aqueous Alkyl Polyglycoside SolutionsJ Colloid Interface Sci2000223228529110700413
- IbrahimNRamanIAYusopMREffects of functional group of non-ionic surfactants on the stability of emulsionMJAS2015191261267
- NagaichUGulatiNNanostructured lipid carriers (NLC) based controlled release topical gel of clobetasol propionate: design and in vivo characterizationDrug Deliv Transl Res20166328929827072979
- Garcia-ManyesSOncinsGSanzFEffect of pH and ionic strength on phospholipid nanomechanics and on deposition process onto hydrophilic surfaces measured by AFMElectrochimica Acta2006512450295036
- PapahadjopoulosDMillerNPhospholipid model membranes. I. Structural characteristics of hydrated liquid crystalsBiochim Biophys Acta196713546246384167394
- EgawaHFurusawaKLiposome adhesion on mica surface studied by atomic force microscopyLangmuir199915516601666
- MakinoKYamadaTKimuraMOkaTOhshimaHKondoTTemperature- and ionic strength-induced conformational changes in the lipid head group region of liposomes as suggested by zeta potential dataBiophys Chem19914121751831773010
- JainSJainPUmamaheshwariRBJainNKTransfersomes – a novel vesicular carrier for enhanced transdermal delivery: development, characterization, and performance evaluationDrug Dev Ind Pharm20032991013102614606665
- KriwetKMüller-GoymannCCDiclofenac release from phospholipid drug systems and permeation through excised human stratum corneumInt J Pharm19951252231242
- HinzeWLPramauroEA critical review of Surfactant-Mediated phase separations (cloud-point extractions): theory and applicationsCrit Rev Anal Chem1993242133177
- Villasmil-SánchezSRabascoAMGonzález-RodríguezMLThermal and 31P-NMR studies to elucidate sumatriptan succinate entrapment behavior in phosphatidylcholine/cholesterol liposomes. Comparative 31P-NMR analysis on negatively and positively-charged liposomesColloids Surf B Biointerfaces2013105142323352939
- SuzukiHOgawaMHironakaKItoKSunadaHA nifedipine coground mixture with sodium deoxycholate. II. Dissolution characteristics and stabilityDrug Dev Ind Pharm200127995195811763473
- ElsayedIAbdelbaryAAElshafeeyAHNanosizing of a poorly soluble drug: technique optimization, factorial analysis, and pharmacokinetic study in healthy human volunteersInt J Nanomedicine201492943295324971006
- El-SayedMMHusseinAKSarhanHAMansourHFFlurbiprofen-loaded niosomes-in-gel system improves the ocular bioavailability of flurbiprofen in the aqueous humorDrug Dev Ind Pharm201743690291027977311
- HaradaKMurakamiTKawasakiEHigashiYYamamotoSYataNIn-vitro permeability to salicylic acid of human, rodent, and shed snake skinJ Pharm Pharmacol19934554144188099958
- PripremAKhamlertCPongjanyakTRadapongSRittirodTChitropasPComparative permeation studies between scale region of shed snake skin and human skin in vitroAm J Agric Biol Sci200831444450
- KimMKLeeCHKimDDSkin permeation of testosterone and its ester derivatives in ratsJ Pharm Pharmacol200052436937510813545
- NgawhirunpatTOpanasopitPRojanarataTPanomsukSChanchomeLEvaluation of simultaneous permeation and metabolism of methyl nicotinate in human, snake, and shed snake skinPharm Dev Technol2008131758318300102
- TodoHTransdermal permeation of drugs in various animal speciesPharmaceutics20179333
- ShammaRNAburahmaMHFollicular delivery of spironolactone via nanostructured lipid carriers for management of alopeciaInt J Nanomedicine201495449546025473283
- PriyankaKSinghSA review on skin targeted delivery of bioactives as ultradeformable vesicles: overcoming the penetration problemCurr Drug Targets201415218419824410447
- MoolakkadathTAqilMAhadADevelopment of transethosomes formulation for dermal fisetin delivery: Box-Behnken design, optimization, in vitro skin penetration, vesicles-skin interaction and dermatokinetic studiesArtif Cells Nanomed Biotechnol201846Suppl 275576529730964