Liu Z, Zhang J, Tian Y, Zhang L, Han X, Wang Q, Cheng W. Int J Nanomedicine. 2018;13:7859–7872.
Page 7864, , the incorrect image has been used, the correct figure is shown below.
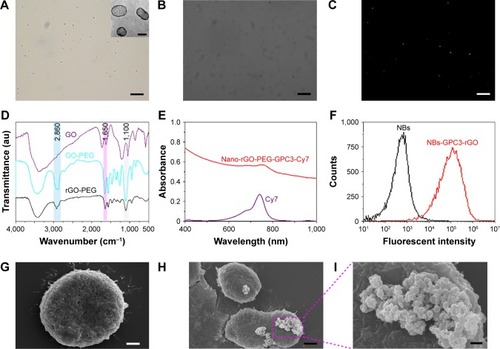
Figure 2 Characterization of nanobubbles, proof the chains are convelent together.
Notes: Bar in A–C is 10 μm, inset in , bar=100 nm, bar in G and H=4 μm, bar in I=0.6 μm. (A) Nanobubbles (NBs) in suspension were milk white in color. Pure NB solution was observed under a light microscope (magnification, 1,000×). (B) Avidinylated nanobubbles were observed under a light microscope (magnification, 1,000×). (C) Nanobubbles conjugated with FITC-labeled avidin under fluorescence microscopy (magnification, 1,000×). The surface of nanobubbles appeared green under fluorescence microscopy, indicating that FITC-labeled avidin was packaged on the NB surface. (D) Fourier transform infrared (FTIR) spectra of graphene oxide-polyethylene glycol (GO-PEG) and reduced graphene oxide (rGO)-PEG. The GO-PEG and rGO-PEG sample was filtered over three times through a 100 kDa molecular weight cutoff (MWCO) filter to completely remove any unconjugated PEG (10 kDa). (E) AUV-vis-near-infrared (NIR) spectrum of nano-rGO-PEG-GPC3-cy7 and free cy7 dye solution. (F) Binding efficiency of biotinylated FITC-labeled rGO-PEG-GPC3 with avidinylated NBs was determined by flow cytometry. Comparison of the fluorescence intensities for NBs (black line, control) and FITC-labeled NBs-GPC3-rGO (red line) implies successful binding of rGO-PEG-GPC3 with avidinylated NBs. (G) Scanning electron microscopy revealed normal surface morphology of the Hep G2 cells (4,000×). Under scanning electron microscopy, targeted NBs-GPC3-rGO were clustered on the surface of the Hep G2 cells (H and I, 4,000× and 10,000×, respectively).
Abbreviation: GPC3, heparin sulfate proteoglycan glypican-3.