Abstract
The objective of this study was to investigate the pharmacokinetics of the ligustrazine ethosome patch and antimyocardial ischemia and anti-ischemic reperfusion injury effect. Male Sprague Dawley rats were divided randomly into 3 groups: Group A (intragastric ligustrazine), Group B (transdermal ligustrazine ethosome patch), and Group C (conventional transdermal ligustrazine patch). After treatment, samples of blood and of various tissues such as heart, liver, spleen, lung, kidney, brain, and muscle samples were taken at different time points. Drug concentration was measured with HPLC, and the drug concentration–time curve was plotted. Pharmacokinetic software 3p97 was applied to calculate pharmacokinetic parameters and the area under the drug concentration–time curve (AUC) in various tissues. The rat model of acute myocardial ischemia was constructed with intravenous injection of pituitrin and the model of myocardial ischemia-perfusion injury was constructed by tying off the left anterior descending coronary artery of rats to observe the effect of ligustrazine ethosome patches on ischemic myocardium and ischemia-reperfusion injury. Results showed that AUC was highest in the transdermal drug delivery group of ligustrazine ethosome patch. There were significant differences in whole blood viscosity, plasma viscosity, hematocrit, red blood cell aggregation index, and deformation index between ligustrazine the ethosome patch group and ischemic control group (P < 0.01). Moreover, ligustrazine ethosome patches could reduce the scope of myocardial infarction induced by long-term ischemia. Ligustrazine ethosome patches have a sustained-release property. They can maintain stable and sustained blood drug concentration, increase bioavailability, and reduce administration times. The drug patch can decrease hemorheological indices of myocardial ischemia in rats, as well as protect acute ischemic myocardium and ischemia-reperfusion injured myocardium.
Introduction
Ligustrazine (4-methyl-pyrazine [tetramethylpyrazine]) is a traditional Chinese medicine for angina pectoris. Ligustrazine plays a role in expanding blood vessels, increasing coronary and cerebral blood flow, preventing platelet aggregation, inhibiting thrombosis, and improving the microcirculation.Citation1
Ligustrazine can be absorbed rapidly through the gastric wall with a quite short plasma elimination half-life. However, it has a long retention time in blood-rich tissue, especially the liver. It also experiences enterohepatic circulation and is partially reabsorbed into the liver after excretion into the intestinal tract. Repeated circulation increases the contact time between the drug and the intestinal tract as well as the liver. Therefore, first pass effect is more evident when ligustrazine is taken orally. Several ligustrazine preparations via transdermal administration have been reported to improve its bioavailability and safety.Citation2–Citation5 We found that prepared ligustrazine ethosome patches could improve drug absorption and bioavailability.Citation2 Ethosome contains a high concentration of alcohol (20%–45%) which promotes drug penetration through the skin, increases the accumulation of the drug in the skin, and carries the drug further into the cells. Therefore, it has become a focus of interest for transdermal delivery.Citation6,Citation7 The process of the drug’s absorption from patches is more complicated than with traditional preparations and involves multiple factors such as individual physical changes, cutaneous pathological changes, environment (eg, temperature, humidity, permeability). and effective application area, which may affect the drug’s effects in the body. A study of the drug’s pharmacokinetics (PK) is necessary for evaluation and improvement of drug quality. In this study, the drug concentration of ligustrazine ethosome was measured at different time points in various tissues after administration of patches to investigate its PK and distribution in rats. Moreover, studies have shown that the positive effect of ligustrazine on coronary tissue is mainly attributed to its pathological activities, such as inhibiting fibrotic myocardial ischemia-reperfusion injury, depressing platelet aggregation, preventing pulmonary hypertension, improving blood rheology, regulating lipid metabolism, increasing the activity of endogenous superoxide dismutase, removing oxygen free radicals, and resisting lipid peroxidation.Citation8 In this experiment, the protective effects of ligustrazine ethosome patches on ischemic myocardium and ischemia-perfusion injury were observed.
Materials and instruments
High-performance liquid chromatography (HPLC) (ZorbaxSB-C18 column, 150 mm × 4.6 mm, 5.0 μm) was obtained from Dionex Co (Chelmsford, MA). The Sigma 3K30 type high-speed refrigerated centrifuge was obtained from Sigma Co (Munich, Germany). The Pclab system of collecting and processing biological signals was obtained from Beijing Microsignalstar Technology Development Co Ltd (Beijing, China). An animal respirator was obtained from Zhejiang University Medical Instrument Co Ltd (Zhejiang, China). Ligustrazine reference substance was obtained from the National Institute for the Control of Pharmaceutical and Biological Products (Beijing, China). Ligustrazine drug substance was obtained from Huapeng Natural Plant Development Co Ltd (Shanxi, China). The ligustrazine ethosome patch was self-made. Nitroderm (25 mg per tablet) was obtained from Novartis Co. (Basel, Switzerland). Triphenyltetrazolium chloride (TTC) was obtained from Sigma-Aldrich (St Louis, MO). Other reagents were of analytical pure grade. Male Sprague Dawley rats weighing 250–300 g were obtained from the Experimental Animal Center of Xiangya School of Medicine (Hunan, China).
Methods
Preparation of rat plasma and tissue samples
A total of 81 normal male Sprague Dawley (SD) rats weighing 250–300 g was divided randomly into three groups: intragastric administration of ligustrazine (Group A, 27 rats), transdermal drug delivery of ligustrazine ethosome patch (Group B, 27 rats), and transdermal drug delivery of conventional ligustrazine patch (Group C, 27 rats). The doses were given as 100 mg · kg−1 of net content of ligustrazine in all the groups. Three rats in each group were killed at 0.1, 0.2, 0.5, 1, 2, 4, 12, and 24 hours after administration. Thereafter 3 mL blood (with heparin) was collected from abdominal aorta, and then heart, liver, spleen, lung, kidney, brain, and muscle were taken out for refrigeration. The whole blood was centrifuged for 15 minutes at 4000 rpm and then the plasma was separated. All the samples were stored at −20°C. The plasma samples were handled according to Liu et al.Citation2 A total of 0.5 g of tissue samples (heart, liver, spleen, lung, kidney, brain, and muscle) were cut into pieces and added with 1 mL of purified water followed by homogenate, they were then centrifuged at 12,000 rpm. The supernatant was taken out into another tube and the volume adjusted to 1 mL with normal saline. Consequent treatment was consistent with the plasma sample.
Measurement of ligustrazine concentration in various tissues and PK parameters
The drug concentration was measured in serum and various tissue samples. The chromatographic conditions were set as follows: ZorbaxSB-C18 column (150 mm × 4.6 mm, 5.0 μm), methanol/water (3:2) as mobile phase, 25°C as column temperature, 295 nm as detection wavelength, 1.0 mL · min−1 as flow rate, and 20 μL as injection volume.Citation2 Drug concentration–time curves were plotted. PK software 3p97 was applied to compute PK parameters and AUC, and plot corresponding AUC histograms.
Ligustrazine ethosome patch for acute ischemic myocardium
An abdominal area of 3 × 3 cm2 of 40 male SD rats was depilated, and samples were then divided randomly into four groups of ten to construct animal models of acute myocardial ischemia with pituitrin (pit) given as intravenous injection.
Ligustrazine ethosome patch group: Ligustrazine ethosome patches were applied daily to the depilated area 3 days prior to the experiment, followed by intraperitoneal injection of pit at a dose of 20 μ/kg for 30 minutes on the fourth day. One hour later, 0.7% of chloral hydrate was given intraperitoneally at a dose of 7.5 mL/kg to anesthetize the rats. Next, the supine rats underwent thoracic surgery to expose the heart. A disposable syringe was inserted at the apex-beat region to take 5 mL of the cardiac blood for hemorheological tests.
Nitroderm transdermal therapeutic system (TTS) group: nitroderm TTS was applied daily on the skin 3 days before the experiment; the remaining procedures were consistent with ligustrazine ethosome patch group. Ischemic control group: blank ethosome patches were applied 3 days before the experiment and pit was injected on the fourth day with the same dose, method and other procedures as nitroderm TTS group. Blank control group: blank ethosome patch was applied 3 days prior to the experiment for 4 days consecutive and other procedures were the same as ligustrazine ethosome patch group except for pit injection.
Ligustrazine ethosome patch for myocardium ischemia-reperfusion injury
Male SD rats were divided randomly into groups D, E, and F.
Group D (single ischemia-reperfusion control group): after 10 minutes postoperative stabilization, 2.5 mL of normal saline was injected followed by perfusion for 24 minutes, ischemia for 20 minutes, and reperfusion for 80 minutes in sequence.
Group E (ischemic preconditioning [IP] group): after 10 minutes postoperative stabilization, 2.5 mL of normal saline was injected followed by ischemic preconditioning (repeated 3 cycles of 3 minutes ischemia followed by 5 minutes reperfusion). Next, 20 minutes ischemia and 80 minutes perfusion were performed.
Group F (ligustrazine ethosome patch group): ligustrazine ethosome patches were applied 3 days prior to the experiment. After 10 minutes postoperative stabilization, 2.5 mL of normal saline was injected followed by 24 minutes perfusion, 20 minutes ischemia, and 80 minutes reperfusion in sequence.
Ligation of coronary artery
Male SD rats were anesthetized by intraperitoneal injection of pentobarbital (45 mg/kg). Then rats were fixed in a supine position for tracheal intubation which was then connected with an animal breathing apparatus to control breathing at a respiratory rate of 55 per minute and tidal volume of 20 mL/kg. Left chest wall was cut to expose the heart. A thread (5–0, medical atraumatic suture) was passed under the left anterior descending branch (LAD) between the left auricle and arterial cone and two ends of the thread passed through a short silicone tube. Ischemia was achieved by ligaturing another short silicone tube and reperfusion by loosening the ligation. Standard limb II lead was used to record electrocardiosignals. The results were analyzed with Pclab Biological Signal Collecting and Processing System. CT segmentation elevation in ECG and the appearance of cyanosis in local myocardium were considered to be successful ischemia and ST segmentation depression and disappearance of cyanosis were taken as the indices of coronary artery revisualization.
IP method
Preconditioning of blocking local coronary artery and stopping perfusion was applied. The process was as follows: ischemia was caused for 3 minutes, reperfused for 5 minutes, and this was repeated three times.
Scoring of arrhythmia
Severity of arrhythmia was quantitatively analyzed using a modified arrhythmic scoring method of Curtis and Walker.Citation9 Its basic principles were: (1) ventricular arrhythmia > atrial arrhythmia; (2) for ventricular arrhythmia, ventricular fibrillation (VF) > ventricular tachycardia (VT) > frequent ventricular premature beat > accidental ventricular premature beat; (3) the longer duration or frequency of arrhythmia, the higher the severity. The scores corresponding to most severe reperfusion arrhythmia in the heart were taken as arrhythmia scores (for details, see ).
Table 1 Scoring system of arrhythmia
Measurement of scope of myocardial infarction
After perfusion, coronary artery LAD was ligated permanently. The heart was immediately taken into normal saline. The residual blood in chambers of heart was cleaned. Trypan blue (0.8 mL) was injected retrogressively through the aorta. Then, the heart was stored at −20°C for 30 minutes to freeze. The ventricle was cut into 8–10 pieces of the same thickness along the direction parallel to the atrioventricular groove from cardiac apex to base. These slices clearly displayed the blue nonischemia area stained by trypan blue and area at risk (AAR) without blue color. These slices were placed into phosphate buffer with 1% TTC (37°C, pH 7.4). Normal myocardium contained dehydrogenase which could reduce colorless oxidative TTC to its red reduced form and stain active myocardium. Myocardial cells in the infarcted zone were unable to release dehydrogenase, and reduce TTC, because of cellular membraneous injury. As a result, the myocardium in infarcted zone appeared white. After immersion in TTC solution for 15 minutes, heart slices clearly displayed red noninfarcted zone and grey infarcted zone. Under the anatomical lens, the blue nonischemic zone, red ischemia noninfarcted zone, and grey infarcted zone were isolated and then weighed. The percentage of myocardium weight of infarcted zone in myocardium weight of risk zone (the gross weight of red and grey myocardium) was taken as a measure of infarction scope.
Statistical analysis
Enumeration data were compared with χ2 or Wilcoxon rank sum test. Measurement data were analyzed by t-test. SPSS software (v. 13.0; SPSS Inc, Chicago, IL) was used for statistical analysis. PK data were analyzed with 3p97 software (Chinese Pharmacological Society, Beijing, China).
Results
Pharmacokinetics of ligustrazine ethosome patch in rats
Drug concentration–time curves in various tissues are shown in –. shows that in Groups A, B, and C, drug concentration in the heart decreased after administration for 2 hours, the smallest decrease being in Group B.
Figure 1 Plasma drug concentration–time curve (Group A: intragastric ligustrazine; Group B: transdermal ligustrazine ethosome patch; Group C: conventional transdermal ligustrazine patch).
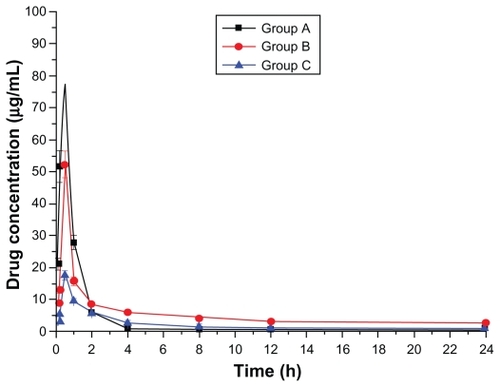
Figure 2 Drug concentration–time curve of the heart (Group A: intragastric ligustrazine; Group B: transdermal ligustrazine ethosome patch; Group C: conventional transdermal ligustrazine patch).
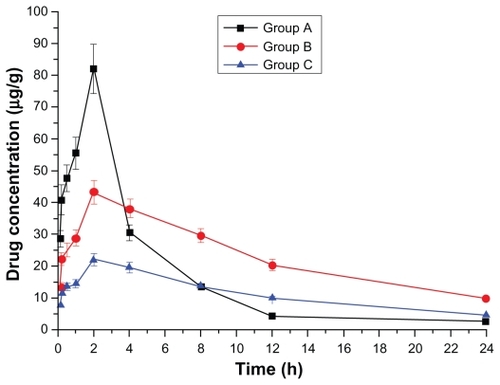
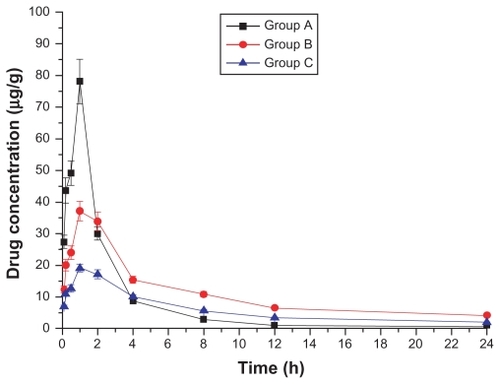
Figure 3 Drug concentration–time curve of the liver (Group A: intragastric ligustrazine; Group B: transdermal ligustrazine ethosome patch; Group C: conventional transdermal ligustrazine patch).

Figure 4 Drug concentration–time curve of the spleen (Group A: intragastric ligustrazine; Group B: transdermal ligustrazine ethosome patch; Group C: conventional transdermal ligustrazine patch).
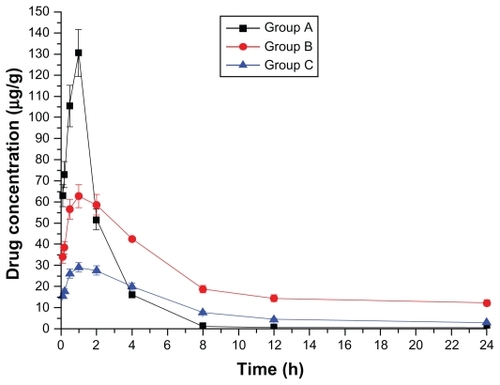
Figure 5 Drug concentration–time curve of the lung (Group A: intragastric ligustrazine; Group B: transdermal ligustrazine ethosome patch; Group C: conventional transdermal ligustrazine patch).
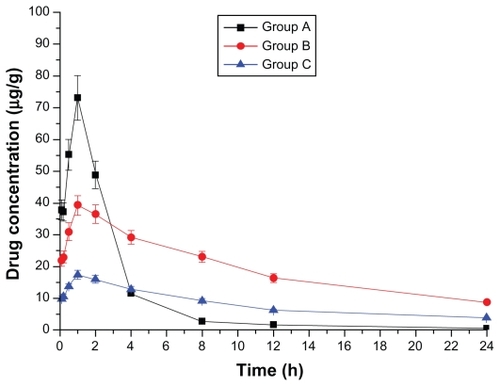
Figure 6 Drug concentration–time curve of the kidney (Group A: intragastric ligustrazine; Group B: transdermal ligustrazine ethosome patch; Group C: conventional transdermal ligustrazine patch).
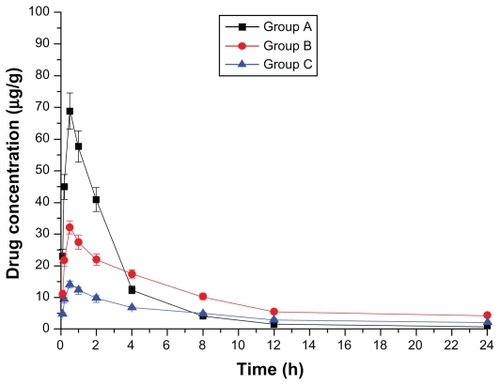
Figure 7 Drug concentration–time curve of the brain (Group A: intragastric ligustrazine; Group B: transdermal ligustrazine ethosome patch; Group C: conventional transdermal ligustrazine patch).
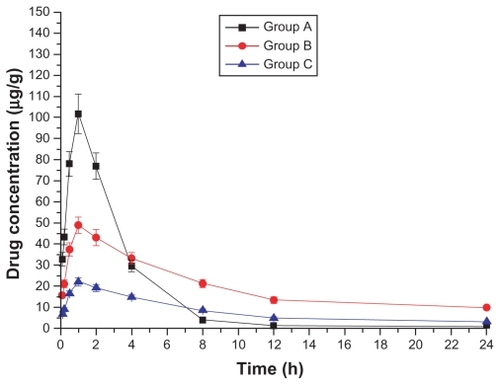
Figure 8 Drug concentration–time curve of the muscle (Group A: intragastric ligustrazine; Group B: transdermal ligustrazine ethosome patch; Group C: conventional transdermal ligustrazine patch).
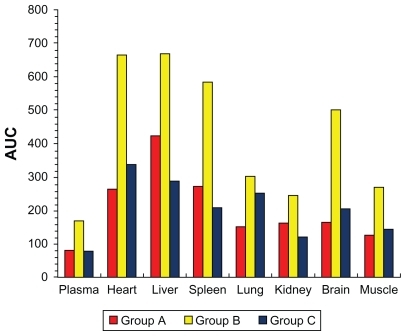
PK parameters are shown in . T1/2β was 1.94 hours in Group A, 18.99 hours in Group B, and 29.89 hours in Group C. Cmax was 67.12 μg · mL−1 in Group A, 21.05 μg · mL−1 in Group B, and 10.58 μg · mL−1 in Group C. As shown in , AUC of all the tissues was lower in Group A than in Group B. The results suggest that transdermal administration of ligustrazine ethosome patches could maintain stable and sustained blood drug concentration, increase bioavailability, reduce application times and strengthen treatment efficacy. The difference between Group A and Group C was not significant. shows that the peak concentration of ligustrazine in plasma, heart, liver, spleen, lung, brain, and muscle was higher in Group A than Groups B and C, suggesting a delayed-release property in Group B and C, which avoided the first pass effect in the liver and degradation in the gastrointestinal tract, and reduced drug toxicity and adverse effects. The penetrating effect of Group B was significantly better compared with Group C.
Table 2 Pharmacokinetics parameters of three groups
Table 3 The peak concentration of ligustrazine in various tissues (μg/mL or μg/g)
Figure 9 Comparison of area under the drug concentration–time curve (AUC) in various tissues of Group A, B, and C (Group A: intragastric ligustrazine; Group B: transdermal ligustrazine ethosome patch; Group C: conventional transdermal ligustrazine patch).
Drug patches for acute ischemic myocardium
The changes in hemorheological indices are shown in . Results show that whole blood viscosity, plasma viscosity, hematocrit, RBC aggregation index, and RBC deformation index increased significantly in the ischemic control group compared with the blank control group (P < 0.01). There were statistically significant differences in whole blood viscosity, plasma viscosity, hematocrit, RBC aggregation index, and RBC deformation index between the nitroderm TTS group and the ischemic control group (P < 0.05). The difference of those parameters between the ligustrazine ethosome group and the ischemic control group was also significant (P < 0.01), showing that hemorheological indices were the highest in the ischemic control group. Results indicate that ligustrazine ethosome patch and nitroderm TTS are both efficacious in decreasing hemorheological indices of myocardial ischemia of rats, the patch group showing the highest efficacy.
Table 4 Hemorheological indices
Ligustrazine ethosome patch for myocardium ischemia-reperfusion injury
Compared with the single ischemia-reperfusion control group, IP prevented the occurrence of reperfusion VF, reduced times of ventricular premature beat during reperfusion, and shortened the duration of VT (P < 0.01) (). The IP group showed significantly lower scores of reperfusion arrhythmia than the control group (P < 0.01) (). IP significantly decreased myocardial infarcted scope induced by long-term ischemia (P < 0.05) (). In comparison with the single ischemia-reperfusion control group, VE did not appear, VT times decreased (not significant P > 0.05), and VT duration did not shorten (not significant P > 0.05) () in the ligustrazine ethosome patch group. No differences in reperfusion arrhythmia scores were noted compared with the control group (P > 0.05) (). Drug patches significantly reduced infarcted myocardium scope induced by long-term ischemia (P < 0.05) ().
Table 5 Effects of ligustrazine and IP on reperfusion arrhythmia in anesthetized rats
Table 6 Effects of ligustrazine and IP on arrhythmia scores and myocardial infarction scope in anesthetized rats
Discussion
In this study, PK and distribution of ligustrazine ethosome patches given transdermally to rats were first investigated. As shown in , compared with orally administered ligustrazine, ligustrazine ethosome patches had a significantly longer elimination half-life and more stable plasma concentrations. Although the elimination half-life of conventional ligustrazine patches was longer than that of ligustrazine ethosome patches, the plasma concentration was lower. AUC represents a curative dose in tissues or organs of the same volume or weight to some extent. In , AUC was in the sequence of liver > spleen > heart > brain > kidney > lung > muscle > plasma in the intragastric administration group of ligustrazine. AUC in the liver was up to 425.0 mg · mL−1 h−1, 5.29 times greater than in plasma, which suggests that ligustrazine may be removed primarily by bioconversion. For the transdermal drug delivery group of ligustrazine ethosome patch, AUC was in the sequence liver > heart > spleen > brain > lung > muscle > kidney > plasma. For the transdermal drug delivery group of conventional ligustrazine patch, AUC was in the sequence liver > heart > spleen > brain > lung > muscle > kidney > plasma. These results indicate that the drug is distributed mainly in the blood-rich organs such as the liver, heart, and spleen. Higher AUC in brain suggests that the drug can enter the central nervous system through the blood–brain barrier. Clinically, it has been verified to have a good efficacy in coronary heart disease.Citation8 Group B showed 2.52 times the heart AUC of Group A and 1.57 times the liver AUC of Group A, suggesting that ligustrazine ethosome exerts a greater effect on the heart, but a weaker toxic effect on the liver. The plasma AUC of Group B was 2.09 times that of Group A, showing that ligustrazine ethosome patches increase bioavailability markedly, which may be attributed to avoidance of oral delivery-inducing first-pass effect in the liver when administered transdermally and consequent increase of drug availability within the body. No significant difference existed between AUC of Groups A and C.
The ligustrazine level in rats depends on both penetrating speed and metabolic speed. When penetration speed exceeds metabolic speed, the drug concentration increases over time. Conversely, it decreases with time when metabolic speed exceeds penetration speed. shows that absorbing speed exceeds metabolic speed 2 hours before transdermal delivery and absorbing speed is less than metabolic speed 2 hours after transdermal delivery. Ligustrazine passes through the skin surface, horny layer, active epidermis, and capillary-rich dermis in turn and finally enters the blood circulation.Citation10 shows that animals’ organs maintain a high drug concentration for a relatively long period. The concentration in the heart was 20.4 μg · mL−1 12 hours after administration. Compared with oral administration, curative concentration was maintained at a constant release rate for a long time. Moreover, the relative bioavailability of ligustrazine ethosome was up to 209.45%, while that of a conventional transdermal patch was only 98.63%, as shown in .
In 1960, Black established the animal model of acute myocardial ischemia successfully using pit,Citation11 which was used widely in studies on myocardial ischemic antagonists.Citation12,Citation13 In this experiment, this model was applied to measure indices of whole blood viscosity, plasma viscosity, hematocrit, RBC aggregation index, and deformation index of rats in each group and clarify the differences among all the groups through hemorheological indices. Studies have shown that ligustrazine has similar pharmacological and electrophysiological effects to those of calcium blockers (for example, see Ma et alCitation14). It can greatly improve hemorheology and reduce blood fat and has excellent efficacy on blood stagnation of coronary heart disease.Citation14 This study confirms that ligustrazine patches can protect the ischemic myocardium arising from coronary arterial spasm. The results indicate that the ischemic control group had higher hemorheological indices than the ligustrazine ethosome patch and nitroderm TTS groups. This illustrates that ligustrazine ethosome patch and nitroderm TTS both show efficacy in decreasing hemorheological indices of myocardial ischemia rats, the the ligustrazine ethosome patch group showing the highest efficacy.
Acute myocardial ischemia-reperfusion can lead to further injury to the ischemic myocardium, manifesting as severe cellular defect, intractable arrhythmia, and evident cardiac dysfunction in the early period of reperfusion. These are the critical causes of acute myocardial ischemia-reperfusion injury, and consequent production of free oxygen radial, intracellular calcium overload, energy consumption, release of norepinephrine, and apoptosis. IP protects myocardium by inhibiting these factors.Citation11,Citation15 In this experiment, IP reduced not only the times and duration of arrhythmia during reperfusion but also the scope of ischemic myocardial infarction. In contrast, ligustrazine significantly improved reperfusion arrhythmia, but greatly reduced the scope of myocardial infarction due to long-term ischemia, illustrating that this patch also has some protection effect on the myocardium injured by ischemia-reperfusion.
Conclusion
The ligustrazine ethosome patch can maintain stable and sustained blood drug concentration, increase bioavailability, and reduce administration times. Whole blood viscosity, plasma viscosity, hematocrit, RBC aggregation index, and deformation index differed significantly between the ligustrazine the ethosome patch and ischemic control groups. Ligustrazine ethosome patches can reduce the scope of myocardial infarction induced by long-term ischemia and have a sustained release property. They can also decrease hemorheological indices of myocardial ischemia in rats, and protect acute ischemic myocardium and ischemia-reperfusion injured myocardium.
Acknowledgment
This work was supported by grants from National Natural Science Foundation of China (No. 30973374; 81071638).
Disclosure
The authors report no conflicts of interest in relation to this work.
References
- DouYZTengHWangQSunYMMaSLPreparation, in vitro release and percutaneous penetration of ligustrazine hydrochloride transdermal delivery systemChin J Pharm20083910745749
- LiuXYLiuHLiuJQPreparation of a ligustrazine ethosome patch and its evaluation in vitro and in vivoInt J Nanomedicine2011624124721499422
- HuangPLiXHZhangHPharmacokinetics and bioequivalence of ligustazine phosphate pills in healthy volunteerChin J Clin Pharmacol2005216445448
- YuYGaoQPharmacokinetics of ligustazineLiaoning J Tradt Chin Med2003308670671
- QiuLWangQZhangJHuoNBStudies on crystallization inhibition and percutaneous pharmacokinetics of ligustrazine in pressure sensitive patchJ Chin Pharm Sci2006412116421646
- ChoiMJMaibachHIElastic vesicles as topical/transdermal drug delivery systemsInt J Cosmetic Sci2005274211221
- GodinBTouitouEEthosomes: new prospects in transdermal deliveryCrit Rev Ther Drug Carrier Syst20032016310212911264
- ZhangGQZhaoJHResearch progress of pharmacological effect of ligustrazine on cardiovascular diseasesChin Modern Med2009164142
- CurtisMJWalkerMJQuantification of arrhythmias using scoring systems: an examination of seven scores in an in vivo model of regional myocardial ischemiaCardiovasc Res19882296563242835
- DouYZTengHWangQSunYMMaSLPreparation, in vitro release and percutaneous penetration of ligustrazine hydrochloride transdermal delivery systemChin J Pharm20083910745749
- BlackJWElectrocardiographic changes produced in rabbits by vasopress-in (pitressin) and their alterations by prolonged treatment with a commercial heart extractPharma Pharmacol19601287
- LiDLLiMZhaiTJEffect of Qixuanyixin capsule on action potential and transient outward potassium channel of ischemic ventricular muscle cell in diabetes ratsTianjin J Trad Chin Med2006234327331
- HanLSHanLiMaYTWangFThe mechanism of protective effects of rotary magnetic field on experimental myocardial ischemia in ratsChin J Phys Med Rehab20032511643645
- MaHRJiaYLongFCThe effect of ligustrazine on coronary heart disease-blood stagnation and hemorheologyChin J Inform Trad Chin Med20018125354
- WuWKHouCLuJFReinvestigation of pituitrin-inducing myocardial ischemic modelChin J Pathophysi199392124127