 ?Mathematical formulae have been encoded as MathML and are displayed in this HTML version using MathJax in order to improve their display. Uncheck the box to turn MathJax off. This feature requires Javascript. Click on a formula to zoom.
Abstract
The group 2 allergen, Der p2, has been reported to activate innate toll-like receptors (TLRs) on respiratory epithelial cells and thus aggravate respiratory diseases. In this study, a highly sensitive nanostructured biosensor based on a 3D sensing element with uniformly deposited gold nanoparticles is proposed for the detection of the dust mite antigen Der p2. The barrier layer comprises an anodic aluminum oxide (AAO) film which is used as the template in this highly sensitive nanostructured biosensor. Simple electrochemical deposition without reducing agent and stabilizer was enough to uniformly synthesize gold nanoparticles on the surface of the barrier layer. The size and the distribution density of the nanoparticles can be well controlled by the applied potential during electrochemical deposition. Following this procedure, the dust mite monoclonal antibodies (IgG) were then immobilized through the 11-MUA (11-mercaptoundecanoic acid), (1-ethyl-3-(3-dimethyl-aminopropyl)-carbodiimide)/(N-hydroxysuccinimide) self-assembled monolayer approach for the dust mite antigen Der p2 detection. The detection limit of the proposed 3D gold nanoparticle-based nanostructured biosensor was examined using electrochemical impedance spectroscopy analysis and found to be 1 pg/mL. The dynamic range was found to be 5 μg/mL. The proposed nanostructured biosensor would be useful for fast detection of rare molecules in a solution.
Introduction
Asthma and allergic rhinitis are the most commonly seen allergic symptoms of the respiratory system. They are caused by chronic or acute inflammation of the mucous membrane of the nose when an airborne allergen is inhaled by a person with a sensitive immune system. The types and concentrations of antigens in the ambient environment are the main factors that determine the symptoms of the allergic response. It is known that house dust mites (HDM) are a common cause of asthma and allergic reactions worldwide. The European house dust mite Dermatophagoides pteronyssinus (Der p) and the American house dust mite Dermatophagoides farinae (Der f) are two major species found in house dust. Allergens and storage mites such as Tyrophagus putrescentiae (Tyr p), Blomia tropicalis (Blo t), and Cheyletus eruditus (Che y e) can also trigger allergic disease responses.Citation1,Citation2 The major targets of the human immune responses to these mites are the group 1 and group 2 allergens. Currently, the group 2 allergen, Der p2, has been reported to activate innate toll-like receptors (TLRs) on respiratory epithelial cells which in turn aggravates respiratory diseases.Citation3
Allergens have been used to treat allergic diseases for more than a century with immunotherapy being the current method used for allergic disease treatment. Since each dust mite has its own unique antigen, a precise detection method is thus highly desired so as to enable efficient treatment. Many feasible detection methods have been developed over the past decade to fulfill the demand for precise and rapid detection.
The biomarker-based sensing method is currently the most commonly used approach for precise detection.Citation4 But because the blood concentration of a specific biomarker for a certain disease is usually relatively low, a highly sensitive biosensor for precise detection is needed. The enzyme-linked immunosorbent assay method (ELISA) is one commonly used sensing technique.Citation5 As well as ELISA, electrochemical analysis, the surface plasmon resonance technique, and piezoelectric frequency sensing are other feasible approaches. Among these, the electrochemical analysis method, with a shorter processing time, has recently attracted increasing attention.
The key issue involved in these biosensing techniques is how to attach as many analytes to the transducer as possible in order to improve sensing quality. Recent advancements in micro/nano technologies have enhanced the attachment operation.Citation6 Bigelow et al initially discovered that molecules in the amino-group could be attached to a platinum substrate. The self-assembled monolayer (SAM) technique can be conducted simply by adding a solution of the desired molecule to the substrate surface and washing away the excess.Citation7 Nuzzo et al found that monolayers of organic disulfides could stably adhere to a gold substrate.Citation8 Rubinstein et al pioneered using the SAM technique to develop a gold electrode biosensor.Citation9 Dubois et al reported that gold has difficulty reacting with other materials due to its low activity.Citation10 Everett et al discovered that the stability of the attachment of the SAMs to a gold electrode could be maintained when the applied electric potential was between +0.8 V and −1.4 V.Citation11 Consequently, gold is commonly used as the transducer for SAM based biosensors. Gold nanoparticles can provide a substantially larger surface area than that of bulk material or thin films, and so has been extraordinarily useful as part of the transducer in SAM based biosensors.
As mentioned above, electrochemical analysis is a promising method for biomarker detection. However, only a very few relevant studies have discussed the detection of trace dust mites using electrochemical analysis. Huang et al used a dust mite antigen Der f2 coated carbon electrode to detect monoclonal antibody solutions with various concentrations.Citation12 The maximum sensitivity of the device was about 10 μg/mL. Later, the same group developed a better device, which was fabricated by electro-deposition of gold nanoparticles onto the carbon electrode as a substrate for the antigen coating.Citation13 Its sensitivity was improved to 2 μg/mL. The same group then proposed a surface plasmon resonance-based approach using the MUA (11-mercaptoundecanoic acid) and EDC (1-ethyl-3-(3-dimethyl-aminopropyl)-carbodiimide)/NHS (N-hydroxysuccinimide) self-assembled monolayer to immobilize the antibody. This greatly increased the sensitivity of Der f2 detection to 15 ng/mL.Citation14 A carbon nanotube electrode array based on the immunosensor was developed to detect mouse IgG by Yun et al.Citation15 The nanotube electrodes were first functionalized with carboxylic groups, followed by the use of EDC with sulfo-NHS to immobilize the antibody in the nanotube array. A dynamic range of up to 100 μg/mL and a detection limit of 200 ng/mL were obtained.
In this current study, a highly sensitive nanostructured biosensor based on a 3D sensing element featuring uniformly deposited gold nanoparticles is proposed for the detection of dust mite antigen Der p2. In this novel nanostructured biosensor, the barrier layer of an anodic aluminum oxide (AAO) film is used as the template.Citation16,Citation17 A reducing agent and stabilizer free method based on the electrochemical deposition technique is used to synthesize uniformly distributed gold nanoparticles on the surface of the barrier layer. The distribution density and size of the nanoparticles can be precisely controlled by the applied potential during electrochemical deposition. The detection of the dust mite antigen Der p2 was carried out using electrochemical impedance spectroscopy (EIS) analysis.Citation18–Citation20
Materials and methods
Sensor fabrication
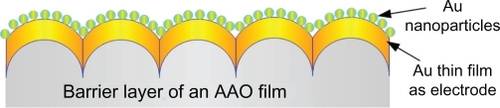
shows a schematic illustration of the proposed gold nanoparticle transducer. The sequential synthesis processes include: preparation of an AAO film; modification of the surface of its barrier layer; deposition of an Au thin film; annealing; and electrochemical deposition of Au nanoparticles. Since the Au thin film for the electrode is shaped by the structure of the surface of the barrier layer, the procedures involving the modification of the barrier layer surface are crucial.
Figure 1 Schematic drawing of the proposed reductant and stabilizer free approach for gold nanoparticle synthesis.
Abbreviation: AAO, anodic aluminum oxide.
The fabrication of the proposed 3-D nanostructured biosensor includes: AAO film preparation, barrier layer surface modification, Au thin film deposition, electrode annealing, device packing, and Au nanoparticle deposition. The fabrication process is discussed in detail below.
AAO film preparation
The AAO films were prepared using the well-known anodizing process. Aluminum foils were cleansed and electropolished before anodization. AAO films, with a nanopore diameter of around 60 nm and a thickness of 50 μm, were obtained by anodizing polished aluminum foil in a 0.3 M phosphoric acid solution under an applied voltage of 90 V at 0°C for 2 hours. The remaining aluminum beneath the barrier layer was then dissolved in an aqueous CuCl2-HCl solution, which was prepared by dissolving 13.45 g of powdered CuCl2 into 100 mL of a 35 wt% hydrochloric acid solution. After the remaining aluminum beneath the barrier layer was removed, a honey comb-like barrier layer surface was obtained.
Modification of the barrier layer surface
The honey combs had an average convex diameter of 80 nm. Following the first step, the barrier layer surface was immersed in a 30 wt% phosphoric acid for 40 minutes to modify the surface structure.
Deposition of an Au thin film
The modified barrier layer surface was then used as the template for depositing the 3D nanostructure Au film through radio frequency magnetron sputtering. The experimental conditions during deposition were: pressure = 4.0 × 10⁻³ torr; temperature = room temperature; argon = 20 sccm; power = 80 W; processing time = 2 minutes. A 3D nanostructure Au film with a thickness of 30 nm was obtained.
Annealing
To further refine the surface structures of the 3D nanostructure of the Au film and make it homogeneous, an additional annealing process was utilized. The annealing procedures included: heating the sample to 120°C at a rate of 20°C/sec and maintaining that temperature for 40 minutes; then cooling the sample in the open air to room temperature.
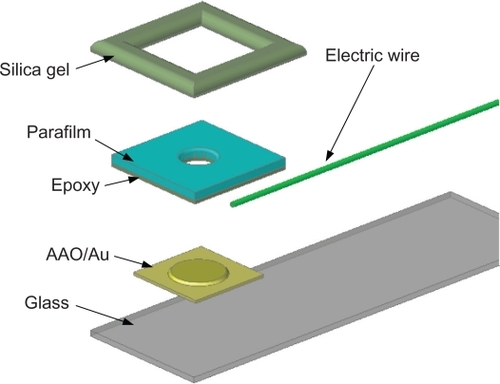
Packaging
Precise packaging before the electrochemical deposition of Au nanoparticles can not only ensure the uniformity of the sensing area in each biosensor but also prevent other solutions from coming into contact with the sample. The packaging procedures are schematically illustrated in and itemized as follows:
Cut the parafilm into 2.5 × 2.5 cm2 squares.
Punch a ϕ = 6 mm hole in the center of the square of parafilm.
Smear a thin layer of epoxy on the bottom surface of the parafilm square, followed by bonding of the parafilm to the Au film deposited 3D nanostructure, to confine the sensing area of the device.
Carefully package the device using silica gel to ensure air tightness.
Figure 2 Packaging of the device.
Abbreviation: AAO, anodic aluminum oxide.
Electrochemical deposition of Au nanoparticles
A picoammeter (Sversa Stat II, Princeton Applied Research) was used to conduct the electrochemical deposition. The packaged sample was placed at the working electrode, with the Au thin film acting as the electrode. The counter electrode comprised a Pt film, while the reference electrode was Ag/AgCl. The deposition processes included:
Electrolyte preparation:
The electrolyte was prepared by dissolving 1 mL of 0.02 M HAuCl4 (Sigma-Aldrich, St Louis, MO) solution in 39 mL of deionized water.
Reducing potential measurement:
The cyclic voltammetric method was implemented using an electrochemical analyzer (Model 627C, CH Instruments) to measure the reducing potential of the electrolyte HAuCl4 solution. The scanning range was from +0.8 V to −0.8V. It was determined that −0.8 V was a feasible solution used in this reducing potential for the HAuCl4 study.
Electrochemical deposition:
A DC −0.8V electric potential was applied for 100 seconds at room temperature to conduct the process of electrochemical deposition.
Electrochemical characterizationCitation21
Cyclic voltammetry (CV) were performed using an electrochemical analyzer (CHI 627C, CH Instruments, Austin, TX). A Pt wire and an Ag/AgCl electrode were used as counter and reference electrodes, respectively. The active surface area was determined by steady-state voltammetry in a solution of 20 mM K4Fe(CN)Citation6 with 0.1 M KCl as the supporting electrolyte.
The cyclic voltammogram trace can be used to estimate the real area of a sensing device which is effective for the adhesion of the analytes according to the Randles-Sevcik equation as shown in Equationequation (1)(1) .
Sample preparation
The detection of the dust mite allergen Der p2 was carried out in order to examine the sensitivity of the proposed 3D gold-nanoparticle based nanostructured biosensor. The Der p2 used was prepared according to the procedures reported by Tsai et al.Citation22 The procedures for the immobilization of Der p2 on the sensor chip are described below.
The surface of the sensor chip was cleaned by soaking it in ethanol, acetone, and deionized water in turn, and then shaking by ultrasonic waves for 5 minutes. The sensor chip was then dispensed along with 50 μL of a 5 mM 11-MUA solution to form a self-assembled monolayer of 11-MUA as an anchor membrane. The carboxylic groups of the 11-MUA layer on the sensor chip were activated by exposing the sensor chip in a 50 μL mixed EDC/NHS solution (molar ratio, 1:2) for 50 minutes. After 2 washings with the PBS buffer solution, the sensor chip was rinsed with a 50 μL (10 μg/mL) dust mite monoclonal antibodies (IgG) solution and then incubated for 1 hour. The IgG used was purchased from the Bethyl Laboratories, Inc. (Texas, USA). The NH2+ group of each IgG replaced the NHS functional group and chemically bonded with the COOH− group of the MUA. The sample was then washed twice with a PBS buffer solution (pH 7.4). For those IgGs which did not bond with the MUA, a 50 μL 1% BSA solution was used as the blocking layer to block their binding sites to ensure binding uniqueness. Finally the sensing samples were prepared by immersing the sensor chips in dust mite allergen Der p2 solutions with different concentrations (1 μg/mL, 10 ng/mL, 1 ng/mL, 0.1 ng/mL, 0.01 ng/mL, 1 pg/mL, and 0.5 pg/mL) at a temperature of 4°C for 1 hour.
EIS analysis
The methodology for EIS is implemented in electrochemistry based on information regarding the interface. The impedance parameters of the system can be estimated by applying a periodic small amplitude AC signal to the interface and measuring the actual system response. EIS analysis was implemented to detect the Der p2 concentration in different solutions.
The working electrode, counter electrode, and reference electrode of the EIS comprised the AAO/Au/gold nanoparticles (GNP) device, Pt, and Ag/AgCl, respectively. The buffer solution was a mixture of 5 mM Fe(CN)64− and 5 mM Fe(CN)63− in 100 mM 2-(N-morpholino) ethanesulfonic acid (pH = 6.0). The DC power and AC power were 0 V and 5 mV, respectively. The AC frequency ranged from 0.1 to 100 kHz.
Fluorescence analysis
The total amount of Der p2 that can adhere to a sensor determines its sensitivity. Fluorescence analysis was conducted to compare the Der p2 adhesive abilities between the proposed AAO/Au/GNP device and a flat Au film. Der p2-EGFP (enhanced green fluorescent protein) molecules were used to replace the Der p2 molecules, so that the amount of attached Der p2 on IgG could be illustrated using confocal microscopy. The Pichia Expression Kit (invitrogen, CA, USA) was used to prepare the Der p2-EGFP solution. A confocal microscope (Olympus FV1000) with laser light ranging from 350 nm to 400 nm was implemented to analyze the adhesive abilities.
Results and discussion
Device fabrication results
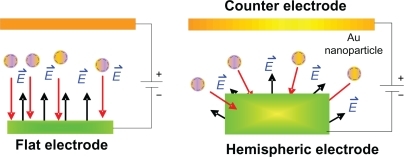
shows an SEM image and the energy dispersive X-ray analysis of the electrochemical deposition of gold nanoparticles. The gold nanoparticles deposited on the orderly hemispheric electrode array had an average diameter of about 10 nm and were uniformly and compactly deposited. However, when a flat electrode was used with a sodium citrate solution as the stabilizer their distribution was disorderly. The uniformly propagated electric flux (E⃑) perpendicular to the hemispheric Au thin film electrode pulls the positive charges carrying Au nanoparticles in the electrolyte (). This means that they can be densely deposited onto the surface of the Au thin film electrode without the necessity of any reducing agent or stabilizer.
Figure 3 SEM images of gold nanoparticles synthesized by electrochemical deposition for the: (A) 3D electrode; (B) energy dispersive X-ray analysis.
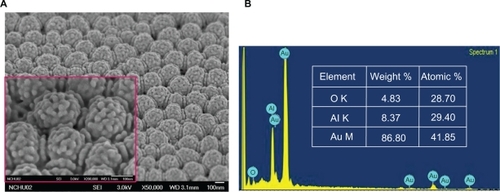
Figure 4 Comparison of electric flux propagation.
Since the morphology of the deposited gold nanoparticles is a function of the electric flux density, which is determined by the applied potential, it is worth investigating the dependencies of the deposition morphology on the applied potential. Deposition experiments with applied potentials ranging from −0.4 V to −0.7 V were conducted. We observed that a higher applied potential resulted in gold nanoparticles with a larger diameter. We also found that the amount of gold nanoparticles deposited on each hemispheric electrode reached a peak value when the potential was −0.7 V, and afterwards decreased due to the aggregation of nanoparticles. The morphology experiments demonstrated that the deposition density and particle size could be controlled by the applied potential.
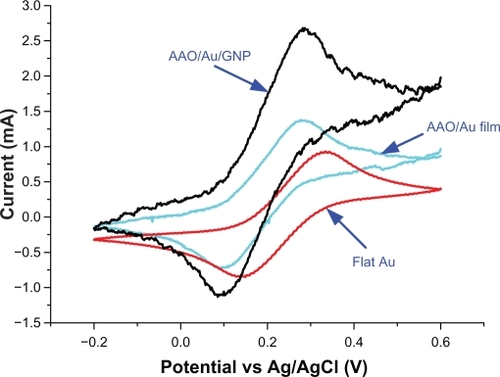
Electrochemical characterization results
represents steady-state CVs for the 3 different electrodes in 20 mM Fe(CN)64− and 0.1 M KCl at 100 mV/s vs Ag/AgCl reference electrode. The effective electrode area of the AAO/Au film electrode was calculated to be about 1.9-fold of the Flat Au electrode, while the effective electrode area of the AAO/Au/GNP electrode was estimated to be 2.2-fold of the AAO/Au film electrode. The total enlargement of the effective electrode area between an AAO/Au/GNP electrode and a flat Au electrode was about 4.18-fold.
Figure 5 Estimation of electroactive surface area by cyclic voltametry in 5 mM Fe(CN)64− and 0.1 M KCl at 100 mV s−1 vs Ag/AgCl reference electrode.
Electrochemical impedance spectroscopy analysis results
shows the EIS analysis results (using a Biologic, SP-150). shows the impedance plots for a bare electrode after the MUA was immobilized, an electrode after the NHS-EDC was further bound to the immobilized MUA, an electrode after the anti-dust mite monoclonal IgG was bound to the NHS-EDC, and electrodes after the Der p2 (with various concentrations) were immobilized at the anti-dust mite monoclonal IgG. We observed that the diameters of the individual semicircles increased with an increase in the Der p2 concentration. In other words, the impedance of the Der p2 binding device increased with an increase in the Der p2 concentration. The EIS analysis results can be modeled by Randles’s equivalent circuit as shown in the inset to .
Figure 6 Electrochemical impedance spectroscopy analysis results: (A) Impedance plots for Der p2 with various concentrations, (a) mercaptoundecanoic acid, (b) (1-ethyl-3-(3-dimethyl-aminopropyl)-carbodiimide)/(N-hydroxysuccinimide), (c) IgG (d) 5 × 10⁻¹³ g/mL (e) 10−12 g/mL (f) 10−11 g/mL (g) 10−10 g/mL (h) 10−9 g/mL (i) 10−8 g/mL (j) 10−6 g/mL (k) 5×10⁻⁶ g/mL; (B) ΔRet as a function of the logarithmic concentration of Der p2 for the proposed nanobionsensor.

In the Randles equivalent circuit, the total impedance is composed of the electrolyte resistance (Rs), the double layer capacitance (Cdl), and the charge transfer resistance (Ret), where Rs denotes the bulk properties of the electrolyte solution. Total impedance is irrelevant to the chemical reactions taking place at the electrode interface. The values of Ret and Cdl vary when different substances are bonded onto the electrode surface. illustrates the fitting parameters for the equivalent circuit model of the proposed immunosensor for the impedance plots in . As tabulated in , the value of each Rs is much smaller, and can be neglected when compared with its corresponding Ret value. Hence the Randles equivalent circuit can be described as:
Table 1 Fitting parameters for the equivalent circuit model of the immunosensor
As expressed in Equationequation (2)(2) , both Ret and Cdl affect the impedance plot. However, shows that there is a more substantial change in Ret compared with Cdl. It is thus feasible to use the charge transfer resistance change as the parameter to correlate the sensor response with different analyte concentrations.
illustrates the change of the charge transfer resistance as a function of the logarithmic concentration of Der p2 for the proposed nanostructured biosensor. For each concentration, 3 experiments were conducted. All the standard deviations for different concentrations are less than 5% as illustrated by the error-bar in . The linear regression plot with R2 = 0.99 indicates the good linearity of the sensor response. The detection limit was about 1 pg/mL: (d) and (e) in . A dynamic range up to 5 μg/mL, (k) in , was also measured. Once the Ret of an IgG-Der p2 bonding is detected, the concentration of Der p2 in a solution can be determined by this regression plot.
Although the sensing area of the proposed device, as detected by the CV testing, was 4.2 times larger than that of the flat gold thin film sensor, the enhancement of the sensing signal by the proposed device was much larger than the area enlargement. It is presumed that the uniformly distributed gold nanoparticles on the hemispheric array allowed the MUA molecules to attach themselves to individual gold nanoparticles, followed by the binding of EDC/NHS molecules, and then IgG molecules. Hence the effective binding between Der p2 and IgG could be largely increased, resulting in the enhancement of the sensing signal being enhanced. The proposed nanostructured biosensor would be useful for the rapid detection of rare molecules in a solution.
Fluorescence analysis results
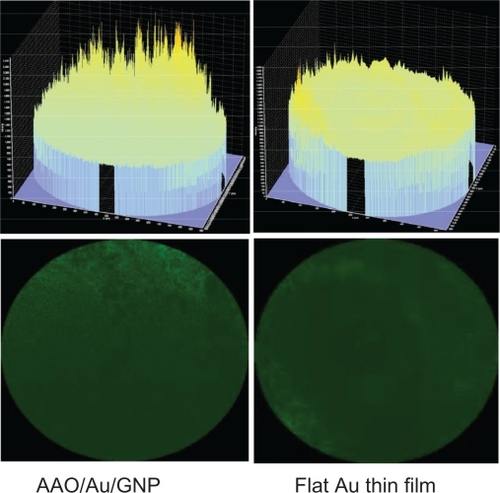
shows confocal microscopic images for a Der p2-EGFP concentration of 1 ng/mL. It can be observed that the adherence of the Der p2 molecules to the proposed 3D nanostructured biosensor was much more intense and uniform than was the adherence to a plain gold thin film. The percentage area of the fluorescence intensity and fluorescence intensity of the proposed 3D nanostructured biosensor was measured using software Image J (NIH, USA) to be 22.76% and 59,670, respectively. They are 5.12% and 13,409 respectively for the plain gold thin film. Both the ratios of the percentage area of the fluorescence intensity and fluorescence intensity between the proposed scheme and the plain gold thin film are around 4.45. The results agree with the 4.2-fold effective area enhancement. A comparison of the adhesion of Der p2 to different sensors further indicates that the intensity and uniformity of the Au nanoparticles on the sensor is the main factor leading to the high sensitivity of the proposed 3D nanostructured biosensor.
Figure 7 Fluorescence analysis of a sensor for Der p2 adherence.
Abbreviations: AAO, anodic aluminum oxide; GNP.
Conclusion
A highly sensitive nanostructured biosensor was designed in this study based on a 3D sensing element with uniformly deposited gold nanoparticles for the detection of the dust mite antigen Der p2. The sequential synthesis processes of the nanostructured biosensor include: preparation of an AAO film; modification of the surface of the barrier layer; deposition of a thin film of gold on the surface of the barrier layer; annealing; and electrochemical deposition of gold nanoparticles on the gold thin film. Results show that the IgG antibodies for the dust mite antigen Der p2 were immobilized on the gold nanoparticles. The sensing limit and dynamic range of the proposed 3D gold-nanoparticle based nanostructured biosensor using electrochemical impedance spectroscopy analysis were examined and found to be 1 pg/mL and 5 μg/mL, respectively. The marked enhancement of sensitivity was due to the following factors: 1) the 3D nanostructure of the AAO film increased the binding surface of the gold nanoparticles; 2) the symmetrical distribution of the electrical field intensity during electrophoresis deposition resulted in an exceptionally uniform distribution of the gold nanoparticles; 3) the uniform distribution of the gold nanoparticles on the hemispheric array allowed the MUA molecules to attach to individual gold nanoparticles, followed by the binding of EDC/NHS molecules, and then IgG molecules. Hence the effective binding between Der p2 and IgG could be greatly increased.
Acknowledgements
The authors would like to offer their thanks to the Department of Health of Taiwan for financial support for this research under grant number DOH98-TD-N-111-006.
Disclosure
The authors have no conflict of interest to declare in this work.
References
- TsaiJJKaoMHHuangSLComparison of major aeroallergens in Taipei and Kin-MenJ Formos Med Assoc1997969859899444919
- TsaiJJShenHDChuaKYPurification of group 2 Dermatophagoides pteronyssinus allergen and prevalence of its specific IgE in asthmaticsInt Arch Allergy Immunol200012120521010729778
- OsterlundCGronlundHPolovicNSundstromSGafvelinGBuchtAThe non-proteolytic house dust mite allergen Der p2 induce NF-κB and MAPK dependent activation of bronchial epithelial cellsClin Exp Allergy2009391199120819486032
- CollardJMMalaiseJMabrutJYSkeletonizing en-bloc gastrectomy for adenocarcinoma in Caucasian patientsGastric Cancer2003621021614716514
- LequinRMEnzyme immunoassay (EIA)/enzyme-linked immunosorbent assay (ELISA)Clin Chem2005512415241816179424
- LoweCRNanobiotechnology: the fabrication and applications of chemical and biological nanostructuresCurr Opin Struct Biol20001042843410981630
- BigelowWCPickettDLZismanWAOleophobic monolayers: I. Films adsorbed from solution in non-polar liquidsColloid Interface Sci19461513538
- NuzzoRGFuscoFAAllaraDLSpontaneously organized molecular assemblies. 3. Preparation and properties of solution adsorbed monolayers of organic disulfides on gold surfacesJ Am Chem Soc198710923582368
- RubinsteinESMaozRSagivJElectrochemical sensors for biomedical applications, Li CKN (editor)The Electrochemical Society1986175
- DuboisLHNuzzoRGSynthesis, structure, and properties of model organic surfacesAnnu Rev Phys Chem199243437463
- EverettWRWelchTLReedLFaulesIFLaser desorption Fourier transform mass spectrometry exchange studies of air-oxidized alkanethiol self-assembled monolayers on goldAnal Chem199567292298
- HuangHLiuZYangXApplication of electrochemical impedance spectroscopy for monitoring allergen–antibody reactions using gold nanoparticle-based biomolecular immobilization methodAnal Biochem200635620821416836968
- HuangHRanPLiuZImpedance sensing of allergen-antibody interaction on glassy carbon electrode modified by gold electrodepositionBioelectrochem200770257262
- HuangHRanPSignal enhancement of surface plasmon resonance-based immunoassays for the allergen detectionSensors and Actuators B2008131417423
- YunYHBangeAHeinemanWRA nanotube array immunosensor for direct electrochemical detection of antigen-antibody bindingSensors and Actuators B2007123177182
- ShiLPeiCLiQOrdered arrays of shape tunable CuInS2 nanostructures, from nanotubes to nano test tubes and nanowiresNanoscale201022126213020835442
- WangGJChouSWElectrophoretic deposition of uniformly distributed TiO2 nanoparticles using an anodic aluminum oxide template for efficient photolysisNanotechnology201021115206
- HuangJYangGMengWWuLZhuAJiaoXAn electrochemical impedimetric immunosensor for label-free detection of Campylobacter jejuni in diarrhea patients’ stool based on O-carboxymethylchitosan surface modified Fe3O4 nanoparticlesBiosens Bioelectron200940893896
- DanielsJSPourmandNLabel-free impedance biosensors: opportunities and challengesElectroanalysis2007191239125718176631
- MacdonaldJRImpedance Spectroscopy: Emphasizing Solid materials and SystemsNew YorkWiley1987
- HrapovicSLiuYMaleKBLuongJHTElectrochemical biosensing platforms using platinum nanoparticles and carbon nanotubesAnal Chem2004761083108814961742
- TsaiJJShenHDChuaKYPurification of Group 2 Dermatophagoides pteronyssinus allergen and prevalence of its specific IgE in asthmaticsInt Arch Allergy Immunol200012120521010729778