
Abstract
Introduction
Though widely studied for biomedical applications, the lack of current systemic studies on the in vivo fate of single-walled carbon nanohorns (SWCNHs) largely restricts their further applications, as real-time monitoring of their biodistribution remains a big challenge. Here, we aim to customize a label-free multispectral optoacoustic tomography (MSOT) method and systematically survey the fate of oxidized SWCNHs (SWCNHox) following different exposure routes by whole body imaging.
Methods
Mice were given a suspension of SWCNHox with an average size of 136.4 nm via four different administration routes, and then imaged by MSOT.
Results
After oral gavage, SWCNHox were mainly distributed in the gastrointestinal tract then excreted through the gut. Compared with the observation post first dosing, the accumulation of SWCNHox in the gastrointestinal tract was not obvious even after four-time oral gavage. Almost no SWCNHox were found at detectable levels in kidney, liver, blood and spleen. Following intravenous (iv) injection, SWCNHox were mainly presented and persisted in the spleen and liver, while very little in the kidney and almost none detectable in the intestine. SWCNHox accumulated significantly in the liver and spleen after four IV administrations. Following hypodermic and intramuscular injections, almost no SWCNHox could cross biological barriers and transport to the spleen, kidney or liver, likely due to their very low absorption rate. Almost all SWCNHox remained around the injection sites. For the first time, we have systematically investigated the in vivo fate of SWCNHs in a label-free and real-time manner.
Conclusion
The findings of this study provide insights into the selection of appropriate exposure routes for potential biomedical applications of carbon nanomaterials.
Introduction
Single-walled carbon nanohorns (SWCNHs) are novel carbon nanomaterials that have become a promising alternative to graphene and carbon nanotubes for a wide range of applications.Citation1 Due to their special conical shape and size, SWCNHs have unique properties. Dahlia-type SWCNH aggregates (SWCNHag) can be assembled with ~ 2000 graphitic tubules with a diameter of 80–120 nm, forming spherical superstructures with extensive horn interstices and high surface area. Noticeably, the unique structure and geometry of SWCNHs allow for chemical reactions to occur within the space of their three-dimensional structures.Citation1 In addition, the incorporation and release of drugs or other bioactive molecules (a property rarely possessed by other carbon nanomaterials) can be achieved by creating nano-scale windows on the tips and sidewalls, thus further expanding the surface area of SWCNHs by oxidation. Moreover, oxidation can render carbon nanohorns more hydrophilic, thus improving their biocompatibility and reducing aggregation.Citation2 SWCNHs can be produced with high yield without metallic particles as impurities, favoring the study of their applications. Due to their many aforementioned outstanding properties, SWCNHs have shown great promise in a number of biomedical applications such as drug/gene delivery,Citation3–Citation7 photothermal therapy, in vivo imaging (e.g. Raman spectroscopy and photoacoustic tomography), and many others.Citation2,Citation3
Although SWCNHs are promising, their use as biomedical applications remains technically challenging. One of the main reasons is that their in vivo fate has not been well demonstrated. In particular, because carbon is a widely existing element in organisms, in vivo monitoring of administered carbon nanomaterials remains a great challenge. Currently, optical microscopy is used in many histological studies of intravenously administered nanocarbons, where SWCNHs can be detected as black pigmentation in tissues like liver and spleen.Citation8,Citation9 However, the black pigmentation optical method has poor specificity and can only be used for tissue analysis, not for in vivo imaging analysis. Apart from optical microscopy, chemically attaching labeling molecules like radioisotopesCitation10−Citation12 and fluorescent dyesCitation13 to carbon nanomaterials is another approach to determining the biodistribution of carbon nanomaterials. However, there is a risk that the attached molecules will separate from nanomaterials when passing through the body, resulting in uncertainty of measured values. Recently, Gd2O3 nanoparticles were embedded inside SWCNHag to prevent detachment from the SWCNHag during movement through the body, and this approach was proven effective for SWCNHs labeling.Citation14,Citation15 In these studies, the amount of Gd in excised visceral organs was measured by inductively coupled plasma atomic emission spectroscopy to determine its biodistribution after intravenous injection. However, the application of this method is limited by the fact it requires metals that do not naturally exist in living bodies, such as Gd.
Considering the intrinsic properties of carbon nanomaterials, near-infrared fluorescence imaging, photoacoustic imaging, and Raman imaging are the three preferred methods for tracking them in vivo. Because living tissues have high optical scattering characteristics, most optical imaging modes based on visible light and near-infrared wavelengths, such as whole-body fluorescence imaging, are limited in their ability to observe objects with a depth exceeding several millimeters in vivo with reasonable resolution and signal-to-noise ratio. Because ultrasound is less scatterable than photons, photoacoustic imaging, which detects ultrasound signals excited by optical lasers, has higher temporal and spatial resolution than fluorescence imaging.Citation16,Citation17 It is reported that the photoacoustic signal intensity of single-walled carbon nanotubes (SWCNTs) is significantly higher than that of blood.Citation18 Initial photoacoustic imaging research of SWCNTs leveraged their inherent optical properties to use them as contrast agents for tumor photoacoustic imaging.Citation19 Subsequently, reports have explored different strategies to improve the photoacoustic imaging contrast of SWCNTs in tumor imaging.Citation20,Citation21 However, as a relatively novel material SWCNHs have not been widely studied for photoacoustic imaging.
Multispectral Optoacoustic Tomography (MSOT) is an innovative photoacoustic imaging technology that allows the ability to quantitatively distinguish tissues in vivo in a real-time manner. It can accurately quantify the whole body by using advanced algorithms for cross-sectional imaging. These algorithms can accurately resolve the strong nonlinear dependence of light intensity in deep tissues. In many studies of applied MSOT research, multi-wavelength image acquisition and subsequent spectral analysis have been used for highly specific determination of the spatial distribution of near-infrared absorbers that exhibit a different contrast to the intrinsic contrast of tissue.Citation22–Citation27 Non-invasive MSOT was successfully applied clinically to determine the metastatic status of sentinel lymph nodes of patients with melanoma.Citation28
To bridge the gap between understanding the in vivo fate of SWCNHs and promoting their further biomedical applications, in this study, we customized a label-free MSOT-based approach for real-time in vivo tracking of SWCNHs. Based on this approach, for the first time, we systemically investigated the biodistribution of oxidized SWCNHs (SWCNHox) following different exposure routes including oral gavage, intravenous, hypodermic and intramuscular injections in a real-time and non-invasive manner. The distribution of SWCNHox was visualized in live mice with a high spatial resolution. Nanoparticle concentrations in harvested organs were measured spectroscopically using the intrinsic photoacoustic signal of SWCNHox. Our findings on the biodistribution of SWCNHox can help elucidate the in vivo fate of SWCNHox after different administration routes, which may provide practical information on promoting their further biomedical applications.
Materials and Methods
Materials
The dahlia-like SWCNHs were supplied from Beijing Qingdajiguang technology development Co., Ltd. Isoflurane was obtained from Hebei Yipin Pharmaceutical Co., Ltd (Shijiazhuang, People’s Republic of China). The high concentration Matrigel was supplied from BD Biosciences (Bedford, MA, USA). Bovine serum albumin (66 kDa) was obtained from Sigma-Aldrich (St. Louis, MO, USA). H2O2 was obtained from Sinopharm Chemical Reagent Co., Ltd (Beijing, China). All other reagents came from commercial sources.
Animals
Nu/Nu nude (6–8 weeks old) mice were obtained from Vital Laboratory Animal Center (Beijing, China). The nursing of experimental animals and the operation of animal experiments conformed to the “Beijing Administration Rule of Laboratory Animal.” The experiments were carried out with the approval of the Committee of Animal Care and Use Institutions of Peking University (No LA2016121). Animals were anesthetized with isoflurane during the experiment.
Fabrication and Characterization of SWCNHox
In order to open holes in the side wall and introduce a large amount of carboxyl groups at the edges of the holes, the dahlia-like SWCNHs were treated with light-assisted oxidation following the previously published procedures used for preparing SWCNHox.Citation2 To prepare stock solutions, SWCNHox was suspended in water or PBS using Bovine serum albumin (BSA) as a suspending agent; then, large aggregates were removed by centrifugation with a centrifuge (Kubota, model 2420) at 12,000 rpm for 10 min. After the concentration of SWCNHox in suspension determined according to a previously published method,Citation2 the stored solution was diluted to the required concentration with PBS for in vivo studies.
The morphology and structure of the resulting SWCNHox were observed with a high-resolution transmission electron microscope (JEM2100F, JEOL Ltd.). The size distribution and zeta potential of SWCNHox were obtained by a dynamic light scattering instrument (A Malvern Zetasizer Nano ZS, Malvern, UK). The absorption spectrum of SWCNHox suspension (100 µgmL−Citation1) in double distilled water at 680–980 nm was measured by an ultraviolet-visible-near infrared spectrophotometer (Cary-5000, Varian, Palo Alto, USA).
Optoacoustic Imaging Procedure and Processing
All MSOT measurements were performed in a real-time photoacoustic imaging system (iThera Medical GmbH, Munich, Germany) using a previously described procedure.Citation2 With a transparent polyethylene film attached to the sample holder to keep the sample dry, photoacoustic measurements were carried out in a constant temperature water bath at 34°C. Data processing and optoacoustic signal quantification were performed with commercial software from iThera Medicals (Munich, Germany). After using the model-based off-line analysis method to reconstruct the image of the original data, the least squares method was applied to carry out spectral fitting, and then the linear spectral unmixing technique was used to analyze signals from SWCNHox.Citation29 SWCNHox as well as oxyhemoglobin and deoxyhemoglobin are considered as the main absorbers in biological tissues. For each pixel in the image, the method matches the total measured photoacoustic spectrum with the absorption spectra of these known main absorbers.
SWCNHox Optoacoustic Signals
In vitro Experiments
Sample suspensions of SWCNHox preparation were placed in a cylindrical model with two circular holes in the middle for optoacoustic detection. For each measurement, one of the holes was filled with a sample of a series of concentrations of SWCNHox, with the other hole containing PBS with BSA for signal strength measurement reference. Imaging was competed in the MSOT system (iThera Medical GmbH, Munich, Germany) by transversal plane imaging in the middle of the cylindrical model. From 680 to 980 nm with a step size of 2 nm, imaging was carried out using an average of 20 per illumination wavelength. Then, at each wavelength of 700 nm, 730 nm, 760 nm, 800 nm, 850 nm, 900 nm, the data of series of SWCNHox suspension between 1 and 50 μg mL−1 was collected using 20 average values. Optoacoustic signal intensity was obtained from the analysis of a region of interest.
In vivo (Subcutaneous Signal)
Twenty-five microliter of SWCNHox suspensions and matrigel mixtures at a series of concentrations between 12.5 and 200 μg mL−1 were injected into the lower back of Nu/Nu nude mice subcutaneously. The matrigel solidified and fixed the SWCNHox in place upon injection. Matrigel alone does not generate a photoacoustic signal.Citation28 Then, the photoacoustic images of the inclusions were obtained by MSOT small animal-imaging equipment. Data acquisition was carried out by the method prescribed above.
Biodistribution of SWCNHox Following Different Administration Routes
For imaging experiments, Nu/Nu nude mice were administered SWCNHox suspension (1.008 mg mL−1 in PBS at pH 7.4) of the corresponding volume according to the administration route and dosage. During the acquisitions, animals were anesthetized with 2% isoflurane in oxygen and their body temperature was maintained at 34°C. Using MSOT small animal-imaging equipment, images were acquired by scanning the thoracoabdominal region in 10 min with 0.5 mm per step, and then calculating the average photoacoustic signals in the region of interest of each photoacoustic image. Intensities of the photoacoustic signals depend on the acquisition parameters, so the subsequent experiments are performed using the same acquisition parameters.
Single Dose Oral Gavage
A single dose of 201.6 µg SWCNHox suspension was orally administered to an awake Nu/Nu nude mouse with a feeding needle, and photoacoustic images were acquired before oral administration and then at a predetermined time point after oral gavage.
Multidose Oral Gavage
The SWCNHox suspension was orally administered at a dose of 50 µg per mouse every day for 4 days total to Nu/Nu nude mice. Photoacoustic images were obtained before oral gavage and at scheduled time points of 1, 2, 3, 5, 7, 24, 48 and 72 h after the fourth gavage administration.
Single Dose and Four-Time Intravenous Administration
SWCNHox were diluted with PBS at pH 7.4 to a concentration of 200 μg mL−1. Then, 100 μL of SWCNHox suspension per mouse (20 μg) was intravenously administered via tail vein injection. Photoacoustic images were obtained pre-injection, and at 1, 3, 5 and 7 h post-injection by 0.5 mm steps. After image acquisition, SWCNHox suspension was intravenously administered at a 20 µg dose per mouse every day for the remaining three times to the same mice. Photoacoustic images were acquired at predesigned time points following the fourth tail-vain injection.
Intramuscular and Hypodermic Administration
One hundred and fifty microliter of SWCNHox suspension (30 μg, 200 μg mL−1) was injected to the right hind limb and lower back of Nu/Nu nude mice to study intramuscular and subcutaneous administration separately. Photoacoustic images were acquired as described above before and after injections at predetermined time points for both administration routes.
Statistical Methods
The quantified ROI (Region of interest) of the MSOT photoacoustic signals were expressed as mean ± standard deviation values (n=3). All data were statistically analyzed by ANOVA, and a P value of less than 0.05 was considered to have statistical significance.
Results and Discussion
Fabrication and Characterization of SWCNHox
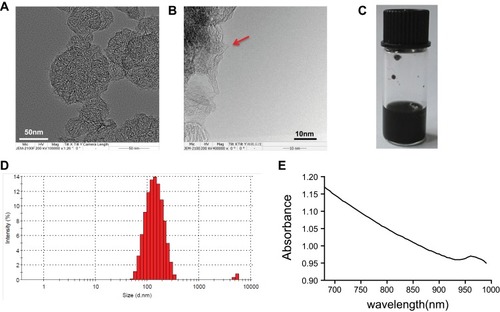
TEM images revealed that the morphological characteristics of the resultant SWCNHox, as shown in . In addition, the characteristic holes were successively achieved and visibly present on the walls of SWCNHox, as shown by the red arrow in . The prepared SWCNHox were able to be re-suspended homogenously in PBS with pH7.4 using BSA as the suspending agent without detectable aggregates (). The average particle size and polydispersity index for the SWCNHox was 136.4 nm and 0.205, respectively (). The average zeta potential of the SWCNHox suspensions was −21.6 mV. The absorption spectrum of the SWCNHox in double distilled water () reveals that SWCNHox have a comparably strong absorbance in the 680–980 nm range which is a prerequisite for photoacoustic imaging.
Figure 1 Characterization of SWCNHox. (A, B) Transmission electron microscope images of SWCNHox, the red arrow indicates the hole of SWCNHox. (C) Picture of SWCNHox suspensions in PBS. (D) Particle size distribution of suspensions of SWCNHox in PBS with BSA as the suspending agent measured by dynamic light scattering analysis. (E) The absorption spectrum of SWCNHox in double-distilled water.
Optoacoustic Signals of SWCNHox in vitro and in vivo
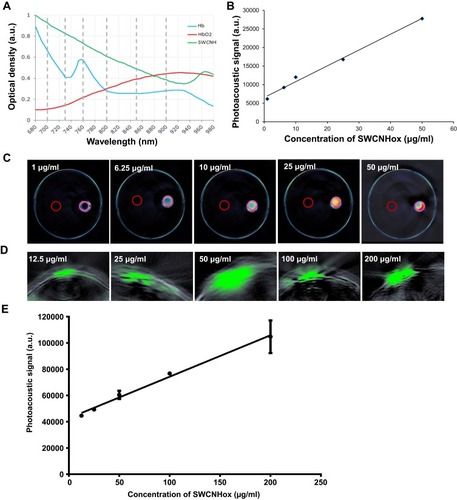
As shown in , SWCNHox exhibited a unique spectral profile compared to oxygenated and de-oxygenated hemoglobin. This feature allows MSOT to spectrally unmix the SWCNHox components in each voxel of the acquired volume from the other absorbing components. In vitro measurements of SWCNHox showed a strong photoacoustic signal and excellent linearity over a concentration range of 1 to 50 μg mL−1 (). Photoacoustic images of the inclusions of the nude mouse () revealed the SWCNHox signal contrast in the mouse background signal. The photoacoustic signal in vivo showed a linear correlation with the concentration of SWCNHox ().
Figure 2 In vitro and in vivo characterization of the photoacoustic properties of SWCNHox. (A) Comparison of the photoacoustic spectra of SWCNHox with known absorbances of Hb and HbO2. The dashed grey lines indicate the wavelengths selected to unmix Hb, HbO2 & SWCNHox in the images. (B) In vitro measurements of SWCNHox with a concentration range of 1 to 50 μg mL−1 showed a strong photoacoustic signal and excellent linearity (RCitation2 = 0.9918). (C) MSOT signal of different concentrations of SWCNHox suspensions in PBS with BSA as the suspension agent measured in Phantom; PBS with BSA was used as a control. D-E, The photoacoustic detection results of SWCNHox in live mice. (D) One vertical slice (green) of 2D photoacoustic image was overlaid on the corresponding ultrasound image slice (grey) acquired after subcutaneous injection of SWCNHox. The skin can be seen in the ultrasound image, and the photoacoustic images display SWCNHox. (E) The linear regression of photoacoustic signal calculated on the five most concentrated inclusions to the concentration of SWCNHox injected (RCitation2= 0.9928).
Biodistribution of SWCNHox Over Time Following Single Dose and Multidose Oral Gavage Administration
SWCNHox was administered by oral gavage and the thoracoabdominal region of the mice was imaged by MSOT at multiple time points. The SWCNHox signal was found to be highly concentrated around the stomach and in the intestines after administration.
No SWCNHox signal only the background signal was detected in the stomach or intestine prior to injection (). However, visible SWCNHox signals gradually showed up from 30 min to 7 h after the injection (). The photoacoustic signal increased in the stomach in the first 5 h and slowly decreased after that and returned to the body baseline level after 24 h (shown in ). SWCNHox signal could be detected in the intestine for up to 48 h post-administration (). While it increased in the first few hours and decreased afterwards, the SWCNHox signal in the intestine was almost undetectable after 72 h of oral administration (). These findings were consistent with the MIPs of orthogonal views of the 3D data acquired by the MSOT at multiple time points pre- and post-administration of SWCNHox in mice (). A clear increase of the SWCNHox signal can be seen in the abdominal area showing the localization around the stomach and in the intestines. No SWCNHox can be detected in the stomach 24 hrs post-administration. Comparing the signals in , it is evident that there was no accumulation in the gastrointestinal tract after either a single-dose or multi-dose oral administration of SWCNHox. Though the total dose of multi-administration is similar to that of the single-dose group, the signal detected shown in was weaker than that in , indicating the elimination of SWCNHox in the digestive tract. The feces of rats turned black 24 hrs post- administration (data not shown), further demonstrating that SWCNHox were distributed in the gastrointestinal tract and then excreted through the gut when exposed by oral administration.
Figure 3 Biodistribution of SWCNHs following oral administration. (A) MSOT single cross-sectional images showing stomach and intestines, in which the spectrally unmixed SWCNHox component was superimposed on the greyscale scale 800 nm single wavelength image of a mouse, given a single dose of 200 µg. Images of cryoslices were used as anatomical references. (B) The plot of the corresponding delta MSOT signal in the stomach drawn using MSOT signal of the corresponding time points subtracted the background signal (Pre-gavage).
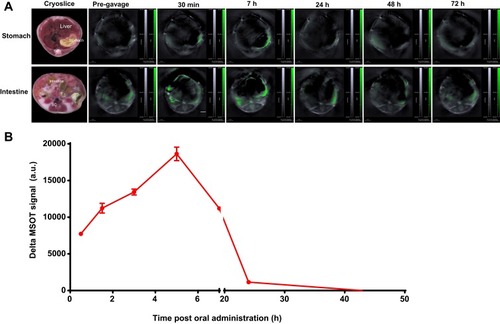
Figure 4 Multi-intensity projection (MIP) of orthogonal views of 3D data obtained by MSOT at scheduled time points pre- and post-oral administration of SWCNHox in mice. (A) Mouse was administered a single dose of 200 µg SWCNHox via oral gavage and imaged before and after the administration. (B) Mouse was orally administered with multiple doses (50 µg SWCNHox per dose and four doses in total) and imaged before and after the fourth administration. The mice were kept under anesthesia during the measurement. (C) Picture of ROI selection. (D) The SWCNHox signals over time in vessels after oral gavage administration of single-dose 200 µg of SWCNHox.
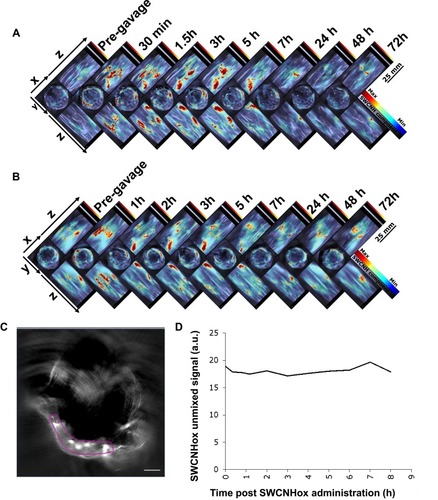
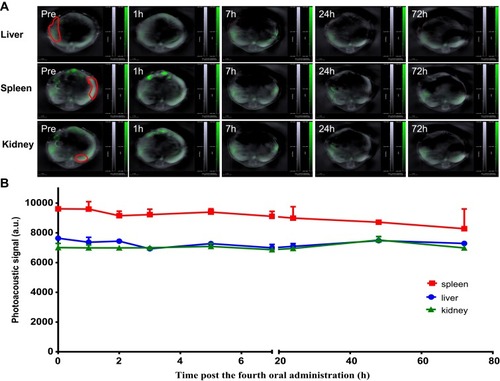
To assess whether SWCNHox can pass through the intestinal mucosa into the blood system, a region of interest (ROI) was drawn () at the level of the lungs encompassing vessels on the surface of the rib cage including the intercostal artery, and a minimum thresholding was applied to exclude background signal from the quantification. The graph shows changes of the SWCNHox signal over time in the ROI. It was found that the signal remained at the pre-injection baseline level (time 0 in the graph) throughout all of the tested time points, indicating that no detectable levels of SWCNHox passed into the blood system. This finding was further confirmed by the absence of SWCNHox signal in the spleen or liver of the animal after oral administration (). Moreover, the photoacoustic signals showed no significant difference between prior to the first administration and after the fourth oral gavage of SWCNHox in liver, spleen and kidney (). This observation further validated this finding. Therefore, SWCNHox does not accumulate in spleen or liver over time in accordance with the finding that SWCNHox was not absorbed into the blood system.
Figure 5 Signal of SWCNHox in liver, spleen and kidney following multi-dose (four doses) oral administration. (A) Optoacoustic images of the liver, spleen and kidney after total 200 µg SWCNHox oral administration. (B) The photoacoustic signals in the liver, spleen and kidney before the first administration and after the fourth oral gavage administration of SWCNHox.
Biodistribution of SWCNHox Following Single Dose and Multidose Intravenous Administration
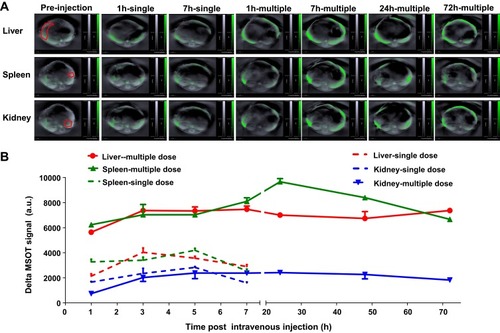
Multiple intensity projections (MIPs) of orthogonal views of the 3D data () were used to observe SWCNHox at different time points before and after intravenous administration. Compared with the signals of the pre- and post-first dose intravenous administration, SWCNHox signals acquired after the fourth administration significantly increased in the abdominal area, and the signals were found to be localized around the liver and spleen. This result indicated that SWCNHox would significantly accumulate in spleen and liver following multi-dose intravenous administration. The SWCNHox distribution in the liver, spleen, and kidney was then estimated from the intensities of photoacoustic signals measured by MSOT following tail vein administration. The results shown in further confirmed the previously mentioned results. The amount of SWCNHox in liver and spleen was found to be the largest, while a very small portion was found in the kidney.
After multi-dose administration, the quantity of SWCNHox in spleen and liver increased significantly and there was no obvious change after administration during the whole test period (). Meanwhile, signals in the kidney of mice post multi-dose administration exhibited almost no change compared to that after the first dose. This indicated that SWCNHox was taken up mainly by reticuloendothelial systems of spleen and liver within 30 mins, and remained stable for at least 72 h post-administration, while almost no SWCNHox was accumulated in the kidney.
Figure 6 Multiple intensity projections (MIPs) of orthogonal views of the 3D data acquired by MSOT at multiple time points before and after intravenous (iv) administration of SWCNHox in one mouse. (A) The mouse was injected with a single dose of 20 µg SWCNHox and then imaged before and after administration. (B) The mouse was intravenous injected with 20 µg of SWCNHox per dose and four doses in total, and was imaged before and after the fourth administration. The mouse was kept under anesthesia during the measurement.
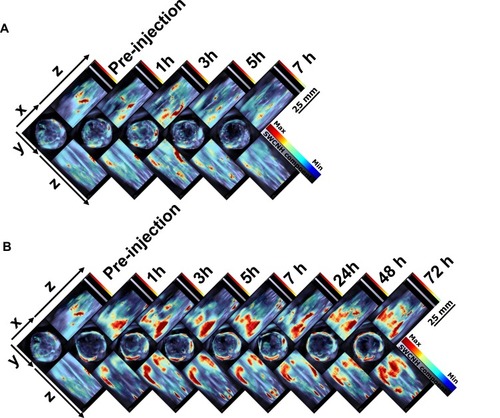
Figure 7 Signal of SWCNHox in kidney, liver and spleen following intravenous administration. (A) Optoacoustic images of the kidney, spleen and liver after single-dose administration of 20 µg SWCNHox and multi-dose intravenous administration of 80 µg SWCNHox in total (20 µg SWCNHox per dose and totally four doses). (B), Graph of the photoacoustic signal changes in region of interest of spleen, kidney and liver during imaging of mice drawn using MSOT signal of the corresponding time points subtracted the background signal (Pre-injection).
Biodistribution of SWCNHox Following Intramuscular and Hypodermic Administrations
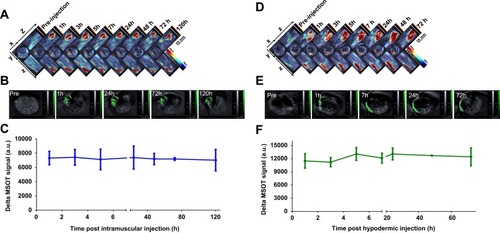
As shown in , it was found that almost no SWCNHox administrated intramuscularly could cross different biological barriers and enter the liver, spleen or kidney due to a very low absorption rate. Almost all of the administered SWCNHox persisted around the injection site for up to 120 hrs. This was validated by the results of quantitative analysis of the photoacoustic signals of ROIs. During the entire experimental period the photoacoustic signal intensity did not change significantly (). Similar results were observed in the biodistribution studies of SWCNHox administered through hypodermic injection (). The SWCNHox photoacoustic signal distribution remained minimally changed up to 72 h post hypodermic injection, and persisted around the injection site. This feature together with its other properties like strong near-infrared absorption () and heat generation, gives SWCNHs unique advantages in photothermal therapy for treating superficial tissue carcinoma.
Figure 8 Signal of SWCNHox following intramuscular or hypodermic administration. MIPs of orthogonal views of the 3D data obtained by MSOT at scheduled time points before and after injection of 30 µg SWCNHox in mouse, (A) intramuscular injection; (D) hypodermic injection. Optoacoustic images of the injection site pre- and post- administration, (B) intramuscular injection; (E) hypodermic injection. Graph of the photoacoustic signal changes in the region of interest of the mice administered with SWCNHox drawn using MSOT signal of the corresponding time points subtracted the background signal (Pre-injection), (C) intramuscular injection; (F) hypodermic injection.
MSOT is a non-invasive imaging method that can allow repeated imaging of a single animal so as to be able to perform longitudinal imaging (e.g. to characterize the baseline level of stomach, liver, spleen or kidney), and comparisons can be made following treatments as a result. It is also possible to repeatedly image in multi-dose administrations. We can compare the signals post multi-dose administration with the signals following the first-dose, thus potentially minimizing the effect of biological variation among mice, and allowing statistically significant observation using fewer animals. Compared with ex vivo studies, MSOT requires far fewer animals for the biodistribution study. In addition to the inherent spatial and temporal resolution, the method of combining probe information and tissue used in MSOT is very useful in various fields for studying the biological distribution of delivered cargo and other kinetic processes in mice.
Conclusions
In summary, the fate of SWCNHs administered through different routes including oral gavage, intravenous, intramuscular and hypodermic injections can be monitored in mice by label-free, real-time whole-body MSOT imaging. MSOT provides important new features for gastrointestinal imaging in small animals. Experiments showed that MSOT can provide high temporal and spatial resolution visualization of anatomical and physiological parameters. Quantification of the SWCNHox signal in vessels shows that SWCNHox is not absorbed into the blood at detectable levels after oral gavage administration. This point is strengthened by the observation that no significant signal increase can be detected in the kidney, spleen or liver with the passage of time. Following intravenous administration, SWCNHox mainly accumulated in the liver and spleen, indicating that these two organs were important retention sites. The photoacoustic signal distribution of SWCNHox changed minimally up to 72 h following intramuscular or hypodermic administration, and the SWCNHox persisted around the injection site. These characteristics give SWCNHox unique advantages in the photothermal therapy. When comparing the biological distribution of SWCNHox among the aforementioned routes, it was found that these differences were more significant, showing that the administration route of SWCNHox does have a significant impact on their biodistribution. By utilizing real-time imaging and obtaining the in vivo biological distribution of SWCNHox with high resolution in living animals, SWCNHox optoacoustic imaging allows unprecedented access to key information for precise customization of delivery carriers and their potential targets of diseased tissues for different administration routes. All in all, this study is one of the first studies to systemically investigate the in vivo fate of SWCNHox in a label-free and real-time manner. Findings in this work can provide valuable pieces of information to understand the biodistribution of SWCNHox in the body, having the potential to bridge the gap between understanding the in vivo fate of SWCNHox and their further biomedical applications. We expect that the combination of the imaging performance exhibited by small animal MSOT with new molecular probes will enable new insights into gastrointestinal function and diseases.
Disclosure
The authors report no conflicts of interest in this work.
Acknowledgments
This work was supported by the National Natural Science Foundation of China (no. 81603041), and the National Basic Research Program of China (973 program, 2015CB932100). We thank Dr. Thomas Sardella from iThera Medical GmbH and Dr. Rui Wang from Cold Spring Biotech Corp. for their kind help on data handling.
References
- Karousis N, Suarez-Martinez I, Ewels CP, Tagmatarchis N. Structure, properties, functionalization, and applications of carbon nanohorns. Chem Rev. 2016;116(8):4850–4883. doi:10.1021/acs.chemrev.5b0061127074223
- Shi YJ, Shi ZJ, Li SX, et al. The interactions of single-wall carbon nanohorns with polar epithelium. Int J Nanomed. 2017;12:4177–4194. doi:10.2147/IJN.S133295
- Swierczewska M, Choi KY, Ertz EL, et al. A facile, one-step nanocarbon functionalization for biomedical applications. Nano Lett. 2012;12(7):3613–3620. doi:10.1021/nl301309g22694219
- Li N, Zhao Q, Shu C, et al. Targeted killing of cancer cells in vivo and in vitro with IGF-IR antibody-directed carbon nanohorns based drug delivery. Int J Pharm. 2015;478(2):644–654. doi:10.1016/j.ijpharm.2014.12.01525510600
- Murakami T, Ajima K, Miyawaki J, Yudasaka M, Iijima S, Shiba K. Drug-loaded carbon nanohorns: adsorption and release of dexamethasone in vitro. Mol Pharm. 2004;1(6):399–405. doi:10.1021/mp049928e16028351
- Xu J, Yudasaka M, Kouraba S, Sekido M, Yamamoto Y, Iijima S. Single wall carbon nanohorn as a drug carrier for controlled release. Chem Phys Lett. 2008;461(4–6):189–192. doi:10.1016/j.cplett.2008.06.077
- Ajima K, Murakami T, Mizoguchi Y, et al. Enhancement of in vivo anticancer effects of cisplatin by incorporation inside single-wall carbon nanohorns. ACS Nano. 2008;2(10):2057–2064. doi:10.1021/nn800395t19206452
- Folkmann JK, Risom L, Jacobsen NR, Wallin H, Loft S, Møller P. Oxidatively damaged DNA in rats exposed by oral gavage to C60 fullerenes and single-walled carbon nanotubes. Environ Health Perspect. 2009;117(5):703–708. doi:10.1289/ehp.1192219479010
- Zhang M, Yamaguchi T, Iijima S, Yudasaka M. Size-dependent biodistribution of carbon nanohorns in vivo. Nanomedicine: NBM. 2013;9(5):657–664. doi:10.1016/j.nano.2012.11.011
- Singh R, Pantarotto D, Lacerda L, et al. Tissue biodistribution and blood clearance rates of intravenously administered carbon nanotube radiotracers. Proc Natl Acad Sci USA. 2006;103(9):3357–3362. doi:10.1073/pnas.050900910316492781
- Liu Z, He L, Nakayama N, et al. In vivo biodistribution and highly efficient tumour targeting of carbon nanotubes in mice. Nat Nanotechnol. 2006;2(1):47–52. doi:10.1038/nnano.2006.17018654207
- Ruggiero A, Villa CH, Holland JP, et al. Imaging and treating tumor vasculature with targeted radiolabeled carbon nanotubes. Int J Nanomed. 2010;5(1):783–802.
- Campagnolo L, Massimiani M, Palmieri G, et al. Biodistribution and toxicity of pegylated single wall carbon nanotubes in pregnant mice. Part Fibre Toxicol. 2013;10:21. doi:10.1186/1743-8977-10-2123742083
- Miyawaki J, Matsumura S, Yuge R, et al. Biodistribution and ultrastructural localization of single-walled carbon nanohorns determined in vivo with embedded Gd2 O3 labels. ACS Nano. 2009;3(6):1399–1406. doi:10.1021/nn900484619480401
- Yuge R, Ichihashi T, Jin M, Yoshitake T, Iijima S, Yudasaka M. Hidden caves in an aggregate of single-wall carbon nanohorns found by using Gd2O3 probes. J Phys Chem C. 2009;113(7):2741–2744. doi:10.1021/jp810121a
- Zhang Y, Hong H, Cai W. Photoacoustic imaging. Cold Spring Harb Protoc. 2011;2011(9):1015–1025. doi:10.1101/pdb.top065508
- Ntziachristos VDR. Molecular imaging by means of Multispectral Optoacoustic Tomography (MSOT). Chem Rev. 2010;110(5):2783–2794. doi:10.1021/cr900256620387910
- Pramanik M, Swierczewska M, Green D, Sitharaman B, Wang LV. Single-walled carbon nanotubes as a multimodal-thermoacoustic and photoacoustic-contrast agent. J Biomed Opt. 2009;14(3):034018. doi:10.1117/1.314740719566311
- De la Zerda A, Zavaleta C, Keren S, et al. Carbon nanotubes as photoacoustic molecular imaging agents in living mice. Nat Nanotechnol. 2008;3(9):557–562. doi:10.1038/nnano.2008.23118772918
- Koo J, Jeon M, Oh Y, et al. In vivo non-ionizing photoacoustic mapping of sentinel lymph nodes and bladders with ICG-enhanced carbon nanotubes. Phys Med Biol. 2012;57(23):7853–7862. doi:10.1088/0031-9155/57/23/785323151772
- Wang C, Bao C, Liang S, et al. RGD-conjugated silica-coated gold nanorods on the surface of carbon nanotubes for targeted photoacoustic imaging of gastric cancer. Nanoscale Res Lett. 2014;9(1):264. doi:10.1186/1556-276X-9-26424948888
- Tzoumas S, Deliolanis N, Morscher S, Ntziachristos V. Un-mixing molecular agents from absorbing tissue in multispectral optoacoustic tomography. IEEE T Med Imaging. 2014;33(1):48–60. doi:10.1109/TMI.2013.2279994
- Wang LV, Hu S. Photoacoustic tomography: in vivo imaging from organelles to organs. Science. 2012;335(6075):1458–1462. doi:10.1126/science.121621022442475
- Wang X, Pang Y, Ku G, Xie X, Stoica G, Wang LV. Noninvasive laser-induced photoacoustic tomography for structural and functional in vivo imaging of the brain. Nat Biotechnol. 2003;21(7):803–806. doi:10.1038/nbt83912808463
- Burton NC, Patel M, Morscher S, et al. Multispectral Opto-Acoustic Tomography (MSOT) of the brain and glioblastoma characterization. Neuroimage. 2013;65:522–528. doi:10.1016/j.neuroimage.2012.09.05323026761
- De la Zerda A, Bodapati S, Teed R, et al. Family of enhanced photoacoustic imaging agents for high-sensitivity and multiplexing studies in living mice. ACS Nano. 2012;6(6):4694–4701. doi:10.1021/nn204352r22607191
- Razansky D, Harlaar NJ, Hillebrands JL, et al. Multispectral optoacoustic tomography of matrix metalloproteinase activity in vulnerable human carotid plaques. Mol Imaging Biol. 2012;14(3):277–285. doi:10.1007/s11307-011-0502-621720908
- Stoffels I, Morscher S, Helfrich I, et al. Metastatic status of sentinel lymph nodes in melanoma determined noninvasively with multispectral optoacoustic imaging. Sci Transl Med. 2015;7:317. doi:10.1126/scitranslmed.aad1278
- Buehler A, Rosenthal A, Jetzfellner T, Dima A, Razansky D, Ntziachristos V. Model-based optoacoustic inversions with incomplete projection data. Med Phys. 2011;38(3):1694–1704. doi:10.1118/1.355691621520882