
Abstract
Objective
To investigate differential microRNAs' expression in heterogeneous bladder cancer cells, as well as to investigate the mechanism of changes in invasive and proliferative capacity induced by tunneling nanotubes (TNTs) mediated transport of microRNA between bladder cancer cells of varying histological grade.
Materials and methods
Differences in microRNA expression between bladder cancer cells of different grade were identified from a literature review. The identified heterogeneous microRNAs were analyzed by qPCR in T24 (high grade) and RT4 (low grade) bladder cancer cells. Scanning electron microscopy (SEM) and laser confocal fluorescence microscopy (LCM) were used to observe tunneling nanotubes (TNTs) between RT4 and T24 cells. Differentially expressed microRNA was labeled and traced by Fluorescent In Situ Hybridization (FISH) following co-culture of T24 and RT4 cells. MicroRNA mimic and inhibition technologies were applied to investigate how TNTs-mediated intercellular transport of microRNA affects the invasive and proliferative behavior of bladder cancer cells.
Results
MicroRNA-155 (miR-155) levels were highly expressed in T24 cells, whereas the same was not true in RT4 cells. MiR-155 was confirmed to be a crucial factor sustaining T24 bladder cancer cell proliferation, migration and cell cycle progression by CCK8, Matrigel test and cell cycle analysis, respectively. After T24 and RT4 co-culture, TNTs were assessed by SEM and LCM between T24 and RT4 cells. In addition, we observed TNTs mediated transport of miR-155 from T24 cells to RT4 cells, which thereby acquired a higher proliferative rate, an increased frequency of cells in the S phase, and increased invasive ability in Matrigel test. At the same time, Deptor, the target protein of miR-155 in RT4 cells, was downregulated, followed by mTOR/4EBP1/p70S6K- eIF4e/S6RP signaling activation.
Conclusion
MiR-155 was differentially expressed between RT4 and T24 bladder cancer cells. Intercellular transport of miR-155 via TNTs can promote bladder cancer cell reprogramming by Deptor-mTOR signal pathway activation.
Video abstract

Point your SmartPhone at the code above. If you have a QR code reader the video abstract will appear. Or use:
Introduction
Bladder cancer is histologically heterogeneous with respect to clinical and pathological behaviors.Citation1 About 30% of bladder cancers are high-grade in differentiation, and about 40% of these high-grade lesions progress to muscle-invasive bladder cancer with an associated ominous prognosis.Citation2
Tunneling nanotubes (TNTs) are a newly described cell–cell communication channel. TNTs are thin, tubular and F-actin-based structures with a 50 to 200 nm diameter, and which can connect cells over a long distance.Citation3 As a new biological tool for intercellular communication, TNTs allow direct transfer of proteins, organelles, microRNAs and ions between cells.Citation4–Citation7 Previously, we found that heterogeneous bladder cancer cells exchange micro-particles or organelles between cells using TNTs. Also, we showed that intercellular transport of mitochondria via TNTs facilitates progressing and reprogramming of low-grade bladder cancer cells.Citation8
MicroRNAs (miRs) are small non-coding RNAs that can mediate post transcriptional regulation of target proteins.Citation9 Increasing evidence confirms that microRNAs act as crucial regulatory factors of carcinogenesis and progression in various types of cancers.Citation10,Citation11 Hamdy et al found that altered microRNA acts in a tumor phenotype-specific manner in bladder cancer, and occurs early in carcinogenesis. They observed miRNA upregulation in high-grade bladder cancer, while they were downregulated for low-grade bladder.Citation12 Since microRNAs can only survive under the protection of the cytomembrane, the role intercellular transportation of microRNAs has rarely been studied.
As such, we hypothesized that microRNAs in high-grade bladder cancer cells can undergo intercellular transport into low-grade bladder cancer cells via tunneling nanotubes, thus promoting their invasive and proliferative abilities. In this study, we investigated the probability and underlying mechanisms of this process so as to unravel a novel mechanism of bladder cancer progression.
Materials and Methods
Reagents and Antibodies
McCoy’s 5A and RPMI 1640 mediums were purchased from Sigma (Missouri, USA, # M9309) and Hyclone (Utah, USA, # SH30809.01B). Fetal bovine serum was purchased from Bioind (Kibbutz Beit Haemek, Israel, #04-001-1ACS). Phalloidin-iFluor™ 405 Conjugate was purchased from AAT Bioquest (California, USA, #23111). RIPA Lysis Buffer, PMSF, phosphatase inhibitor, CFDA SE Cell Proliferation Assay and Tracking Kit, Cell Counting Kit-8 (CCK8) and BCA Protein Assay Kit were purchased from Beyotime Biotechnology (Shanghai, China, #C0051, #C0037, #P0013B, #ST506, #S1873 and #P0010). Sangon Biotech (Shanghai, China) synthesized the Fluorescent In Situ Hybridization Kit and Cy3-labeled microRNA-155-5p probes. Reverse Transcription System and SYBR Green Master Mix were from VAZYME (Nanjing, China, # R212-01/02 and #Q111-02). Enhanced chemiluminescence reagent kit was purchased from Thermo Scientific (Shanghai, China, #NCI5079). Cell cycle detection kit was from KeyGEN (Nanjing, China, # KGA512).
Rabbit anti-mTOR, anti-4EBP1, anti-p-4EBP1, anti-Deptor, anti-eif4e, anti-p-eif4e, anti-S6RP and anti-p-S6RP were purchased from SAB (Maryland, USA, #Sab21214, #Sab21215, #Sab11223, #Sab-47047, #Sab21226, #Sab11233, #Sab21225 and #Sab11580). Rabbit anti-p-mTOR was from Bioworld (Minnesota, USA, # Bs4706). Rabbit anti-p70s6k and Rabbit anti-p-p70s6k were purchased from Cell Signaling Technology (Massachusetts, USA, #2708, #9234). Rabbit anti-GAPDH was from Santa Cruz (Texas, USA, #SC25778).
Cell Culture
The original T24 cells and RT4 cells were purchased from Procell Life Science & Technology (Wuhan, China, Lot # CL-0227 and # CL-0431). The cells were cryo-preserved in our laboratory and cultured as previous study described.Citation8 Genepharma (Shanghai, China) synthesized miR-155-mimics, inhibitors and negative controls (NC). The hsa-miR-155-5p mimic sequence is 5ʹ-UUAAUGCUAAUCGUGAUAGGGGUCCCUAUCACGAUUAGCAUUAAUU-3ʹ. The sequence of hsa-miR-155-5p inhibitor is 5ʹ-ACCCCUAUCACGAUUAGCAUUAA-3ʹ. Cells were transfected by LipofectamineTM 2000 based on provided directions.
Fluorescent in situ Hybridization, Laser Confocal Microscopy (LCM) and Scanning Electron Microscopy (SEM)
CFSE (Green) (Beyotime, Shanghai, China, # C0051) labeled RT4 cells were co-cultured 1:1 with T24 cells on coverslips for 24 hrs, followed by 4% paraformaldehyde fixation for 10 mins. Subsequently, a Fluorescent In Situ Hybridization Kit (Sangon Biotech) was used for FISH based on provided directions. Cy3-labeled microRNA-155-5p probes (Sequence: 5ʹ-ACCCCTATCACGATTAGCATTAA-3ʹ, Red labeled) were used for this assay. Finally, F-actin was stained with Phalloidin-iFluor™ 405 Conjugate (Blue labeled). Cells were observed under a Laser Confocal Microscopy (Leica, Germany, SP8 STED) and images were captured by the Leica LCS SP8 STED system. The co-culture of T24 cells and RT4 cells and SEM were performed according to the method described previously.Citation8
Quantitative Real-Time PCR Analysis
TRIzol was used to extract 1.5 µg of total RNA from samples based on provided directions, and then a Reverse Transcription System was used to prepare cDNA from this RNA. The Real-Time PCR system with SYBR Green Master Mix was used for qRT-PCR based on provided protocols. Primer sequences applied in the procedures above are listed in .
Table 1 Primers Sequences Applied in the Procedure of Comparing microRNA Distinguished Expressed Between T24 and RT4 Bladder Cancer Cells
Western Blotting
RIPA containing PMSF and phosphatase inhibitor was used for cell lysis, after which a BCA Protein Assay Kit (Beyotime, Shanghai, China, #P0010) was used to measure protein concentrations. Soluble lysates were subjected to SDS-PAGE and transfer to PVDF membranes (Millipore, USA). Blots were blocked with 5% fat-free milk, then probed with primary antibodies at 4°C overnight and at room temperature with secondary antibodies for 90 mins. The blots were visualized via an enhanced chemiluminescence reagent kit and quantified via densitometry.
Cell Proliferation Analysis
A CCK-8 proliferation assay was employed to assess bladder cancer cell proliferation. Cells of each group were incubated in a 96-well plate (5000/well) for 24 hrs. Subsequently, 10 μl of CCK8 reaction solution was added per well for 4 hrs at 37°C. Absorbance at 450 nm was assessed via microplate reader (Thermo Scientific, Shanghai, China, MULTISKAN MK3).Citation23
Cell Cycle Assay
Cells of each group were added to 6-well plates (5×10⁵ cells/well) 24 hrs. Thereafter, cells were collected and fixed overnight in 70% ethanol. Cells were stained using the Cell cycle detection kit (KeyGEN) based on provided protocols, and analyzed via flow cytometry (Beckman, California, USA, Cytoflex S).
Matrigel Invasion Assay
Cell invasion was assessed via Transwell chamber (BD Biosciences, USA, 353097) assay. In brief, 1×10⁵ cells suspended in 100 µl serum-free McCoy’s 5A medium were put into the upper chamber following its having been coated using 5% matrigel. In the lower chamber, 600 µl McCoy’s 5A medium was supplemented with 10% FBS. Following a 24-hrs incubation, non-invasive cells were swabbed away, and invasive cells underwent 4% paraformaldehyde fixation for 15 mins followed by staining using 5% crystal violet for 20 mins. Invading cells were visualized via an inverted microscope (OLYMPUS, Japan, IX51).Citation8
Statistical Analysis
Data are means ± standard deviation (SD). Normally and non-normally distributed data were compared via one-way ANOVAs with LSD tests (for paired values) and Kruskal-Wallis tests, respectively. P < 0.05 was the significance threshold. SPSS v16.0 (SPSS Inc., Chicago, IL) was used for all analyses.
Results
miR-155 was Differentially Expressed in Bladder Cancer Cells in a Tumor Phenotype-Specific Manner
Search of the literature identified 11 microRNAs associated with bladder cancer: miR-9, 21, 155, 221, 503, 512, 517, 566, 639, 644 and 649.Citation12,Citation24 Analysis of differences in miR expression between high (T24) and low (RT4) grade bladder cancer cells using qPCR revealed that only miR-155 was differentially expressed between T24 and RT4 cells. miR-155 was abundantly expressed in T24 cells, but was absent in RT4 cells (7852.25 ± 2844.90 vs 0.82 ± 0.28, p < 0.001).
miR-155 Acts as a Crucial Regulator in Bladder Cancer Cell Proliferation and Invasive Ability
To verify the effects of miR-155 on the proliferative and invasive properties of high-grade bladder cancer cells, we used miR-155 inhibitors and mimics to downregulate and upregulate, respectively, miR-155 expression in T24 cells. After miR-155 inhibitors were transfected into T24 cells, miR-155 levels in T24 cells were decreased, as confirmed by RT-qPCR.
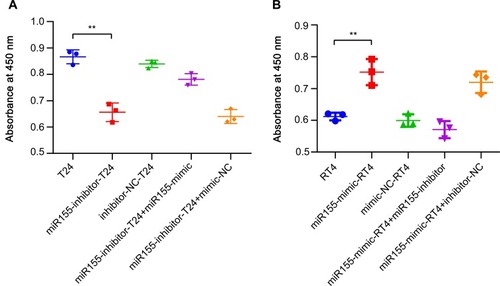
The results of a CCK-8 assay revealed miR-155 inhibition to significantly reduce cell growth compared to untreated T24 cells and inhibitor-NC T24 group (miR155-inhibitor-T24 vs T24, 0.66 ± 0.04 vs 0.87 ± 0.03, p < 0.001, and miR155-inhibitor-T24 vs inhibitor-NC-T24, 0.66 ± 0.04 vs 0.84 ± 0.01, p < 0.001, respectively, ). Upregulation of miR-155 expression by miR-155 mimics in miR-155-inhibitor-T24 cells dramatically restored cell growth (miR155-inhibitor-T24+miR155-mimic group vs miR155-inhibitor-T24 group, 0.78 ± 0.22 vs 0.66 ± 0.04, p < 0.001, ).
Figure 1 MiR-155 sustains the proliferation rates of T24 cells and promotes the proliferation rates of RT4 cells assessed by CCK-8 assay.
Notes: T24 group represents T24 cells; miR155-inhibitor-T24 group represents T24 cells transfected with miR-155 inhibitors; inhibitor-NC-T24 group represents T24 cells transfected with miR-155 inhibitor-NCs; miR155-inhibitor-T24+miR155-mimic group represents T24 cells transfected by miR155-inhibitors and followed by miR155-mimics transfection; miR155-inhibitor-T24+mimic-NC group represents T24 cells transfected by miR-155-inhibitors and followed by miR155-mimic-NCs transfection. The RT4 group represents RT4 cells; miR155-mimic-RT4 group represents RT4 cells transfected by miR155-mimics; mimic-NC-RT4 group represents RT4 cells transfected by miR155-mimic-NCs; miR155-mimic-RT4+miR155-inhibitor group represents RT4 cells transfected by miR-155-mimics and followed by miR-155 inhibitor transfection; miR155-mimic-RT4+inhibitor-NC group represents RT4 cells transfected with miR-155-mimics and followed by miR-155 inhibitor-NCs transfection. Cells in the miR155-inhibitor-T24 group showed a lower proliferation rate compared to the original T24 group (A). Cells in the miR155-mimic-RT4 group showed a higher proliferation rate compared to the original RT4 group (B). ** p < 0.001.
Abbreviation: CCK-8, Cell counting kit-8.
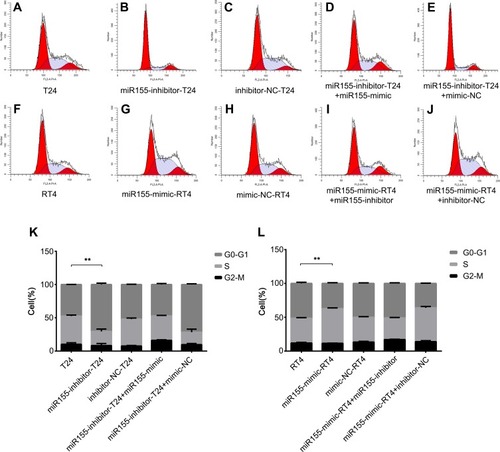
The status of the cell cycle of T24 cells, a hallmark of cell growth, was investigated by flow cytometry analysis. To illustrate the effects not caused by the vector and other factors, we added the C and E group as control (). The results showed that untreated T24 cells were predominantly in the S phase (). However, after transfection with a miR-155 inhibitor, T24 cells were arrested in the G0-G1 phase, and the S phase was much less frequent (G0-G1 phase: 70.47 ± 1.90% vs 47.41 ± 0.21%, p < 0.001, and S phase: 21.21 ± 4.62% vs 42.34 ± 2.17%, p < 0.001, ). Furthermore, analysis of miR155-inhibitor-T24 cells treated with a miR155-mimic showed fewer cells in the G0-G1 phase and more cells in S phase compared to the miR155-inhibitor-T24 group (G0-G1 phase: 47.15 ± 1.55% vs 70.47 ± 1.90%, p < 0.001 and S phase: 36.70 ± 0.70% vs 21.21 ± 4.62%, p < 0.001, ).
Figure 2 MiR-155 induced cell cycle re-distribution in T24 and RT4 cells.
Notes: A, B, C, D and E represent T24 group, miR155-inhibitor-T24 group, inhibitor-NC-T24 group, miR155-inhibitor-T24+miR155-mimic group and miR155-inhibitor-T24+mimic-NC group. F, G, H, I and J represent RT4 group, miR155-mimic-RT4 group, mimic-NC-RT4 group, miR155-mimic-RT4+miR155-inhibitor group and miR155-mimic-RT4+inhibitor-NC group. Compared to the T24 group, more cells were arrested in G0-G1 phase, and less cells were in the S phase in the miR155-inhibitor-T24 group (K). Cells in miR155-mimic-RT4 group accumulated in the S phase and decreased in G0-G1 phase compared to the original RT4 group (L). ** p < 0.001.
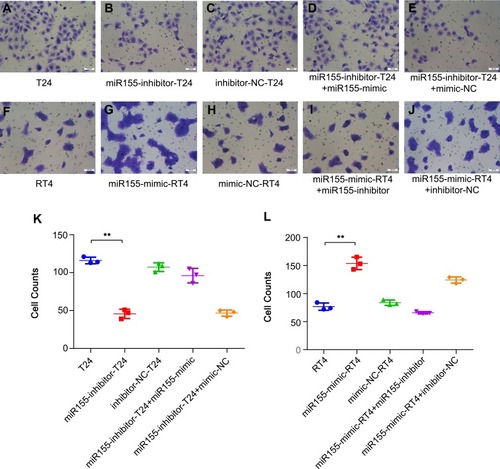
Cell invasive ability in vitro was assessed by Matrigel invasion assays. The number of miR-155-inhibitor-T24 cells that migrated through the matrix was significantly less compared to untreated T24 cells (45.67 ± 6.11 vs 116.00 ± 4.36, p < 0.001, ), whereas more miR-155-inhibitor-T24 + miR-155-mimic cells migrated through the matrix compared to miR-155-inhibitor-T24 cells (96.00 ± 9.54 vs 45.67 ± 6.11, p < 0.001, ). were added as control.
Figure 3 MiR-155 sustains the invasive ability of T24 cells and promotes the invasive ability of RT4 cells assessed by Transwell assay.
Notes: A, B, C, D and E represent T24 group, miR155-inhibitor-T24 group, inhibitor-NC-T24 group, miR155-inhibitor-T24+miR155-mimic group and miR155-inhibitor-T24+mimic-NC group. F, G, H, I and J represent RT4 group, miR155-mimic-RT4 group, mimic-NC-RT4 group, miR155-mimic-RT4+miR155-inhibitor group and miR155-mimic-RT4+inhibitor-NC group. Cell invasive abilities in the miR155-inhibitor-T24 group were decreased compared to the original T24 group (K). Also, cell invasive abilities in the miR155-mimic-RT4 group were significantly increased compared to the original RT4 group (L). Bar = 50 μm. ** p < 0.001.
Inter-Cellular Transfer of miR-155 via TNTs Between T24 and RT4 Cells
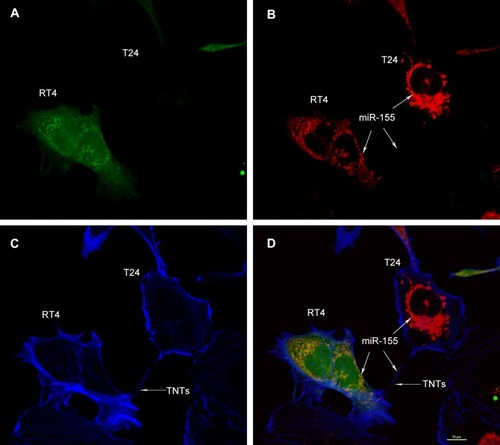
The structure of TNTs was verified by scanning electron microscopy and confocal fluorescence microscopy ( and , respectively). After co-culture with RT4 cells, T24 cells formed TNTs connecting to RT4 cells. Importantly, TNT-mediated transport of miR-155 was observed from T24 cells to RT4 cells using FISH staining (). From the results reported above, miR-155 expression was absent in original RT4 cells. Therefore, the miR-155 staining in RT4 cells in probably derived from intercellular transport of microRNA from T24 cells. Under the confocal fluorescence microscope, red-fluorescence-labeled miR-155 originating from T24 cells could be observed in TNTs (blue labeled F-actin), and subsequently migrated to RT4 cells (green-labeled RT4 cells, ). However, RT4 cells without a TNT connection to T24 cells did not show miR-155 expression.
Figure 4 Micro-structures of TNTs between T24 and RT4 cells observed under SEM.
Notes: TNTs (A, Black arrows) were observed between T24 and RT4 cells. Continuous, membranous, micro-tubular connection between T24 and RT4 cells are shown (B, C and D). The TNTs structures were fragile (D). The diameter of TNTs ranged from 200 to 500 nm, and the lengths of TNTs between T24 and RT4 cells ranged from 20 μm to 1 mm.
Abbreviations: TNTs, tunneling nanotubes; SEM, scanning electron microscopic.
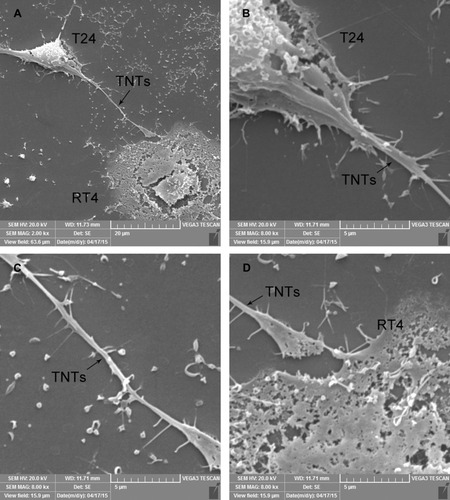
Figure 5 Intercellular transportation of miR-155 from T24 cells to RT4 cells via TNTs.
Notes: RT4 cells were labeled by CFSE (A, Green), and co-cultured with T24 cells for 24 hrs. MiR-155 was labeled by the fluorescent in situ hybridization probe (B, Red). F-actin was labeled by Phalloidin-iFluor™ 405 Conjugate (C, Blue). (A, B and C) were merged as (D). Spontaneous migration of miR-155 (B and D, White arrows) from T24 to RT4 cells via TNTs (C and D) was observed by capturing “double positive” (Red and Green) RT4 cells under fluorescence microscopy (D). Bar = 10 μm.
Abbreviation: miR-155, microRNA-155.
Intercellular miR-155 Trafficking from T24 Cells via TNTs Promotes RT4 Cell Proliferation and Invasive Ability
Since tracing and sorting fluorescence-labeled miR-155-RT4 live cells with a TNT connection to T24 cells is technically very difficult, we used microRNA mimic technology (miR-155 mimics) to study the role of miR-155 in RT4 cells in further detail. Also, miR-155 inhibitors were used to downregulate miR-155 expression as a loss-of-function in control groups. miR-155 expression was significantly increased following mimic transfection in RT4 cells, as confirmed by RT-qPCR.
MiR-155 mimics transfection in RT4 cells was applied to simulate miR-155 trafficking from T24 cells to RT4 cells via TNTs. After miR-155 mimics were transfected into RT4 cells, cell growth was analyzed via CCK-8 assay. RT4 cells transfected with miR-155 mimics (miR155-mimic-RT4 group) exhibited significantly greater growth rates versus untreated RT4 cells or mimic-NC-RT4 cells (0.75 ± 0.04 vs 0.61 ± 0.01, p < 0.001 and 0.75 ± 0.04 vs 0.60 ± 0.02, p < 0.001, respectively, ). Also, silencing of miR-155 in miR155-mimic-RT4 cells dramatically suppressed cell growth, as shown in comparison between miR155-mimic-RT4+miR155-inhibitor cells and the miR155-mimic-RT4 cells (0.57 ± 0.03 vs 0.75 ± 0.04, p < 0.001, ).
Flow cytometry analysis indicated that miR155-mimic-RT4 cells were significantly more in the S phase and less in the G0-G1 phase compared to untreated RT4 cells (S phase: 51.18 ± 1.23% vs 36.63 ± 0.98%, p < 0.001 and G0-G1 phase: 37.24 ± 0.96% vs 51.44 ± 1.87%, p < 0.001, respectively, ). Likewise, miR155-mimic-RT4+miR155-inhibitor cells were significantly less in the S phase, but more in the G0-G1 phase compared to miR155-mimic-RT4 cells (S phase: 31.98 ± 0.84% vs 51.18 ± 1.23%, p < 0.001 and G0-G1 phase: 50.98 ± 0.87% vs 37.24 ± 0.96%, p < 0.001, respectively, ). were added as control.
Matrigel invasion assays revealed that more miR155-mimic-RT4 cells migrated through the matrix than untreated RT4 cells (153.67 ± 11.02 vs 76.67 ± 6.43, p < 0.001, ). On the other hand, less miR155-mimic-RT4+miR155-inhibitor cells migrated through the matrix compared to miR155-mimic-RT4 cells (65.67 ± 2.08 vs 153.67 ± 11.02, p < 0.001, ). were added as control.
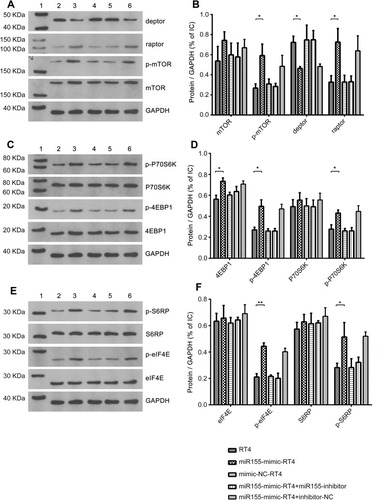
The mTOR Pathway Is Upregulated in RT4 Cells After miR-155 Intercellular Trafficking from T24 Cells
Through predictive algorithms, we were able to detect miR-155 matching sequences in 3ʹUTRs of the DEP domain containing mTOR-interacting protein (Deptor). After miR-155 mimics were transfected into RT4 cells, the expression of Deptor was significantly decreased (RT4 vs miR-155-mimic-RT4, 0.72 ± 0.05 vs 0.46 ± 0.02, p = 0.002, ), while the expression of regulatory-associated protein of TOR (Raptor) was increased (0.33 ± 0.08 vs 0.73 ± 0.13, p = 0.001, ). Despite stable expression of mTOR, the downstream protein of Raptor, the phosphorylation level of mTOR (p-mTOR) was significantly increased after miR-155 mimics transfection (0.27 ± 0.05 vs 0.59 ± 0.11, p = 0.001, ). The phosphorylation levels of two crucial downstream proteins, 4EBP1 and p70s6k, were simultaneously increased following mTOR activation (0.33 ± 0.06 vs 0.50 ± 0.05, p = 0.001 and 0.28 ± 0.04 vs 0.43 ± 0.03, p = 0.001, respectively, ). We further evaluated the expression and phosphorylation level of eIF4e and S6RP, the downstream proteins of 4EBP1 and p70s6k, respectively, which directly regulate cell proliferation and invasive ability. The expression of eIF4e and S6RP were stable, but the phosphorylation levels of eIF4e and S6RP (p-eIF4e and p-S6RP) were significantly increased (0.21 ± 0.02 vs 0.44 ± 0.03, p < 0.001, and 0.28 ± 0.05 vs 0.51 ± 0.11, p = 0.002, respectively, ).
Figure 6 Expressions of Deptor, raptor, mTOR and p-mTOR proteins were analyzed in sub-groups of RT4 cells following miR-155 transfection by Western blotting.
Notes: Lane 1 represents the marker. Lanes 2, 3, 4, 5 and 6 represent groups RT4, miR155-mimic-RT4, mimic-NC-RT4, miR155-mimic-RT4+miR155-inhibitor and miR155-mimic-RT4+inhibitor-NC, respectively (A, C, E). The expression of Deptor was decreased in the miR-155-mimic-RT4 group compared to the original RT4 group. Both expressions of Raptor and p-mTOR were increased in the miR-155-mimic-RT4 group compared to the original RT4 group. However, no statistically significant difference was noted in mTOR levels among the five groups (B). The expression of 4EBP1, p-4EBP1 and p-p70S6K was increased in the miR155-mimic-RT4 group compared to the original RT4 group. However, no statistically significant difference was noted in p70S6K expression level among five groups (D). The expression of both p-eIF4E and p-S6RP was increased in the miR155-mimic-RT4 group compared to the RT4 group. However, no statistically significant difference was noted in eIF4E and S6RP expression levels among the five groups (F). * p < 0.05, ** p < 0.001.
Discussion
MicroRNAs are important for regulating bladder cancer progression and prognosis. Most previous studies focused on the difference in microRNA expression between bladder cancer tissue and normal bladder, with relatively few having studied differential expression of microRNAs between high- and low-grade bladder cancer cells.Citation12 The present quantitative analyses revealed that miR-155 was differentially expressed in a tumor phenotype-specific fashion in different bladder cancer cells.
MiR-155 is a frequently researched functional microRNAs in various cancers.Citation25 The gene coding for miR-155 is in the B-cell integration cluster of chromosome 21.Citation26 The importance of this miRNA in cancer progression is not fully elucidated. In some cancers, miR-155 exerts a tumor suppression function. In melanoma cell lines, miR-155 is down-expressed, and overexpression of miR-155 significantly inhibits melanoma cell proliferation and induced cell apoptosis.Citation27 On the other hand, evidence from several other studies suggests that miR-155 acts as an “OncomiR”, and is important for tumor development. Elevated miR-155 is linked to genomic instability in and prolonged proliferation of malignant leukemia, non-small cell lung cancer, thyroid carcinoma, breast cancer, hepatocarcinoma, colorectal cancer, nasopharyngeal carcinoma, cervical cancer, pancreatic cancer and bladder cancer cells.Citation25,Citation28,Citation29
Furthermore, recent studies found that higher miR-155 levels are significantly linked to poorer bladder cancer outcomes.Citation12,Citation30 Therefore, higher miR-155 levels are possibly a novel biomarker of poor prognosis in bladder cancer.Citation31 In our study, miR-155 was important for sustaining proliferation and invasion of high-grade bladder cancer cells (T24). In our in vitro loss of function study, after miR-155 expression was inhibited by miR-155 inhibitor in T24 cells, the proliferation and invasive abilities were suppressed, but rehabilitated following transfection with miR-155 mimics. Moreover, over-expression of miR-155 in RT4 cells enhanced proliferation, cell cycle progression and invasive ability, but this was reversed by miR-155 silencing.
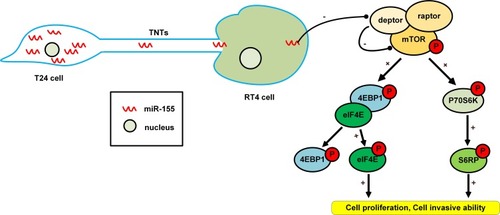
TNTs are newly described cell-to-cell connections that mediate transportation of micro-particles. In a previous study, we found that TNTs could be formed between heterogeneous bladder cancer cell lines, and that mitochondria can use this structure to migrate from high (T24) to low (RT4) grade bladder cancer cells. By receiving mitochondria from T24 cells, RT4 cells acquired enhanced proliferative and invasive ability.Citation8 We found miR-155 to be transported from T24 to RT4 cells via TNTs, and this promoted the invasive ability, cell cycle progression and cell proliferation in RT4 cells. We named this phenomenon as “Acquired Invasive and Proliferative Promotion Evolution (AIPPE)”. This may provide a new explanation to how intra-tumor interactions between heterogeneous cancer cells contribute to Darwinian selection cancer cells towards progression and survival in bladder cancer (Schematic diagram, ).
Figure 7 Schematic diagram of miR-155 intercellular transport and activation of mTOR signaling pathway.
mTOR is an important downstream mediator of cancer cell proliferation, metastasis, motility and autophagy.Citation32 While mTOR regulates these processes through a wide range of mechanisms, two primary mediators of these effects are Dep domain containing mTOR-interacting protein (Deptor) and regulatory-associated protein of TOR (Raptor), which are two main components of mTOR.Citation33,Citation34 Raptor controls mTORC1 kinase activity, while Deptor is the component of both mTORC1 and mTORC2 and negatively regulates the two complexes.Citation35,Citation36 Additionally, the best characterized substrates of mTOR remain eukaryotic translation initiation factor 4E-binding protein 1 (4EBP1) and p70S6 kinase (p70S6K). 4EBP1 and p70S6K phosphorylation are the best means of monitoring mTOR activity.
Since the discovery of Deptor in 2009, insight in its importance for numerous biological processes has continued to evolve over the last decade. Numerous discoveries have shown a significant impact of Deptor on cancer, metabolism and immunity. However, studies on the expression of Deptor in different human malignancies have shown conflicting results: Deptor is overexpressed in thyroid cancer, myelomas and taxol-resistant ovarian cancer cell lines, while it is downregulated in bladder, prostate and cervix cancer.Citation37–Citation39
Previous reports indicate that the 3ʹ-UTR sequence in Deptor is the binding site for miR-155, and overexpression of miR-155 downregulates Deptor expression in breast cancer cells and leukemia.Citation40,Citation41 By using microRNA mimics technology to simulate miR-155 transported from T24 to RT4 cells via TNTs, our study shows overexpression of miR-155 in RT4 cells to down-regulate Deptor expression and induce increased phosphorylation of downstream mTOR proteins associated with translation via the classical mTOR pathway activation. Activation of mTOR in RT4 cells leads to enhanced 4EBP1 and p70S6K phosphorylation. Unphosphorylated 4EBP1 is able to bind the translational initiation factor eIF4E and prevent protein synthesis.Citation42 In our study, phosphorylated 4EBP1 could not bind and inhibit eIF4E, leading to free eIF4E accumulation and activation. Phosphorylated eIF4E (p-eIF4E) and S6RP (p-S6RP) upregulated the translation of proteins, leading to cell cycle progression, cell growth and increased invasive ability ().
This study has multiple limitations. At first, tracing and sorting live cells with microRNA labeling was technically difficult and therefore, microRNA mimics were used to simulate TNTs-mediated miR-155 transport from T24 cells to RT4 cells. Thus, the levels of miR-155 in microRNA mimic cells may differ from TNTs mediated miR-155-RT4 cells, and the exact changes in cell signaling in RT4 cells may differ from our current study. Second, it remains unknown what drives the transport of miR-155 from T24 cells to RT4 cells. Finally, the invasive and proliferative ability promoted by TNTs transport could be attributed partly to other factors, since miR-155 seems to be only one of the particles that can migrate between cells using TNTs.
Conclusion
miR-155 is differentially expressed between heterogeneous bladder cancer cells. Intercellular TNTs-mediated transport of miR-155 can promote bladder cancer cell reprogramming through Deptor-mTOR signal pathway activation.
Disclosure
The authors report no conflicts of interest in this work.
Acknowledgment
This project was supported by the National Natural Sciences Foundation of China (No. 81302219).
References
- Marusyk A, Almendro V, Polyak K. Intra-tumour heterogeneity: a looking glass for cancer? Nat Rev Cancer. 2012;12(5):323–334. doi:10.1038/nrc326122513401
- DeSantis CE, Lin CC, Mariotto AB, et al. Cancer treatment and survivorship statistics, 2014. CA Cancer J Clin. 2014;64(4):252–271. doi:10.3322/caac.v64.424890451
- Rustom A, Saffrich R, Markovic I, Walther P, Gerdes HH. Nanotubular highways for intercellular organelle transport. Science. 2004;303(5660):1007–1010. doi:10.1126/science.109313314963329
- Guescini M, Leo G, Genedani S, et al. Microvesicle and tunneling nanotube mediated intercellular transfer of g-protein coupled receptors in cell cultures. Exp Cell Res. 2012;318(5):603–613. doi:10.1016/j.yexcr.2012.01.00522266577
- Lou E, Fujisawa S, Morozov A, et al. Tunneling nanotubes provide a unique conduit for intercellular transfer of cellular contents in human malignant pleural mesothelioma. PLoS One. 2012;7(3):e33093. doi:10.1371/journal.pone.003309322427958
- Rolf HJ, Niebert S, Niebert M, Gaus L, Schliephake H, Wiese KG. Intercellular transport of Oct4 in mammalian cells: a basic principle to expand a stem cell niche? PLoS One. 2012;7(2):e32287. doi:10.1371/journal.pone.003228722359678
- Thayanithy V, Dickson EL, Steer C, Subramanian S, Lou E. Tumor-stromal cross talk: direct cell-to-cell transfer of oncogenic microRNAs via tunneling nanotubes. Transl Res. 2014;164(5):359–365. doi:10.1016/j.trsl.2014.05.01124929208
- Lu J, Zheng X, Li F, et al. Tunneling nanotubes promote intercellular mitochondria transfer followed by increased invasiveness in bladder cancer cells. Oncotarget. 2017;8(9):15539–15552. doi:10.18632/oncotarget.1469528107184
- Stefani G, Slack FJ. Small non-coding RNAs in animal development. Nat Rev Mol Cell Biol. 2008;9(3):219–230. doi:10.1038/nrm234718270516
- He L, Thomson JM, Hemann MT, et al. A microRNA polycistron as a potential human oncogene. Nature. 2005;435(7043):828–833. doi:10.1038/nature0355215944707
- Volinia S, Calin GA, Liu CG, et al. A microRNA expression signature of human solid tumors defines cancer gene targets. Proc Natl Acad Sci U S A. 2006;103(7):2257–2261. doi:10.1073/pnas.051056510316461460
- Catto JW, Miah S, Owen HC, et al. Distinct microRNA alterations characterize high- and low-grade bladder cancer. Cancer Res. 2009;69(21):8472–8481. doi:10.1158/0008-5472.CAN-09-074419843843
- Ma L, Young J, Prabhala H, et al. miR-9, a MYC/MYCN-activated microRNA, regulates E-cadherin and cancer metastasis. Nat Cell Biol. 2010;12(3):247–256.20173740
- Park SK, Park YS, Ahn JY, et al. MiR 21-5p as a predictor of recurrence in young gastric cancer patients. J Gastroenterol Hepatol. 2016;31(8):1429–143526824898
- Forrest AR, Kanamori-Katayama M, Tomaru Y, et al. Induction of microRNAs, mir-155, mir-222, mir-424 and mir-503, promotes monocytic differentiation through combinatorial regulation. Leukemia. 2010;24(2):460–466.19956200
- Zhang KL, Zhou X, Han L, et al. MicroRNA-566 activates EGFR signaling and its inhibition sensitizes glioblastoma cells to nimotuzumab. Mol Cancer. 2014;13:63.24650032
- Lin Z, Sun L, Chen W, et al. miR-639 regulates transforming growth factor beta-induced epithelial-mesenchymal transition in human tongue cancer cells by targeting FOXC1. Cancer Sci. 2014;105(10):1288–1298.25130698
- Sikand K, Singh J, Ebron JS, Shukla GC. Housekeeping gene selection advisory: glyceraldehyde-3-phosphate dehydrogenase (GAPDH) and beta-actin are targets of miR-644a. PLoS One. 2012;7(10):e4751023091630
- Scheffer AR, Holdenrieder S, Kristiansen G, von Ruecker A, Muller SC, Ellinger J. Circulating microRNAs in serum: novel biomarkers for patients with bladder cancer? World J Urol. 2014;32(2):353–358.23266581
- Port M, Glaesener S, Ruf C, et al. Micro-RNA expression in cisplatin resistant germ cell tumor cell lines. Mol Cancer. 2011;10:5221575166
- Hromadnikova I, Kotlabova K, Ondrackova M, et al. Circulating C19MC microRNAs in preeclampsia, gestational hypertension, and fetal growth restriction. Mediators Inflamm. 2013;2013:186041.24347821
- Ergun S, Tayeb TS, Arslan A, et al. The investigation of miR-221-3p and PAK1 gene expressions in breast cancer cell lines. Gene. 2015;555(2):377–381.25447917
- Zhu FQ, Zeng L, Tang N, et al. MicroRNA-155 downregulation promotes cell cycle arrest and apoptosis in diffuse large B-Cell lymphoma. Oncol Res. 2016;24(6):415–427. doi:10.3727/096504016X1468503410347328281962
- Catto JW, Alcaraz A, Bjartell AS, et al. MicroRNA in prostate, bladder, and kidney cancer: a systematic review. Eur Urol. 2011;59(5):671–681. doi:10.1016/j.eururo.2011.01.04421296484
- Chen Z, Ma T, Huang C, Hu T, Li J. The pivotal role of microRNA-155 in the control of cancer. J Cell Physiol. 2014;229(5):545–550. doi:10.1002/jcp.v229.524122356
- Calame K. MicroRNA-155 function in B cells. Immunity. 2007;27(6):825–827. doi:10.1016/j.immuni.2007.11.01018093533
- Wan G, Xie W, Liu Z, et al. Hypoxia-induced MIR155 is a potent autophagy inducer by targeting multiple players in the MTOR pathway. Autophagy. 2014;10(1):70–79. doi:10.4161/auto.2653424262949
- Van Roosbroeck K, Fanini F, Setoyama T, et al. Combining Anti-Mir-155 with chemotherapy for the treatment of lung cancers. Clin Cancer Res. 2017;23(11):2891–2904. doi:10.1158/1078-0432.CCR-16-102527903673
- Pai J, Hyun S, Hyun JY, et al. Screening of Pre-miRNA-155 binding peptides for apoptosis inducing activity using peptide microarrays. J Am Chem Soc. 2016;138(3):857–867. doi:10.1021/jacs.5b0921626771315
- Wang H, Men CP. Correlation of increased expression of MicroRNA-155 in bladder cancer and prognosis. Lab Med. 2015;46(2):118–122. doi:10.1309/LMWR9CEA2K2XVSOX25918190
- Robertson AG, Kim J, Al-Ahmadie H, et al. Comprehensive molecular characterization of muscle-invasive bladder cancer. Cell. 2017;171(3):540–556. doi:10.1016/j.cell.2017.09.00728988769
- Dunlop EA, Tee AR. Mammalian target of rapamycin complex 1: signalling inputs, substrates and feedback mechanisms. Cell Signal. 2009;21(6):827–835. doi:10.1016/j.cellsig.2009.01.01219166929
- Sengupta S, Peterson TR, Sabatini DM. Regulation of the mTOR complex 1 pathway by nutrients, growth factors, and stress. Mol Cell. 2010;40(2):310–322. doi:10.1016/j.molcel.2010.09.02620965424
- Aylett CH, Sauer E, Imseng S, et al. Architecture of human mTOR complex 1. Science. 2016;351(6268):48–52. doi:10.1126/science.aaa387026678875
- Peterson TR, Laplante M, Thoreen CC, et al. DEPTOR is an mTOR inhibitor frequently overexpressed in multiple myeloma cells and required for their survival. Cell. 2009;137(5):873–886. doi:10.1016/j.cell.2009.03.04619446321
- Caron A, Briscoe DM, Richard D, Laplante M. DEPTOR at the nexus of cancer, metabolism, and immunity. Physiol Rev. 2018;98(3):1765–1803. doi:10.1152/physrev.00064.201729897294
- Alayev A, Salamon RS, Berger SM, et al. mTORC1 directly phosphorylates and activates ERalpha upon estrogen stimulation. Oncogene. 2016;35(27):3535–3543. doi:10.1038/onc.2015.41426522726
- Catena V, Fanciulli M. Deptor: not only a mTOR inhibitor. J Exp Clin Cancer Res. 2017;36(1):12. doi:10.1186/s13046-016-0484-y28086984
- Rogers-Broadway KR, Kumar J, Sisu C, et al. Differential expression of mTOR components in endometriosis and ovarian cancer: effects of rapalogues and dual kinase inhibitors on mTORC1 and mTORC2 stoichiometry. Int J Mol Med. 2019;43(1):47–56. doi:10.3892/ijmm.2018.396730387804
- Martin EC, Rhodes LV, Elliott S, et al. microRNA regulation of mammalian target of rapamycin expression and activity controls estrogen receptor function and RAD001 sensitivity. Mol Cancer. 2014;13:229. doi:10.1186/1476-4598-13-22925283550
- Jablonska E, Gorniak P, Prusisz W, et al. Downregulation of deptor by MiR-155 promotes cell survival through activation of PI3K/AKT and NFkB Signaling in ABC-type diffuse large B-Cell lymphomas. Blood. 2016;128(22):1761. doi:10.1182/blood.V128.22.1761.1761
- Krishan S, Richardson DR, Sahni S. Adenosine monophosphate-activated kinase and its key role in catabolism: structure, regulation, biological activity, and pharmacological activation. Mol Pharmacol. 2015;87(3):363–377. doi:10.1124/mol.114.09581025422142