 ?Mathematical formulae have been encoded as MathML and are displayed in this HTML version using MathJax in order to improve their display. Uncheck the box to turn MathJax off. This feature requires Javascript. Click on a formula to zoom.
Abstract
This work considers the adhesion of cells to a nanorough titanium implant surface with sharp edges. The basic assumption was that the attraction between the negatively charged titanium surface and a negatively charged osteoblast is mediated by charged proteins with a distinctive quadrupolar internal charge distribution. Similarly, cation-mediated attraction between fibronectin molecules and the titanium surface is expected to be more efficient for a high surface charge density, resulting in facilitated integrin mediated osteoblast adhesion. We suggest that osteoblasts are most strongly bound along the sharp convex edges or spikes of nanorough titanium surfaces where the magnitude of the negative surface charge density is the highest. It is therefore plausible that nanorough regions of titanium surfaces with sharp edges and spikes promote the adhesion of osteoblasts.
Introduction
The cell and tissue response to the composition of an implant surface, and especially to its chemical and physical features, ultimately determines the clinical success of the implant.Citation1 The functional activity of cells in contact with a biomaterial is determined by the material characteristics of the surface, as well as by the surface topography.Citation2 The most widely used material in a gamut of medical applications is titanium,Citation1 because it is nontoxic and is not rejected by the body. Principally, titanium owes its excellent biostability and biocompatibility characteristics to the thin, hard, adherent titanium dioxide film naturally formed on its surface.
Osteoblast/titanium adhesion depends on the surface characteristics of titanium which may be described according to local mesoscale, microscale, and nanoscale patterns of topography, charge distribution, and chemistry.Citation3–Citation11 In the past, different studies of implant surface modification have been performed mainly at the micrometer scale in order to improve the attachment of osteoblasts (bone-forming cells) to the implant surface.Citation3,Citation12–Citation15 Recently, the titanium surface was modified by a self-assembled layer of vertically oriented TiO2 nanotubes with diameters between 15 nm and 100 nm.Citation16 It was shown that adhesion, spreading, growth, and differentiation of cells on such vertically aligned TiO2 nanotube surfaces depend on the diameter of the nanotubes.Citation16 A nanotube diameter of 15 nm seemed () to be more appropriate for differentiation of mesenchymal, endothelial, and smooth muscle cells in comparison to 70–100 nm nanotubes and to amorphous (smooth) TiO2 surfaces.Citation17 These results indicate that the surface nanostructure of an implant is a decisive factor in surface cell adhesion and growth, and is not confined to a specific cell type.Citation17,Citation18 In line with these results, it has been shown recently that decreased width of the nanorough regions resulted in a significant reduction in the number of osteoblast cells adhering to the structured surface.Citation19 Osteoblast morphology in the smallest nanorough region was rounder and had less diffuse F-actin filaments, while filopods extending from the cells remained near their origin.Citation19 The above-mentioned findings are valid generally for the cell response to different topographical nanorough surfaces,Citation16,Citation19–Citation21 and could in the future have an important impact on the design and composition of implant surfaces. Therefore, these findings must be connected to the increased strength of attractive interactions per unit area in nanorough implant surfaces.
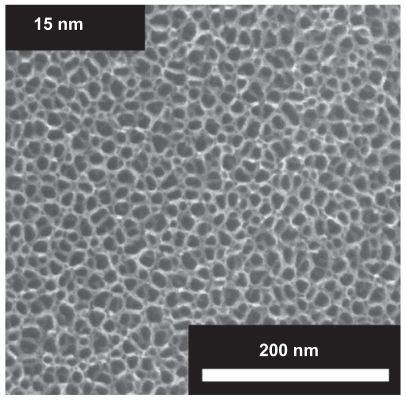
Figure 1 Electron microscope images of the surfaces of vertically aligned TiO2 nanotubes of 15 nm diameter. The inner and outer diameter of a small diameter nanotube are approximately 10 and 15 nm.
The question of how cells detect and respond to the nanofeatures of an implant surface is still largely unresolved. Citation6 In this work we suggest that the increased surface charge density and electric field strength at highly curved edges of a titanium nanorough surfaceCitation16,Citation19–Citation21 (such as a rectangular vertically oriented TiO2 nanotube surface) could make a major contribution to the increased strength of osteoblast adhesion. The proposed explanation is based on a recently suggested mechanism of protein mediated attractive interaction between a negatively charged titanium surface and negatively charged osteoblasts,Citation15 as well as on cation-mediated binding of fibronectin.Citation22 Therefore the electric field strength near the highly curved edge of a titanium surface was estimated in the limit of very sharp edges. Then, equilibrium and dynamic models were constructed to test the effects of integrin molecule-binding energy, aggregation energy, and intrinsic curvature on the integrin-mediated adhesion of osteoblasts to nanorough and smooth titanium surfaces.
Adhesion of proteins to a titanium surface
When we discuss osteoblast surface interactions, it ultimately concerns an interaction between osteoblasts and surface-bound proteins or other biomolecules.Citation11 It was recently suggested that the contact between the membrane of the osteoblasts and the titanium surface is established in two steps. Firstly, the osteoblast cell membrane makes a nonspecific contact due to electrostatic forces,Citation15 followed by a second step where specific binding involving integrin assembly into focal contacts takes place.Citation16,Citation23,Citation24
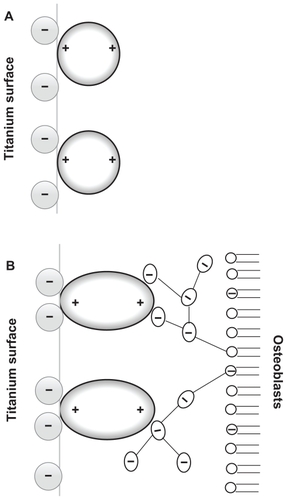
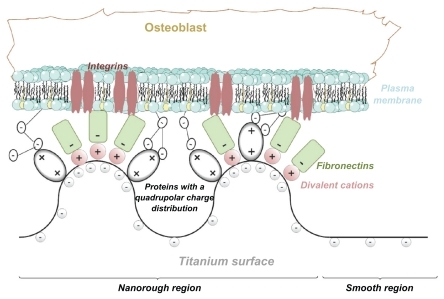
Since osteoblasts are negatively charged,Citation25 they are electrostatically repelled by the negatively charged titanium surface as long as some other attractive forces are not present in the system. Recently, a possible mechanism of osteoblast adhesion to the implant surface was proposed on the assumption that positively charged proteinsCitation25,Citation26 or proteins with positively charged tips, ie, a quadrupolar internal charge distributionCitation15 attached to the negatively charged implant surface, serve as a substrate for the subsequent attachment of negatively charged osteoblasts. In order to predict the orientation of proteins with positively charged tips near a charged implant surface, Monte Carlo simulations of the distribution and the orientation of charged spheroidal proteins in the vicinity of a charged titanium surface were performed.Citation15 It was shown that for high enough absolute values of the charge density of the titanium surface, the proteins with positively charged tips are concentrated close to the charged surface and oriented in a direction perpendicular to the charged surfaceCitation15 (). It was also shown that a high negative surface charge density of the titanium surface and a high effective quadrupolar moment of the protein (ie, distinctive internal quadrupolar charge distribution) can turn the repulsive force between negatively charged Ti and osteoblast surfaces into an attractive force.Citation15 The corresponding attractive force is also called the bridging force.Citation15,Citation27 The origin of attractive interactions between two negatively charged surfaces lies in the electrostatic attraction between the positively charged domains on the tips of the titanium surface-bound proteins and the negative charges of the opposite osteoblast membrane ().Citation15,Citation27
Figure 2 (A) Schematic figure of the orientation of quadrupolar proteins with positively charged tips attached to a negatively charged titanium surface.Citation15 (B) Schematic figure of a quadrupolar protein mediated attraction between a negatively charged titanium implant surface (left) and a negatively charged osteoblast surface (see also).Citation15 Two adjacent negatively charged titanium and osteoblast surfaces without bound proteins with a quadrupolar internal charge distribution end repel each other, while for a high enough concentration of bound proteins with a quadrupolar internal charge distribution the force between two negatively charged surfaces becomes strongly attractive,Citation15 leading to an equilibrium distance approximately equal to the dimension of the proteins.
Nonzero effective internal quadrupolar charge distribution does not exclude the presence of other charged protein groups (usually in pairs of positive and negatively charged groups) between the two positively charged protein tips. A typical example of such a bridging protein with positively charged tips is β2-GPI protein which may induce strong attraction between negatively charged surfaces.Citation27,Citation28
In accordance with the above suggested mechanism of protein-mediated interaction between negatively charged osteoblasts and a negatively charged titanium surface, many studies in the past indicated that increased negative surface potential of the titanium implant promotes osteoblast adhesion and consequently new bone formation.Citation25,Citation29,Citation30
In line with the predicted increased strength of protein-mediated bridging attractive interaction between a titanium surface and an osteoblast with an increased surface charge density (and electric field strength),Citation15 we propose that the increased surface charge density and increased electric field strength at the sharp edges of a nanorough titanium surface may promote protein-mediated adhesion of osteoblasts due to the increased accumulation of proteins with quadrupolar internal charge distribution ().
Figure 3 (A) Schematic figure of the adhesion of proteins with quadrupolar internal charge distribution at the sharp edge of a titanium surface. Due to the internal quadrupolar charge distribution, the proteins exhibit strong orientation in the direction of the surface normal vector (see also).Citation15 (B) Schematic figure of divalent cation-mediated adhesion of negatively charged fibronectin molecules to the highly curved edge of a titanium surface.
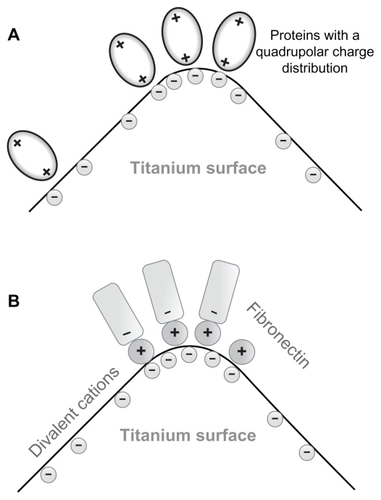
The increased electric field strength and surface charge density of nanorough titanium regions with sharp edges and spikes may also promote divalent cation-mediated adsorption of fibronectin to a negatively charged titanium surface, and in this way also the integrin-mediated adsorption of cells to these titanium regions. Fibronectin is an extracellular glycoprotein with a critical role in the process of cell adhesion.Citation22 A hallmark of fibronectin function is its characteristic assembly into filaments and fibers to form an insoluble matrix which functions as a scaffolding onto which extracellular domains of integrin molecules from the cell membrane are attachedCitation31 (see also).Citation32 Fibronectin is negatively charged at physiological values of pH.Citation33 The increase in salt concentration leads to a reduced electrostatic repulsion between the fibronectin and the negatively charged surface.Citation22 Studying the effect of some divalent metallic cations revealed an enhancement of fibronectin adsorption to a negatively charged mica surface.Citation22 The origin of this effect may be bridging and direct interaction forces.Citation22,Citation29,Citation34,Citation35 Accordingly, it was indicated recently that an increase in the negative net charge of a titanium surface promotes the fibronectin-mediated binding of osteogenic cell receptors.Citation36 All these results suggest that a negatively charged titanium surface can play a prominent role in the osteointegration of metallic implant materials.Citation36 We therefore propose that as a result of the increased electric field strength and increased surface charge density at sharp edges and spikes of various nanorough titanium surfaces, the divalent cation-mediated adhesion of fibronectin is increased (). However, since the surface charge density at very sharp edges of a nano-rough titanium surface could be very high, due to the dramatic increase of the corresponding coupling constant, monovalent cations could also not be excluded as bridging ions.Citation34
To conclude, our suggestion is that the increased surface charge density and corresponding electric field strength at the highly curved edges of a nanorough titanium surface is important for the efficient adhesion of cells. Based on the above arguments indicating the importance of the surface charge density and the electric field strength of a titanium surface in cell adhesion to the titanium surface, in the following the surface charge density and electric field strength are estimated for different curvatures of sharp edges on a titanium surface.
Electric field strength at highly curved edges of a titanium surface
In this section the edge of a titanium surface is considered in the limit of very high curvature. For simplicity, we assume that the curvature of the metal surface in a perpendicular direction along the contour is constant. Then the convex edges of finite curvature are also considered by taking into account water ordering and the finite size of ions as well.
Convex case
In the limit of a very high curvature of a convex edge (), which mathematically represents a singularity, the general solution of the Laplace equation in cylindrical coordinates r and ϕ:Citation37
Figure 4 (A) Schematic figure of the convex edge of a titanium surface in the limit of a very high curvature. (B) Schematic figure of the concave edge (corner) of a titanium surface in the limit of a very high curvature.
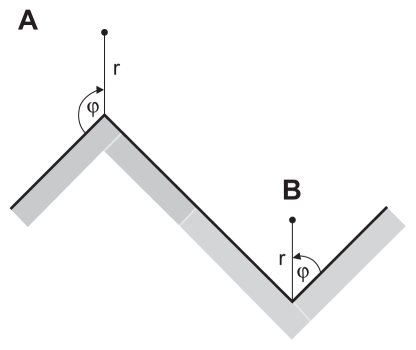
where we took into account the equilibrium (boundary) conditions (the electric potential is constant over the whole conducting metal surface), ie, φ = φ0 for all r ≥ 0 when ϕ = 0 and ϕ = 3π/2 (see also ). In the close vicinity of the edge (where r = 0), ie, for small enough values of r, only the first term of the infinite sum in EquationEq. (2)(2) is important. Hence, near r = 0 () the electric potential is approximately (up to the first order term):
where A1 is a constant which can be determined from the additional boundary condition. For σ< 0 the value of A1 > 0. The electric field strength E = −∇φis:
where er and eϕ are unit vectors. It can be seen from EquationEq. (4)(4) that the electric field diverges at the surface edge (r → 0) and then decreases with distance from the edge and distance from the surface. The dependence of the electric field along the symmetry axis (ϕ = 3π/4) is:
It follows from the boundary conditions at both metal surfaces and EquationEq. (4)(4) that the surface charge densities at both surfaces, ie, at ϕ = 0 and at ϕ = 3π/2 (for r ≥ 0 close to r = 0), are equal to:
This means that the surface charge density σ(r) is finite at both metal surfaces forming the edge, but becomes singular as r → 0 (ie, at the edge), similar to the electric field. To conclude, the surface charge density is very large (infinite) at the infinitely sharp metal edge and then decreases along both surfaces with increasing distance from the edge.
Concave case
A similar procedure as in the case of a convex edge for a concave edge (ie, corner) in the limit of very high curvature () gives the dependence of electric field along the symmetry axis (ϕ = π/4):
and the surface charge densities at the two surfaces forming the corner, ie, at ϕ = 0 and at ϕ = π/2 in the close vicinity of the corner:
This means that at an infinitely sharp corner (concave edge), the surface charge density σis zero and then increases with increasing distance from the corner along both surfaces. This explains why the electric field strength increases along the symmetry axis as a function of the distance from the corner (EquationEq. (7)(7) ).
For finite values of the curvature radius of the convex edge or the concave edge (corner), the above-described effect of variation of σ over the metal surface is expected to be less pronounced (see next subsection), ie, the surface charge density of the convex edge would not diverge and would decrease in magnitude with the increasing curvature radius. In contrast, the surface charge density and the electric field strength would monotonously increase with increasing curvature radius of the corner (concave edge).
Finite curvature
As shown in the previous two subsections, sharp titanium edges mathematically represent a singularity. Yet, no physical object has perfect corners but some degree of roundness. Therefore, in this subsection the sharp edges are modeled as highly curved convex regions of different radius. The contact of water with biological surfaces has a profound influence on both the thermodynamics and kinetics at biointerfaces; therefore it is a safe prediction that it will be a major topic in biological surface science for a decade or more ahead.Citation11 Hence, we consider a titanium surface in contact with an electrolyte solution where the orientational ordering of water near the implant titanium surface is also taken into account.Citation38–Citation41
Next, we calculated the electric field at the highly curved edge of constant curvature radius R, which is a generalization of the model presented in the previous subsections (see also ). We solved numerically the Langevin–Bikerman equation (EquationEq. (B.7)(B.7) ), given in Appendix B by using the Comsol Multiphysics 3.5a Software program package (Stockholm, Sweden), by taking into account the boundary conditions EquationEq. (B.5)
(B.5) and EquationEq. (B.10)
(B.10) (see Appendix B). However, unlike the planar case solved in Appendix B, to avoid numerical problems the relative permittivity ɛr (r), in general defined by EquationEq. (B.9)
(B.9) from Appendix B, was here approximated by a step function with the value ɛor in the region rsurf ≤ r ≤ (r + a), where ɛor was calculated for the corresponding value of σ (given for the region far away from the edge) from EquationEq. (B.9)
(B.9) for planar geometry at x = 0 (see ). In the region r ≥ (r + a) we assumed the bulk value of permittivity, ie, 78.5.
In accordance with the results in the previous subsections (calculated in the limit of very high curvature of the edge), it can be seen in that the calculated surface charge density at the top of the surface of the convex titanium edge (σtop) in the direction of the symmetry axis ϕ = 3π/4 (see also ) increases with increasing curvature of the edge 1/R, where R is the curvature radius. On the contrary, in the concave case (corner) (see also ), exactly the opposite behavior is observed. This may explain why the cells are most strongly bound along the sharp convex edges or spikes of nanostructured titanium surfacesCitation19 where the surface charge density and electric field strength are the highest. Also this may offer a possible explanation for the increased divalent cation-mediated fibronectin adhesion and quadrupolar protein-mediated adhesion of an osteoblast on vertically aligned TiO2 15 nm nanotubes with respect to the adhesion to a smooth titanium surface.Citation16–Citation18
Table 1 Comparison of the surface charge densities at the top of a surface of the convex titanium edge (σtop) in the direction of the symmetry axis ϕ = 3π/4 (see also ) and at the corner of a concave surface (σcor) in the direction of the symmetry axis ϕ = π/4 (see also ) calculated for different values of the edge (corner) curvature radius (R) as described in the text
Clustering of integrin molecules in nanorough titanium regions with highly curved edges
Previous studies have been shown that decreasing the width of the nanorough regionsCitation19 or a reducing the degree of nanostructuration of the titanium surfaceCitation16–Citation18 significantly reduced the number of osteoblast cells adhering to the structured surface. Yet the underlying mechanism that drives the adhesion of a cell membrane to nanorough titanium regions is not fully clear.
In what follows, a dynamic model is constructed to test the effects of the binding energy, aggregation energy, and spontaneous curvature of membrane inclusions (eg, integrins) on adhesion to nanorough titanium surfaces. In our model, the key function of the membrane inclusions is their capacity to stabilize and induce membrane protrusions, while the negative adhesion energy drives the initial growth of membrane protrusions.
Previous theoretical studies demonstrated that the aggregation of membrane inclusions of positive intrinsic curvature (ie, outward membrane bending) can be coupled to membrane protrusive forces originating from the adhesion to the extracellular matrix and from the polymerization of actin filaments.Citation15,Citation42 This theory is based on previous experimental data revealing that a large family of curved membrane proteins, for example, those containing Bin/Amphiphysin/Rvs (BAR) and IRSp53-Missing-In-Metastasis (IMD) domains, can induce concave or convex curvatures.Citation44 Furthermore, these curved proteins may form membrane-bound complexes that include actin-nucleating components,Citation45,Citation46 which have been observed to induce cellular protrusions.Citation47,Citation48
Above, it is suggested that due to an increased surface charge density and increased electric field strength at sharp edges and spikes of nanorough titanium surfaces, the cation-mediated adhesion of fibronectin is increased (). The increased fibronectin accumulation in the nanorough regions of a titanium surface with an increased surface charge density and increased electric field strength can facilitate the adhesion and aggregation of integrin molecules and therefore can induce the formation of focal adhesion complexes.Citation32 In the following, we present a simple equilibrium model of the aggregation and adhesion of integrin molecules in order to implicitly model nanorough titanium regions with highly curved edges ().
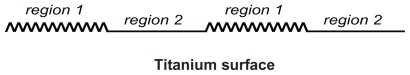
Figure 5 Schematic figure of two regions of a titanium surface: nanorough region 1 with high affinity for integrin molecules, and a smooth region 2 with low affinity for integrin molecules.
Equilibrium model
The basic assumption of our model is that integrin molecules which adhere on the nanostructured (nanorough) regions (region 1) of a titanium surface with an increased surface charge density and an increased density of bound fibronectins are in equilibrium with those integrin molecules in regions with a lower surface charge density (and lower electric field strength) and a lower area density of bound fibronectin molecules (region 2) ().
The Helmholtz free energy of integrin molecules in the first (i = 1) and second region (i = 2) can be derived within lattice statistics from the corresponding canonical partition function Fi = −kT lnQi (see also):Citation49,Citation50
where
Here −wi is the negative binding energy of a single integrin molecule in the i-th region (wi > 0), Ωi is the direct-interaction (attraction) Bragg–Williams constant (Ωi > 0), c is the number of the nearest neighbor integrin molecules, kT is the thermal energy, Ni is the number of integrin molecules in the i-th region and Mi is the number of lattice sites in the i-th region. It is then assumed that Mi >> Ni, and, as a result, the chances of interaction between integrin molecules is small and Ωi becomes zero. It is also assumed that w1 > w2. The system free energy Ftot = F1 + F2 is:
and minimization with respect to n1 yields:
where n1 = N1/M1 and n2 = N2/M2 are the relative densities of integrin molecules in region 1 with strong adhesion and region 2 with weak adhesion, respectively, ϕi = Mi/M, M = M1 + M2, Φ = φ1/φ2 = M1/M2, Δw = w1 − w2 and
. In the above minimization procedure, the conservation equation for the total number of bound integrin molecules N = N1 + N2 was taken into account in the form:
where n0 = N/M2. Using the definition B = Φ + βw + n0 − n0βw, the solution of EquationEq. (12)(12) is given in the form:
EquationEq. (14)(14) predicts an increase of n1 with increasing Δw. In the limit of very large Δw (when βw → 0), ie, in the limit of very strong binding in the nanorough region 1, EquationEq. (14)
(14) predicts the complete accumulation of integrin molecules in region 1: n1 → N/M1.
Dynamic model
To shed light on the dynamics of membrane growth on nanorough titanium surfaces (eg, TiO2 nanotubes), we constructed a model based on the Helfrich free energy, which also included the binding energy of integrin molecules to the titanium surface, as well as the nearest-neighbor attractive interaction energies between integrin molecules. The difference from the equilibrium model is that in the dynamic model we take into account the direct-interaction Bragg–Williams term and membrane bending energy. Unlike the equilibrium model, the nonhomogeneous lateral distribution of integrins of explicitly modeled. The intrinsic shape of the integrin molecules is taken into account in the spontaneous curvature of the Helfrich expression for membrane bending energy.
The model described below is an extension of previous theoretical models.Citation15,Citation42,Citation43,Citation51 The basic equations of motion of the membrane contour and the time dependence of the nonhomogeneous lateral density of integrin molecules are derived in Appendix A.
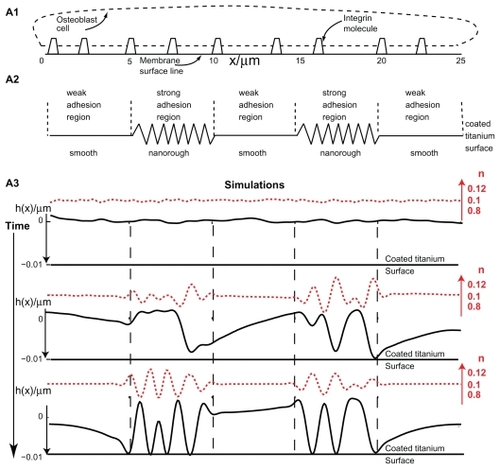
The shapes explored in this model describe a segment of the cell (osteoblast) outer contour, where the membrane is initially flat (). This modeled membrane geometry is under the constraint of translational symmetry. Moreover, we assume that the membrane curvature along the perpendicular direction of the contour is roughly constant, and thus enters our calculation as a modified membrane tension. We take into account only a segment of the osteoblast cell contour (). The nanorough and smooth titanium surfaces are both modeled as flat surfaces, while the influence of their surface topography on the osteoblast binding is implicitly taken into account by considering different binding energy potentials. For the sake of simplicity we assume that the initial protein bridging forces (), as well as the cation-mediated adhesion of integrins (), are much stronger in nanorough regions than in smooth titanium regions (ie, w1 >> w2, w2 = 0, see also previous section) and the binding of integrins is possible only in nanorough regions ().
Figure 6 Effects of nanorough and smooth titanium regions on membrane growth. The modeled membrane segment that belongs to an osteoblast cell is a nearly straight membrane contour with embedded integrin molecules (A1). Nanorough titanium regions are separated by smooth titanium regions (A2). The implicit effect of the smooth and nanorough regions is incorporated into the free energy by having a zero integrin binding potential above the smooth titanium regions and nonzero integrin binding potential above the nanorough titanium regions. In addition, it was assumed that the integrin binding potential in the 10 nm thick layer above the nanorough titanium regions for simplicity was constant, ie, w ns = 0.011 g s−2. Time dynamics of the membrane shape (h(x)) and integrin density (n) for the adhesion of an osteoblast membrane to the implicitly modelled nanorough regions (A3). Note the coalescence of membrane protrusions over time, and the steady state (bottom panel) adhesion in a small number of patches to the titanium surface.
The titanium surface is modeled as a flat contour to which the osteoblast membrane may adhere (). It is assumed that once part of the membrane adheres to the titanium surface, this part of the membrane (ie, the contour coordinates) can no longer be detached from the titanium surface. This trapping prevents further membrane evolution throughout the simulation, and originates in strong electrostatic interactions of the titanium surface with the cell membrane and in the binding of membrane integrins to the titanium surface-attached fibronectin molecules (). We assume that in our model the overall number of integrin molecules in the membrane is conserved, and that they are allowed to move laterally along the osteoblast membrane. The maximum possible number of integrin molecules in the membrane segment is obtained from the total area divided by the cross-sectional area of the extracellular region of an integrin molecule.
Figure 7 The protein mediated adhesion of an osteoblast to the nanorough region of a titanium surface is facilitated due to the increased surface charge density and electric field strength at highly curved convex edges and spicules.
Equations of motion
Our model investigates the coupling between the adhesion of osteoblast cells to the extracellular matrix, the interaction between integrin molecules, and their spontaneous curvature. A free energy expression similar to the one explored for the equilibrium model (EquationEq. (10)(10) ) is employed to derive the equations of motion of an osteoblast membrane contour and the integrin density distributions. The membrane free energy in our dynamic model is:
where the first term gives the bending energy due to the mismatch between the membrane curvature and the membrane spontaneous curvature due to embedded integrin molecules, κ is the bending modulus, H is the local membrane mean curvature, H̄ is the intrinsic mean curvature due to embedded integrins and n is the area fraction density of integrins (relative density). The second term (σt) is the Lagrange multiplier (having the units of membrane surface tension) for the conservation constraint of the total membrane area. The third term gives the energy due to the force of the cytoskeleton inside the osteoblasts, where ϕs is the restoring cytoskeleton spring constant. The fourth term is the negative binding potential of integrin molecules (w > 0). The results of the equilibrium model show that for a large integrin binding potential w, the attraction of integrin molecules towards the nanorough region increases (EquationEq. (14)(14) ), causing the depletion of integrins from a nearby smooth region. For simplicity, in the dynamic model it is assumed that the binding energy comes into effect only for those membrane parts above nanorough titanium regions. We consider only the cases where the osteoblast membrane is at a short distance from the titanium surface. In addition, all membrane integrins above nanorough titanium surface regions are assumed to have the same nonzero w. The fifth term in EquationEq. (15)
(15) describes the direct interaction Bragg–Williams term between neighboring integrin molecules. The sixth and seventh terms are the entropic energies, which take into account the finite areas of integrin molecules. Here dA = dm ds is an infinitesimal membrane area element, dm is the length of the membrane in the direction perpendicular to the membrane contour,
is the infinitesimal length of the membrane along the contour in the x − y plane, where u runs from 0 to 1, n is the relative density of integrin molecules (with values between 0 and 1), Ω is the direct-interaction Bragg–Williams constant (Ω > 0), c is the number of the nearest neighbor integrin molecules, h = h(s) describes the magnitudes of small deformations from the flat membrane and ns = 1/a0 is the saturation area density of integrin molecules, where a0 is the cross-section area of a single integrin molecule. The local mean curvature is given by
The spontaneous curvature of the membrane C0 = H̄n is assumed to be proportional to the intrinsic mean curvature of the integrin molecule H̄.
In the following the free energy is normalized with respect to dm so F/dm → F, and as a result the free energy is considered to vary along the membrane contour and not in the direction perpendicular to the membrane contour. We next derive the equations of motion of the membrane contour by differentiation of the free energy (EquationEq. (15)(15) ) with respect to the membrane coordinateCitation15 and integrin concentration. To take into account the drag due to viscous forces, we assume for simplicity only local frictional forces, with coeffcient ζ. For the nearly flat osteoblast membrane, the equation of motion of the membrane is given by
where t is time. Note that the force δF(s)δh equals the membrane shape velocity times the friction coeffcient, but opposite in direction. Since the relative change in the y (ie, vertical, y = h(s)) direction is considerably greater than the change along the x (ie, horizontal) direction, we consider only changes along the vertical y direction.
The details of the membrane contour forces and fluxes derived from the derivation of the free energy, as well as the list of parameter values incorporated in our model, are given in Appendix A.
Strong binding to nanorough regions
While numerous experimental studies have shown that the nanorough regions of a titanium surface implant facilitate the binding of osteoblast cells, the underlying mechanisms are not fully understood. Here it is proposed that nanorough regions cause an increase of electric field strength and an aggregation of charge (as shown above) which enhances the binding of fibronectin and consequently integrin molecules to the titanium implant surface. To investigate the effect of having a distribution of nanorough regions, the effects of increased binding strength are incorporated into the free energy equation using a negative binding energy term, –wnsn (EquationEq. (15)(15) ). The same average binding potential energy w is taken into account for all integrins above the nanorough titanium surface.
Our system is driven dynamically by two mechanisms. The first is the instability that leads to the initial growth of membrane protrusions is driven by the interplay between a positive membrane surface tension and a negative binding potential and a direct-interaction energy. The second is the curvature-dependent flow of membrane-embedded integrins into favorable curved membrane regions, thereby reducing the free energy of the system. The above dynamics drive a positive feedback loop in which the influx of integrins towards regions of favorable curvature increases the positive membrane curvature, which then further attracts integrins (see also EquationEq. (15)(15) ).
In the following numerical simulation it was assumed that the osteoblast membrane was initially positioned 10 nm above a flat titanium surface, where the total length of the membrane was 25 μm. Furthermore, a random perturbation of small amplitude < 1% in integrin density was added around the initial density of the integrin molecules. The condition for instability was satisfied only over the nanorough regions at which initial membrane growth was observed (). Along the simulation, larger membrane protrusions were formed by the coalescence of smaller membrane protrusions (). The large membrane protrusions eventually adhered to the titanium surface, trapping the adhering membrane regions by the end of the simulation ().
To evaluate the effect of a negative binding term, the same simulation as above was run with a larger value for the binding potential w. The results revealed that the time for and the amounts of membrane adhesion to the titanium surface were different. In particular, it was shown that the time scale for the coalescence of membrane protrusions and membrane growth is shorter, and as a result, more membrane regions adhered to the titanium surface, which is due to the increased instability of the model system.Citation15,Citation42,Citation43
Discussion and conclusions
To understand the role of proteins (such as fibronectins, vitronectins, and laminins) involved in osteoblast adhesion on the surface of a titanium implant is of crucial importance.Citation3,Citation6 Our basic assumption that the attraction between a negatively charged titanium surface and a negatively charged osteoblast is mediated by charged proteins with a distinctive quadrupolar internal charge distributionCitation15 may be supported by experimental results. These showed that osteoblasts are flattened so closely onto the positively charged substrata that the ventral cell membrane was not distinguishable under the transmission electron microscope, while on negatively charged substrata the ventral cell membrane was readily visible only with focal contacts with the substrata.Citation3,Citation5 This indicates that the osteoblasts are strongly bound to the positively charged substrate due to direct electrostatic binding of a negatively charged glycocalyx of an osteoblast membrane to the positive substrate, while the binding of an osteoblast to a negatively charged substrate is mediated by proteins with a distinctive quadrupolar internal charge distribution ().
In accordance, it was observed that the protein populations desorbed from a positively charged substrate also differ from the populations described from a negatively charged substrate, indicating that protein adsorption is dependent on the charge of the substratum.Citation5 This is not at all surprising as proteins consist of many charged subunits. However, as the majority of proteins at physiological pH carry a net negative charge, a greater number of proteins would have been expected to adsorb to positive substrata.Citation5 But in fact it was observed that fewer proteins were desorbed from a positive surface than from a negative surfaceCitation5 which supports our model of binding of proteins with a distinctive quadrupolar internal charge distribution (like proteins with positively charged terminal groups) to a negatively charged substrate (titanium) (). Note that a nonzero quadrupolar internal charge distribution of the protein does not exclude the possibility that the protein carries net zero or negative total charge (see also).Citation27,Citation28
In order to assess the influence of geometrically structured titanium profiles on the surface charge density and electric field at the implant surface, we concentrated on estimation of the electric field at their most convex part. We showed that the surface charge density and electric field strength on the sharp convex metallic surface regions are highly increased.
Based on this result we suggest that nanorough regions, due to their many highly curved nanoscale protrusions and/or edges, have increased surface charge density and electric field strength. The increased surface charge density and electric field strength of such nanorough regions promote divalent cation-mediated adsorption of fibronectin to a negatively charged titanium surfaceCitation22 and quadrupolar protein mediated adhesion of osteoblasts to a negatively charged titanium surface,Citation15,Citation27,Citation28 both leading to a more efficient adhesion of osteoblasts to a titanium nanorough surface (). In accordance with our model that predicts stronger binding of osteoblasts to highly curved nanoscale protrusions and/ or edges, it was experimentally observed that focal contacts on smooth surfaces were distributed uniformly over the whole membrane surface in contact with the substrate.Citation4 However, on rough surfaces, focal contacts were visible only at the extremities of the cell extensions where cell membranes were in contact with the substrate.Citation3,Citation4
In the present study, lattice statistics of the equilibrium state was employed to demonstrate that in the limit of a large binding potential for integrins in a nanorough region (EquationEq. (14)(14) ) there is a strong attraction of integrin molecules towards the nanorough region, and their depletion from nearby smooth regions. Experimentally, a nanorough region could be obtained using various experimental procedures, eg, by the construction of vertically aligned TiO2 nanotubes. The results of the presented theoretical consideration in equilibrium conditions explain the strong attraction of integrin molecules to the sharp edges of a titanium surface, for example, to the edges of a TiO2 nanotube surface ().
In accordance with our theoretical predictions, it has been shown recently that a decrease in width of nanorough regions (of dimension from 80 μm and 48 μm to 22 μm) resulted in significant reductions in the number of osteoblast cells adhering to the structured surface.Citation19 It was hypothesized that osteoblasts recognize different surface roughnesses through the interaction of proteins in the extracellular matrix, a supposition which is confirmed in the present work. In another study, it was shown that osteoblasts are responsive to small nanopatterns of length scale below 100 nm in groove width and depth, as detected by the deposition of minerals (eg, hydroxypatite) along these nanosize patterns.Citation52 As already mentioned above, the nanorough surfaces of vertically aligned TiO2 nanotubes () facilitate the adhesion of osteoblasts and other cells with respect to adhesion to a smooth titanium surface.Citation16–Citation18
To gain more understanding of this behavior, the equilibrium free energy model was extended to explore the dynamics of integrin molecules on a nearly flat membrane segment of a cell (eg, an osteoblast) growing on the surface of implicitly smooth and nanorough titanium regions. The system free energy was constructed to derive the membrane shape dynamics and integrin density distributions while taking into account certain biophysical considerations. Namely, it was assumed that an integrin molecule has a positive (outward bending) intrinsic curvature, since the extracellular part of the integrin molecule is greater in size than its intramembrane part. Secondly, the aggregation of integrin molecules allows close-range interactions thereby reducing the free energy of the system when clusters of integrins are formed during their attachment to the titanium surface. Finally, in the dynamic model the nanorough and smooth regions are implicitly modeled by strong and weak regimes of integrin binding.
The results of our dynamic simulations demonstrate that due to initially stronger electrostatic interactions, the advantage of a nanorough titanium surface over a smooth titanium surface is crucial for the clustering of integrins in the process of adhesion of the osteoblast membrane to the nanorough titanium surface regions (). In fact, the growth and adhesion of the cell membrane is mainly within the boundaries of the nanorough regions. The results of our dynamic model show that the membrane does not fully adhere to the titanium surface, which is due to the aggregation of integrin molecules in local membrane regions above the nanorough titanium regions. The amount of membrane adhesion was shown to depend on the binding potential w and nearest neighbor direct interaction energy between integrin molecules.
Recent experimental data revealed that the growth and differentiation of osteoblast cells on small diameter (~15 nm) vertically aligned TiO2 nanotubes () is substantially greater than on large diameter (100 nm) nanotube surfaces.Citation16–Citation18 It has been proposed that the observed aggregation of integrin molecules forming focal adhesion is enhanced on small diameter nanotubes because the extracellular part of the integrin molecule is of a similar size, enabling crossbinding over the edges of neighboring nanotubes and over the hollow interiors of vertically oriented TiO2 nanotubes (). In the light of the results of the present study, we suggest that enhanced growth of a cell membrane on a nanotube surface is also facilitated by the interaction of integrin molecules during the formation of a point of focal adhesion (). Moreover, the fact that small diameter nanotubes present on average more surface edges (with increased surface charge density and electric field strength) per unit area, the binding affnity of a small diameter nanotube surface is expected to be increased in accordance with the results presented in the present paper.
Many different proteins play a role in the interactions between the implant surface and the osteoblast. In addition to fibronectin (considered in this work), human osteoblasts also adhere to vitronectinCitation6 and weakly to laminin.Citation3 The structure of vitronectin, an integrin binding protein, was predicted through a combination of computational methods and experimental approaches.Citation53,Citation54 Vitronectin is composed of three main structural domains, the N-terminal somatomedin B domain, the central domain, and the C-terminal domain. Like fibronectin, vitronectin also contains an Arg-Gly-Asp (RGD) sequence close to the somatomedin B domain which is responsible for integrin binding and cell adhesion.Citation3,Citation53 The highly positively charged group of vitronectin near the C-terminal group on the other side of the molecule (largely uninterrupted by negative charges) is the binding site for the negatively charged molecules of heparin.Citation36,Citation53,Citation54 It can therefore be anticipated that the heparin binding site of vitronectin (positively charged) may be predominantly (electrostatically) bound along the sharp convex edges or spikes of nanorough titanium surfaces where the magnitude of the negative surface charge density of the titanium surface is the highest. On the other hand, the vitronectin RGD binding site on the other side of the vitronectin molecule may bind to the integrin molecule, resulting in facilitation of osteoblast adhesion at sharp convex edges or spikes of nanorough titanium surfaces (in addition to the fibronectin–integrin mediated osteoblast adhesion already described).
In conclusion, the nanostructuring of implant surfaces provides a powerful mechanism to encourage and direct cell adhesion to the implant surface.Citation6 Based on the results presented in this work, we suggest that nanorough titanium implant regions, due to their many highly curved nanoscale protrusions and/or edges, have locally an increased surface charge density and electric field strength. The increased surface charge density and electric field strength of such nano rough regions promote divalent cation-mediated adsorption of fibronectin to a negatively charged titanium surface ()Citation22 and quadrupolar protein-mediated adhesion of osteoblasts to a negatively charged titanium surface (), both leading to more effcient adhesion and spreading of osteoblasts to a nanorough titanium surface (). The suggested mechanism of increased binding of osteoblasts along the sharp convex edges or spikes of nanorough titanium surfaces due to the locally increased magnitude of the negative surface charge density is also valid for other metals (besides titanium) since the accumulation of negative charge at convex edges and spikes also takes place in the case of other metal surfaces.
Acknowledgment
This work was supported by DFG for the project A3 in Research Training Group 1505/1 “welisa” and ARRS grants J3-9219-0381, P2-0232-1538. The authors are grateful for help to Nir Gov from Weizmann Institute of Science.
Disclosure
The authors have no conflicts of interest to disclose in this work.
References
- LüthenFLangeRBeckerPRychlyJBeckUNebeBThe influence of surface roughness of titanium on 1-βand 3-βintegrin adhesion and the organization of fibronectin in human osteoblastic cellsBiomaterials20042624232440
- NebeBLüthenFLangeRBeckUInterface interactions of osteoblasts with structured titanium and the correlation between physicochemical characteristics and cell biological parametersMacromol Biosci2007756757817457937
- AnselmeKOsteoblast adhesion on biomaterialsBiomaterials20002166768110711964
- AnselmeKBigerelleMNoelBQualitative and quantitative study of human osteoblast adhesion on materials with various surface roughnessJ Biomed Mater Res20004915516610571901
- SheltonRMRasmussenACDaviesJEProtein adsorption at the interface between charged polymer substrata and migrating osteoblastsBiomaterials1998924293349119
- StevensMMGeorgeJHExploring and engineering the cell surface interfaceScience20053101135113816293749
- RowleyJAMadlambayanGMooneyDJAlginate hydrogels as synthetic extracellular matrix materialsBiomaterials19992045539916770
- HerselUDahmenCKesslerHRGD modified polymers: biomaterials for stimulated cell adhesion and beyondBiomaterials2003244385441512922151
- HubbellJABiomaterials in tissue engineeringNature Biotehnology199513565576
- MrksichMWhitesidesGMUsing self-assembled monolayers to understand the interactions of man-made surfaces with proteins and cellsAnnu Rev Biophys Biomed Struct1996255578
- KasemoBBiological surface scienceSurf Sci2002500656677
- BobynJDPilliarRMCameronHUWeatherlyGCKentGMThe effect of porous surface configuration on the tensile strength of fixation of implants by bone ingrowthClin Orthop Relat Res19801492912987408314
- BobynJDWilsonGJMacGregorDCPilliarRMWeatherlyGCEffect of pore size on the peel strength of attachment of fibrous tissue to porous-surfaced implantsJ Biomed Mater Res1982165715847130213
- MatschegewskiCStaehlkeSLoefferRCell architecture-cell function dependencies on titanium arrays with regular geometryBiomaterials2010315729574020434213
- KabasoDGongadzeEPerutkováŠMechanics and electrostatics of the interactions between osteoblasts and titanium surfaceComput Meth Biomech Biomed Eng201114469482
- ParkJBauerSvon der MarkKSchmukiPNanosize and vitality: TiO2 vanotube diameter directs cell fateNano Lett200771686169117503870
- ParkJBauerSSchmukiPvon der MarkKNarrow window in nanoscale dependent activation of endothelial cell growth and differentiation on TiO2 nanotube surfacesNano Lett200993157316419653637
- ParkJBauerSSchlegelKANeukamFWMarkKVSchmukiPTiO2 nanotube surfaces: 15 nm – an optimal length scale of surface topography for cell adhesion and differentiationSmall2009566667119235196
- PuckettSParetaRWebsterTJNano rough micron patterned titanium for directing osteoblast morphology and adhesionInt J Nanomedicine2008322924118686782
- PopatKCDanielsRHDubrowRSHardevVDesaiTANanostructured surfaces for bone biotemplating applicationsJ Orthop Res20062461962716514643
- PopatKCChatvanichkulKIBarnesGLLatempaTJGrimesCADesaiTADifferentiation of marrow stromal cells cultured on nanoporous alumina aurfacesJ Biomed Mater Res A20078095596417089417
- HeathMDHendersonBPerkinSIon-specific effects on the interaction between fibronectin and negatively charged mica surfacesLangmuir2010265304530820345156
- WalboomersFFJansenJACell and tissue behaviour on micro-grooved surfaceOdontology20018921114530915
- MonseesTKBarthKTippeltSSurface patterning on adhesion, differentiation, and orientation of osteoblast-like cellsCell Tiss Org20051808195
- SmeetsRKolkAGerressenMA new biphasic osteoinductive calcium composite material with a negative zeta potential for bone augmentationHead Face Med200951319523239
- SmithIOBaumannMJMcCabeLRElectrostatic interactions as a predictor for osteoblast attachment to biomaterialsJ Biomed Mater Res A20047043644115293317
- UrbanijaJBohincKBellenAAttraction between negatively charged surfaces mediated by spherical counterions with quadrupolar charge distributionJ Chem Phys200812910510119044938
- UrbnanijaJTomŝičNLokarMCoalescence of phospholipid membranes as a possible origin of anticoagulant effect of serum proteinsChem Phys Lipids2007150495717662972
- TengNCNakamuraSTakagiYYamashitaYOhgakiMYamashitaKA new approach to enhancement of bone formation by electrically polarized hydroxyapatiteJ Dent Res2000801925192911706953
- OghakiMKizukiTKatsuraMYamashitaKManipulation of selective cell adhesion and growth by surface charges of electrically polarized hydroxyapatiteJ Biomed Mater Res20015736637311523031
- NeleaVKaartinenMTPeriodic beaded-filament assembly of fibronectin on negatively charged surfaceJ Struct Biol2010170505920109553
- CooperGMCell: A Molecular Approach2nd edSunderland, MAASM Press2000
- BouafsounAHelaliSMebarekSElectrical probing of endothelial cell behaviour on a fibronectin/polystyrene/thiol/gold electrode by Faradaic electrochemical impedance spectroscopy (EIS)Bioelectrochemistry20077040140716844428
- ZelkoJIgličAKralj-IgličVKumarPBSEffects of counterion size on the attraction between similarly charged surfacesJ Chem Phys201013320490121133451
- FrankMSodin-ŜemrlSRozmanBPotočnikMKralj-IgličVEffects of low-molecular-weight heparin on adhesion and vesiculation of phospholipid membranes – a possible mechanism for the treatment of hypercoagulability in antiphospholipid syndromeAnn N Y Acad Sci2009117387488619758240
- RapuanoBEMacDonaldDESurface oxide net charge of a titanium alloy: modulation of fibronectin-activated attachment and spreading of osteogenic cellsColl Surf B20118295103
- JacksonJDClassical Electrodynamics JNew YorkWiley2007
- LamperskiSOuthwaiteCWVolume term in the inhomogeneous Poisson-Boltzmann theory for high surface chargeLangmuir20021834233424
- IgličAGongadzeEBohincKExcluded volume effect and orientational ordering near charged surface in solution of ions and Langevin dipolesBioelectrochemistry20107922322720678740
- GongadzeEBohincKvan RienenUKralj-IgličVIgličASpatial variation of permittivity near a charged membrane in contact with electrolyte solutionIgličAAdvances in Planar Lipid Bilayers and Liposomes11Amsterdam, the NetherlandsElsevier2010101126
- GongadzeEvan RienenUKralj-IgličVIgličALangevin Poisson- Boltzmann equation: point-like ions and water dipoles near charged membrane surfaceGen Physiol Biophys20113013013721613667
- VekslerAGovNSPhase transitions of the coupled membrane-cytoskeleton modify cellular shapeBiophys J2007933798381017704150
- KabasoDLokarMKralj-IgličVVeraničIgličATemperature and cholera toxin B are factors that influence formation of membrane nanotubes in RT4 and T24 urothelial cancer cell linesInt J Nanomed20116495509
- ScitaGConfalonieriSLappalainenPSuetsuguSIRsp53: crossing the road of membrane and actin dynamics in the formation of membrane protrusionsTrends in Cell Biol200818526018215522
- TakenawaTSuetsuguSThe wasp-wave protein network: connecting the membrane to the cytoskeletonNat Rev Mol Cell Biol20078374817183359
- TakanoKToyookaKSuetsuguSEfc/f-bar proteins and the n-wasp-wip complex induce membrane curvature-dependent actin polymerizationEMBO J2008272817282818923421
- YangCHoelzleMDisanzaAScitaGSvitkinaTCoordination of membrane and actin cytoskeleton dynamics during filopodia protrusionPLoS ONE20094e567819479071
- SuetsuguSThe proposed functions of membrane curvatures mediated by the bar domain superfamily proteinsJ Biochem201014811220435640
- HillTLAn Introduction to Statististical ThermodynamicsNew YorkDover Publications1986
- IgličAKralj-IgličVBudding of liposomes – role of intrinsic shape of membrane constituentsLeitmannova LiuAAdvances in Planar Lipid Bilayers and Liposomes4Amsterdam, the NetherlandsElsevier2006253279
- KabasoDShlomovitzRAuthTLewLVGovNSCurling and local shape changes of red blood cell membranes driven by cytoskeletal reorganizationBiophys J20109980881620682258
- LamersEWalboomersXFDomanskiMThe influence of nanoscale grooved substrates on osteoblast behavior and extracellular matrix depositionBiomaterials2010313307331620122723
- ScharCRBlouseGEMinorKHPetersonCBA deletion mutant of vitronectin lacking the Somatomedin B domain exhibits residual plasminogen activator inhibitor-1-binding activityJ Biol Chem2008283102971030918174166
- XuDBaburajKPetersonCBXuYModel for the three-dimensional structure of vitronectin: predictions for the multi-domain protein from threading and dockingProteins20014431232011455604
Appendix references
- LamperskiSOuthwaiteCWVolume term in the inhomogeneous Poisson-Boltzmann theory for high surface chargeLangmuir20021834233424
- IgličAGongadzeEBohincKExcluded volume effect and orientational ordering near charged surface in solution of ions and Langevin dipolesBioelectrochemistry20107922322720678740
- GongadzeEBohincKvan RienenUKralj-IgličVIgličASpatial variation of permittivity near a charged membrane in contact with electrolyte solutionIgličAAdvances in Planar Lipid Bilayers and Liposomes11Amsterdam, the NetherlandsElsevier2010101126
- GongadzeEvan RienenUKralj-IgličVIgličALangevin Poisson- Boltzmann equation: point-like ions and water dipoles near charged membrane surfaceGen Physiol Biophys20113013013721613667
- GouyMGOn the configuration of the electric charge at the electrolyt interfaceJ Physique19109457468 French
- ChapmanDLA contribution to the theory of electrocapillarityPhilos Mag191325475481
- McLaughlinSThe electrostatic properties of membranesAnn Rev Biophys Chem198918113136
- CevcGMembrane electrostaticsBiochim Biophys Acta199010313113822223819
- Kralj-IgličVIgličAA simple statistical mechanical approach to the free energy of the electric double layer including the excluded volume effectJ Phys II19966477491
- BivasIErmakovYAElasticity and electrostatics of amphiphilic layersLeitmannova LiuAAdvances in Planar Lipid Bilayers and Liposomes5Amsterdam, the NetherlandsElsevier2007313343
- GruenDWRMarčeljaSSpatially varying polarization in waterJ Chem Soc Faraday Trans II198379225242
- IsraelachviliJNIntermolecular and Surface ForcesLondon, UKAcademic Press1997
- ButtHJGrafKKapplMPhysics and Chemistry of InterfacesWiley-VCH Verlag20035253
- ManciuMRuckensteinEThe polarization model for hydration/ double layer interactions: the role of the electrolyte ionsAdv Coll Int Sci2004112109128
- ArsovZRappoltMGrdodolnikJWeakened hydrogen bonds in water confined between lipid bilayers: the existence of a long-range attractive hydration forceChem Phys Chem2009101438144119466703
- HianikTPassechnikVIBilayer Lipid Membranes: Structure and Mechanical PropertiesDordrecht, the NetherlandsKluwer Academic Publishers1995138157
- BivasIElectrostatic and mechanical properties of a flat lipid bilayer containing ionic lipidsColl Surf A2006282/283423434
- OuthwaiteCWA treatment of solvent effect in the potential theory of electrolyte solutionMol Phys19763113451357
- OuthwaiteCWTowards a mean electrostatic potential treatment of an ion-dipole mixture or a dipolar system next to a plane wallMol Phys198348599614
- BazantMZKilicMSStoreyBAjdariATowards an understanding of induced-charge electrokinetics at large applied voltages in concentrated solutionsAdv Colloid Interface Sci2009152488819879552
- CoalsonRDDuncanAStatistical mechanics of a multipolar gas: a lattice field theory approachJ Phys Chem199610026122620
- BoothFThe dielectric constant of water and the saturation effectJ Chem Phys195119391394
- FranksFWaterA Comprehensive Treatise, Vol 1, The Physics and Physical Chemistry of WaterNew YorkPlenum Press1972
- GongadzeEvan RienenUIgličAGeneralised Stern models of the electric double layer considering the spatial variation of permittivity and finite size of ions in saturation regimeCell Mol Biol Lett2011
Appendices
Appendix A: dynamic model of the osteoblast membrane
In this Appendix we give further details of the dynamic model employed to test the effects of integrin mediated adhesion of osteoblasts to nanorough and smooth titanium surfaces. The differentiation of the free energy (EquationEq. (15)(15) ) is projected to give the forces normal to the membrane contour. We now list the forces derived from the differentiation of the free energy:
where Fcurvature is the force due to the curvature energy mismatch between the membrane curvature and the spontaneous curvature of the integrins, Ftension is the membrane tension force, Fbinding is the force due to binding of integrin molecules, Fspring is the spring restoring force, Fentropy arises from the entropy of the integrins in the membrane, which acts to expand the length of the contour, and Finteraction is the force due to the direct interaction between neighboring integrin molecules. The nonlinear term H 3/2 in Fcurvature is neglected in the following.
We now calculate the dynamics of the integrin density, using the following conservation equation:
where Λ is the mobility of filaments and J→ is the total current of integrins on the membrane, which includes the following terms:
where Jattraction is the attractive flux resulting from the interaction between the integrins through the membrane curvature, Jdispersion is the dispersion flux due to membrane resistance to integrin aggregation due to their membrane bending effects, Jinteraction is the flux due to the direct interaction between integrins, and Jdiffusion is the usual thermal diffusion flux which depends on the diffusion coeffcient, D = ΛkT. The last term in EquationEq. (A.7)(A.7) arises from the covariant derivative of the density with time on a contour whose length evolves with time. In this term ds is the infinitesimal contour (line) element. This term ensures that the total number of integrins is conserved as the contour length changes. Note that the fluxes due to entropy were not taken into account due to their relatively small magnitude.
The results in the present study were calculated using numerical simulations of the dynamics of the model system beyond the linear limit. The differential equations explained above were solved using an explicit Euler method in Matlab. We checked for the convergence of our one-dimensional simulations in space and time. A variation of the Monge representation h(s) was employed to simplify the numerics, such that the curvature force was kept only up to linear order. For simplicity, the boundary conditions on the nearly flat membrane were taken to be periodic. The following is the list of parameter values incorporated in our numerical simulations:
Appendix B:
Langevin-Bikerman model of a charged metallic surface in contact with an electrolyte, considering the finite size of molecules and orientational ordering of water
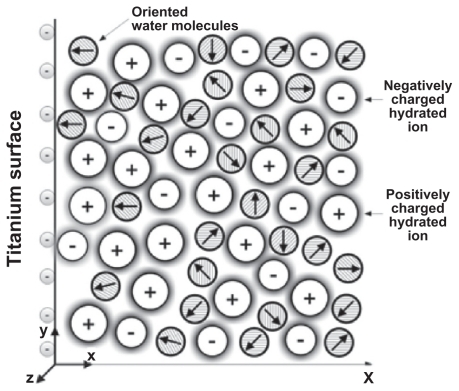
The contact between a charged titanium surface and an electrolyte solution implies a particular ion distribution near the charged surface, ie, the electrical double layer (EDL).Citation5,Citation6 The distribution of ions in the EDL can be described within the Poisson-Boltzmann (PB) theoryCitation1,Citation7–Citation10 by expressing the competition between electrostatic interactions and the entropy of ions in the solution. Due to the electrostatic forces between the charged surface and the ions in solution, counterions are accumulated close to the charged surface, while coions are depleted from this region (). As already shown, the properties of the EDL may also be influenced by ordering of water molecules in the region of the electric double layer.Citation8,Citation11–Citation15
Figure B.1 Schematic figure of an electrical double layer near a negatively charged planar membrane surface. The water molecules in the vicinity of the charged surface are predominantly oriented towards the surface.
Most of the PB-based models of the EDLCitation1,Citation7,Citation8,Citation16,Citation17 assume that the relative permittivity in the electrolyte is constant. In the absence of explicit consideration of the orientational ordering of water molecules, the assumption of constant permittivity is largely a consequence of the constant number of water molecules in PB theory. But actually, close to the charged surface the orientation of water molecules () may result in a spatial variation of permittivity.Citation13,Citation18–Citation20 Considering this effect, the EDL mean-field theory was modified by orientational ordering of water molecules where the water molecules were described as Langevin dipoles,Citation2–Citation4,Citation18,Citation19,Citation21 which may be considered to be a very rough treatment of the relative properties of the solvent.Citation22–Citation24 Taking into account the finite volume of ions and water orientation,Citation1–Citation3 the electric potential can be determined from the Langevin-Bikerman (LB) equation with an excluded volume derived for a monovalent salt electrolyte solution in contact with a charged surface:Citation2,Citation4
where
Here e0 is the elementary charge, p0 is the dipole moment of water (or a small cluster of water molecules), ɛ0 is the permittivity of free space, ϕ is the electric potential, E = /Δφ/ is the magnitude of electric field strength, n is the unit normal vector in the direction of Δφ, β= 1/kT, kT is the thermal energy and n0w = ns –2n0 is the number densities of water molecules in the bulk, ns is the number density of lattice sitesCitation2 and n0 the bulk number density of monovalent salt anions and cations. The above differential equation has two boundary conditions. The first states that the electric field is zero far away from the charged surface:
The second boundary condition at the charged surface demands the electro-neutrality of the whole system and is obtained by integrating EquationEq. (B.1)(B.1) (see):Citation2,Citation3
where σ is the surface charge density. The above LB EquationEq. (B.1)(B.1) for finite sized ions can be rewritten in the form:Citation4
where ρ free (r) is the macroscopic (net) volume charge density of co-ions and counter-ions:Citation4
and ɛr is the relative permittivity of the electrolyte solution in contact with the charged surface:Citation41
In the above EquationEq. (B.9)(B.9) we assume n0 << ns and therefore ns ≈ n0w. The cavity and reaction fields are not taken into account.Citation24
The second boundary condition (EquationEq. (B.6)(B.6) ) can be rewritten as:Citation4
where ɛr (r) is defined by EquationEq. (B.9)(B.9) . The above expression for ɛr (EquationEq. (B.9)
(B.9) ) is consistent with the definition of the relative permittivity in the form ɛr = 1 + |P|/ɛ 0E,Citation2,Citation3 where P is the polarization vector.
In this work EquationEq. (B.7)(B.7) was solved numerically using the Finite Element Method (FEM) within the Comsol Multiphysics 3.5a Software program package (Stockholm, Sweden). The space dependence of ɛr (r) (EquationEq. (B.9)
(B.9) ) in EquationEq. (B.7)
(B.7) is taken into account in an iterative procedure where the initial value of ɛr (r) is a constant equal to the permittivity of the bulk solution.
shows a substantial decrease of ɛr in the vicinity of a charged planar surface. The predicted decrease of the permittivity relative to its bulk value is the consequence of the orientational ordering of water dipoles in the vicinity of the charged surface and the depletion of water dipoles at the charged surface due to accumulation of counterions, as shown schematically in . The profound decrease of ɛr near the charged surface at higher values of the surface charge density/σ/() according to EquationEq. (B.10)(B.10) strongly increases the electric field strength at the charged surface E = – Δϕ(r = rsurf) and therefore also the attraction of osteoblasts to the negatively charged metal surface.
Figure B.2 Effective relative permittivity ɛr as a function of the distance from the planar charged surface x calculated within the presented Langevin PB theory with excluded volume for three values of the surface charge density: σ = − 0.1 As/m2 (dotted line), −0.2 As/m2 (dashed line) and −0.4 As/m2 (full line). EquationEqs.(B.7)(B.7) –Equation(B.10)
(B.10) were solved numerically for planar geometry using the Finite Element Method as described in the text. The dipole moment of water p0 was taken as 4.794 D, the bulk concentration of salt n0/NA = 0.15 mol/L and the bulk concentration of water n0w/NA = 55 mol/L.
![Figure B.2 Effective relative permittivity ɛr as a function of the distance from the planar charged surface x calculated within the presented Langevin PB theory with excluded volume for three values of the surface charge density: σ = − 0.1 As/m2 (dotted line), −0.2 As/m2 (dashed line) and −0.4 As/m2 (full line). EquationEqs.(B.7)∇·[ɛ0ɛr(r)∇φ(r)]=-ρfree(r),(B.7) –Equation(B.10)∇φ(r=rsurf)=-σnɛ0ɛr(r=rsurf),(B.10) were solved numerically for planar geometry using the Finite Element Method as described in the text. The dipole moment of water p0 was taken as 4.794 D, the bulk concentration of salt n0/NA = 0.15 mol/L and the bulk concentration of water n0w/NA = 55 mol/L.](/cms/asset/a6fa72c8-4771-4528-b728-999e699a3e99/dijn_a_21755_f0009_b.jpg)