 ?Mathematical formulae have been encoded as MathML and are displayed in this HTML version using MathJax in order to improve their display. Uncheck the box to turn MathJax off. This feature requires Javascript. Click on a formula to zoom.
Abstract
Quantum dots have emerged with great promise for biological applications as fluorescent markers for immunostaining, labels for intracellular trafficking, and photosensitizers for photodynamic therapy. However, upon entry into a cell, quantum dots are trapped and their fluorescence is quenched in endocytic vesicles such as endosomes and lysosomes. In this study, the photophysical properties of quantum dots were investigated in liposomes as an in vitro vesicle model. Entrapment of quantum dots in liposomes decreases their fluorescence lifetime and intensity. Generation of free radicals by liposomal quantum dots is inhibited compared to that of free quantum dots. Nevertheless, quantum dot fluorescence lifetime and intensity increases due to photolysis of liposomes during irradiation. In addition, protein adsorption on the quantum dot surface and the acidic environment of vesicles also lead to quenching of quantum dot fluorescence, which reappears during irradiation. In conclusion, the in vitro model of phospholipid vesicles has demonstrated that those quantum dots that are fated to be entrapped in endocytic vesicles lose their fluorescence and ability to act as photosensitizers.
Introduction
Developments in material physics and chemistry have fundamentally changed detection and tracking of biological systems and living organisms.Citation1 Luminescent semiconductor nanocrystal quantum dots (QDs) are of particular interest to many research groups for their ease of chemical manipulation and crystalline structure, which enable the creation of complex assembliesCitation2,Citation3 and unique photophysical characteristics such as high quantum yield, high molar extinction coefficient, broad excitation spectra and narrow symmetric emissionCitation4 that can be tuned in accordance with particle size,Citation5 high resistance to chemical and photophysical degradation, and accessibility of outer shell modifications with various biologically active molecules.Citation6 Just like organic chromophores and fluorophores, QDs possess electronic structure and molecular orbitals.Citation7 These features make them promising for a wide range of applications in both fundamental biological research such as labeling agents for cellular trafficking;Citation8,Citation9 membrane dynamics and cellular movements;Citation10,Citation11 single particle tracking;Citation12,Citation13 multicolor imagingCitation14,Citation15 and applied medical research within multimodal (magnetic and optical) imaging,Citation16,Citation17 particularly of tumors;Citation18–Citation20 and nanoparticle-mediated drug delivery.Citation21,Citation22 Besides imaging, QDs are now emerging as therapeutic agents aloneCitation23 or in combination with external radiation.Citation24–Citation26 It has been recently shown that QDs irradiated with UV radiation,Citation27–Citation29 blue light,Citation30 or red lightCitation31 generate free radicals and singlet oxygen in aqueous solutions, cell cultures in vitro, and mouse skin in vivo, opening one more potential field for their photodynamic application. The most likely mechanism of photosensitized action of QDs is photogeneration of excitons and electron-hole pairs (e− and h+)Citation32 and subsequent electron transfer to oxygen adsorbed on the QD surface forming a superoxide (O2−) free radical.Citation33 So far, the photodynamic effect of QDs has been demonstrated for UV radiation by Clarke et al on epithelial cellsCitation28 and Chang et al on pancreatic cells.Citation34 Derfus et al have demonstrated cytotoxic effects of CdSe QDs with photocatalytically impaired capping shell during UV radiation on hepatocytes.Citation35
However, therapeutic application of QDs in a biological environment meets challenges in delivery to target cells and to specific intracellular sites. In spite of the fact that QDs are excellent generators of free radicals and singlet oxygen (a key cytotoxic molecule) in aqueous solutions,Citation30,Citation31 our recent work showed no significant photodynamic action in Du145 cells pretreated with red fluorescent QDs under irradiation with blue or red light.Citation36 This might be due to the fact that QDs are trapped in endocytic vesicles such as endosomes and lysosomes where QD fluorescence is quenched. Obviously, one must rehabilitate such failure of QDs to act as photosensitizers under irradiation with visible light. In this work, we have addressed this problem by studying the photophysical properties of red-fluorescent QDs in phospholipid vesicles and in the presence of proteins. Liposomes with encapsulated QDs were synthesized by a fast method of extruding hydrated phospholipids through a polycarbonate filter using a simple, convenient, low-cost two-syringe system.
Materials and methods
Preparation of phospholipid vesicles
For synthesis of liposomes, 60 mol% phosphatidylcholine (2.025 · 10−5 mol 1,2-distearoyl-sn-glycero-3-phospho- choline [DSPC], gel–liquid crystal transition temperature, TC = 55°C, molecular weight [MW] = 790.16; Sigma Aldrich Norway AS, Oslo, Norway) and 40 mol% cholesterol (1.345 · 10−5 mol, obtained from George T Gurr Ltd, London, UK) were solubilized in 2 mL of chloroform in a tightly closed 4 mL glass vial. The solution was well mixed with a vortex shaker for 3 minutes, resulting in a clear solution. To form a dry lipid film, the chloroform was evaporated by immersing the glass vial with the phospholipid solution in the water bath (55°C) under continuous gentle shaking. After about 30 minutes, when most of the chloroform had evaporated, the rest of it was evaporated by rotating the vial along with a weak argon flow above the surface of the phospholipid/chloroform suspension. Such argon flushing accelerates the evaporation of chloroform and preserves the lipids against oxidation. To get a good lipid film, a large surface layer was produced. Formation of a uniform transparent layer of dry lipids on the walls confirms the yield of a lipid film. The vial was then placed into a vacuum dryer (Glass Oven B-585; Büchi Labortechnik AG, Flawil, Switzerland) to evaporate trace amounts of the chloroform using a vacuum pump Büchi V-700 (Büchi Labortechnik AG, Flawil, Switzerland). The duration of this cycle was 1 hour at 10 mbar pressure.
If not used the same day, the formed dry lipid film was stored in a freezer (−20°C) in the tightly closed vial filled with argon gas. Then, to produce a suspension of phospholipids, the lipid film was hydrated under continuous agitation in a 10% sucrose aqueous solution (osmolality ~300 mOsm/kg measured with a Fiske 210 osmometer; Advanced Instruments Inc, Norwood, MA,) supplemented with 100 nmol/L QD655 (Invitrogen Corp, Carlsbad, CA). The temperature (65°C) of the hydrating medium was above TC of the lipid. The vial with the lipid suspension was then maintained above TC during the whole hydration period. After ~30 minutes of manual agitation, a homogenous lipid suspension was formed.
Avestin LiposoFast equipment (Sigma-Aldrich, St Louis, MO) was used for the simplified liposome extrusion. The method involves manual handling of a two-syringe system capable of producing less than a milliliter of liposome suspension without involving extrusion under gas pressure. A polycarbonate filter with a pore size of 400 nm, similar to the size of endocytic vesicles, was used in the experiment. One of the 0.5 mL glass syringes was filled with the hydrated lipid suspension. It was attached to an extruder with the filter imbedded in it, and then the second receiving syringe was mounted. The whole system was immersed in the water bath set at 65°C. By carefully pushing one syringe at a time, the lipid suspension was extruded back and forth many times through the membrane. The temperature of the lipid suspension was maintained above TC during the whole process. An odd number of passages was performed to avoid contamination of the liposomes with the original lipid suspension. To get a uniform size of the liposomes, 21 passages were performed. Non-encapsulated QDs and lipids were removed by ultrafiltration at 4000 rpm (rotor radius 14 cm, centrifuge model 5804 R; Eppendorf AG, Hamburg, Germany) using a 200 nm Vivaspin 6 filter (Vivascience AG, Hannover, Germany). Then, the liposomes were resuspended with the 10% sucrose solution to bring the suspension to the original volume (0.5 mL). When not in use, the liposomes were stored in a refrigerator (4°C).
Quantum dots used in this study
Red fluorescent commercial QDs (QD655) used in this study consist of a CdSe core with a ZnS shell and are coated with polyethylene glycol (PEG) with carboxyl-terminated groups. They were purchased from Invitrogen Corp as 8 μM stock solutions in borate buffer and further diluted in water to necessary concentrations. The CdSe QDs have broad absorption profiles with strong intensities in the ultraviolet (UV) region and decreasing toward the red spectral region with their first exciton peak at 650 nm and are defined as QD655 due to the position of the fluorescence maximum at 655 nm.Citation37
Particle size measurements
The sizes of the QD655 (Invitrogen Corp) and the liposomes produced in our laboratory were measured in phosphate buffered saline (PBS) by the dynamic light scattering (DLS) technique using a Nano ZS Zetasizer (Malvern Instruments Ltd, Malvern, UK).
Transmission electron microscopy (TEM)
The nanoparticles were imaged with a JEM-1230 transmission electron microscope (JEOL Ltd, Tokyo, Japan) and 11 megapixel side-mounted TEM camera “Morada” (Olympus Soft Imaging Solutions PTE Ltd, Munster, Germany). The QDs were first diluted with sucrose (330 mOsmol/kg, buffered with (4-[2-hydroxyethyl]-1-piperazineethanesulfonic acid [HEPES] 10 mM, pH 7.4) then dropped onto copper grids and allowed to stay for 5 minutes for the QDs to settle. Excess sucrose was removed, and the grid was dried prior to imaging. To image the liposomes, a drop of liposomal suspension in sucrose was placed onto the copper grid for 5 minutes. The excess sucrose was then removed with lint-free drying paper. Uranyl acetate 2% aqueous solution was dropped just after the sucrose removal and allowed to stay for 30 seconds. The excess of uranyl acetate was then soaked up, and the grid was dried at room temperature for several minutes.
Fluorescence microscopy
Du145 cells were grown on 35 mm Petri dishes with bottom glass (thickness number 1.0) for microscopy coated with poly-d-lysine (MatTek Corp, Ashland, MA). For visualization the Du145 cells were transfected with an actin-green fluorescent protein (actin-GFP) gene following the manufacturer’s protocol (Cellular Lights Actin-GFP, Invitrogen Corp) by incubating the cells for 1.5 hours with baculovirus and then for another 1.5 hours with expression enhancer. Afterward, the Du145 cells were incubated for 24 hours with 10 nmol/L QD655. The cells were visualized with a Carl Zeiss Axiovert 40 CFL microscope (Carl Zeiss Inc, Oberkochen, Germany) using a 100 × oil immersion objective (Carl Zeiss Achroplan, NA = 1.25). Fluorescence photographs were taken approximately every 9–11 seconds for a total of 90 seconds illumination with the microscope light filtered to give excitation at 450–480 nm. Image capture parameters were automatically set by the software (Carl Zeiss Axiovision 4.6, Carl Zeiss Inc) for the first image in a set. Thereafter, all images in a sequence retained the same image capture parameters. The image integration time was 2818 milliseconds. Pixel intensity values are presented on a scale of 0–255.
Measurements of steady state fluorescence and decay kinetics
The fluorescence of QD655 in aqueous solutions was measured at 655 nm under excitation at 400 nm in a standard 1 cm path length quartz cuvette with an LS50B luminescence spectrometer (PerkinElmer, Waltham, MA) using a standard cuvette holder providing 90° between excitation beam and emission detection.
Fluorescence of rhodamine 123 (Rh123)/dihydrorhodamine 123 (DHR) in aqueous solutions was measured at 525 nm with a USB2000FL fluorescence spectrometer (Ocean Optics Inc, Duiven, the Netherlands) under excitation at 475 nm using an Ocean Optics integrated light emitting diode (LED) source.
Fluorescence decay kinetics were measured in a standard 1 cm path length quartz cuvette with an EasyLife V instrument (OBB Corp, Birmingham, NJ). Fluorescence of QDs was excited with a pulsed LED source (peak 400 nm with half bandwidth 20 nm, pulse half width 2 ns) and measured using a dichroic filter on the detection side (650 nm with 10 nm band pass). Instrument response function (IRF) was measured in a cuvette containing ultrapure water. Lifetime calculations were performed with the EasyLife V proprietary software (OBB Corp).
In all solutions used for fluorescence decay measurements, the final concentration of QD655 was 10 nmol/L. Lipodots were mixed with PBS in 1:1 ratio (v/v) prior to the experiments. A solution of 0.1% w/v Triton X-100 was prepared in distilled water, and 1% w/v bovine serum albumin (BSA) was prepared in PBS. The suspension of empty liposomes (without QD655) in 40% sucrose aqueous solution was mixed with PBS in 1:1 ratio (v/v) prior to the addition of the QDs, and then 10 nmol/L QD655 was freshly added before each measurement. The decay curves are averages of three independent measurements. See supporting material for calculated fluorescence lifetimes.
Oxygen measurements
A FOXY-21G fiber-optic probe (OceanOptics BV) connected to the fluorescence spectrometer (USB2000FL, Ocean Optics BV) was used to measure oxygen concentrations. The oxygen probe was calibrated against three reference points: 21% in the air as well as 0% and 100% in a flask flushed with pure argon and oxygen, respectively.
For oxygenation, samples were flushed with pure oxygen that saturated water with approximately 80% dissolved oxygen measured at T = 23° C, Patm = 756 mmHg (100,7 kPa). After stopping oxygen flushing, oxygen concentration decreased to 70% within 15 minutes. To remove oxygen, the samples were flushed with argon for approximately 30 minutes. After flushing, the cuvette was immediately closed with its stopper. Argon flushing enabled the reduction of the dissolved oxygen concentration in water to ~7%. After the argon flushing stopped, the oxygen concentration gradually increased to 15% within ten minutes. In other samples, dissolved oxygen was removed by adding 1 mol/L sodium sulfite (Na2SO3), which permanently reduced oxygen concentration to 0.4% for the duration of the experiment.
Irradiation with light
The emission spectra of the light sources used in this study can be found in our earlier publication.Citation37 A blue light illuminator, made in-house, composed of four luminescence tubes (Philips TL 40 W/03; Philips, Amsterdam, the Netherlands) gives a broad emission band at 390–460 nm with a peak at ~420 nm. Samples were placed on the lamp, and the fluence rate was 11 mW/cm2 at the position of the samples. A commercially available red light source (Aktilite CL128) was kindly provided by PhotoCure ASA (Oslo, Norway). This lamp has an LED array with a peak at ~630 nm. The distance between the bottom of the cuvette with the sample and the outer surface of the LED lamp was 10 cm and the measured fluence rate was 80 mW/cm2 at the position of the bottom of the cuvette. The fluence rate of both lamps was measured with a Newport model 1815-C power meter (Newport Corp, Irvine, CA) equipped with a photodiode detector (818-SL) and attenuation filter (883-SL). The final concentration of QD655 was 10 nmol/L in PBS. The lipodots were mixed with PBS in 1:1 ratio (v/v).
Determination of free radical generation capacity
Generation of free radicals and reactive oxygen species (ROS) was determined by measuring the appearance of Rh123, which is the oxidation product of its reduced non-fluorescent form DHR (Sigma-Aldrich). During the oxidation of DHR, absorbance and fluorescence increases.Citation38 Its absorption and fluorescence bands are at 490–500 nm and 530 nm, respectively. For irradiation with the red LED light, 1 μM DHR with or without QD655 (10 nmol/L) was prepared in standard 1 cm path length acrylic cuvettes. One cuvette at a time was placed into a cuvette holder, which was connected with fibers to an Ocean Optics USB2000FL fluorescence spectrometer. The LED lamp was placed above the cuvette holder, and the red light was directed downward on the cuvette. The live acquisition mode of Ocean Optics software was activated during the irradiation, allowing it to record continuous oxidation kinetics.
To measure oxidation kinetics individually for each sample, background fluorescence, F0, of the radical scavenger (1 μM DHR) before irradiation and that of oxidized probes during irradiation, FOX(t), were measured over time, t. Total oxidant capacity (100% oxidized probe) was assessed by adding 1 mM of the radical generator 2,2′-azobis(2- amidinopropane) dihydrochloride (AAPH) to each sample and then determining the FMAX fluorescence value for each sample:
The profile of DHR oxidation follows saturation kinetics showing the suitability of DHR to determine maximal reactive oxygen species (ROS) capacity of solutions. At room temperature, DHR can be considered maximally oxidized after around 48 hours with AAPH added. It has been previously observed that an equimolar concentration of fully oxidized DHR gives half the fluorescence intensity compared to that of the pure compound Rh123.Citation39 However, studying reasons for this discrepancy was outside the scope of this study.
Results and discussion
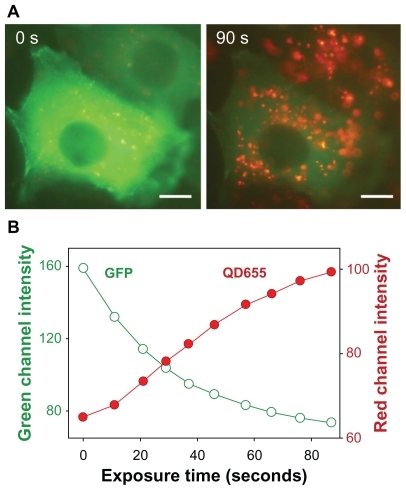
The lack of significant therapeutic effect of QDs described in our previous workCitation36 can be partly explained by the quenching of their fluorescence upon entry to the cells (, left photo). During continuous observation of the cells under the microscope using its blue excitation light, red fluorescent dots appear with granular distribution (, right photo). Concomitantly with the increase of QD fluorescence, photo-bleaching of actin-GFP staining was observed ().
Figure 1 (A) Microscopy photographs of Du145 cells showing development of red fluorescent spots originating from QD655 with simultaneous photobleaching of actin-GFP during illumination with the microscope excitation light (450–480 nm). Scale bar corresponds to 10 μm. (B) Pixel intensity kinetics of the QD fluorescence increase and actin-GFP photobleaching.
Abbreviations: GFP, green fluorescent protein; QD, quantum dot.
A similar phenomenon of dimming and photoactivation of QD fluorescence in cultures in vitro was observed by Silver and Ou for QD655-poly-L-lysine-streptavidin in HeLa cells,Citation40 Clarke et al for QD560-dopamine in A9 cells,Citation28 and in our previous studies for non-targeted QD655 in Du145 cells.Citation31,Citation36 Silver and OuCitation40 postulated that fluorescence quenching could be attributed to the interaction of QDs with cellular molecules, particularly lysosomal enzymes. However, the authors notice that, if extensive QD degradation takes place in lysosomes, a blue-shift in QD fluorescence should be observed, which was not the case.Citation40 Such photo-activation (photo-enhancement) of fluorescence has been observed in solutions of free QDs after exposure to sunlight,Citation41 UV radiation,Citation42 and blue lightCitation43 or QDs embedded in silica colloids under UV radiation.Citation44 Normally, a decrease in QD fluorescence intensity occurs due to oxidative decay of the CdSe lattice in the presence of oxygen, while in nitrogen, photobleaching is absent.Citation45 Dembski et alCitation44 proposed that UV radiation generates excitons, which form O2 − from the oxygen adsorbed on the surface of QDs: when irradiation stops, O2 − dissociates, diminishing the oxygen passivation effect and thus decreasing QD fluorescence. However, irradiation for a longer period will lead to oxidation of the QD surface and desorption of SeO2 and SO4 −,Citation44 accompanied by the release of Cd2+ and Zn2+.Citation35 This will smooth the QD surface, leading to elimination of surface defects, increase of radiative recombination, reduction of particle size, and permanent enhancement of fluorescence.Citation42,Citation44 Overall, it is reasonable to assume that fluorescence properties of QDs and efficiency of radiative electron-hole recombination depend on the QD surface and its environment.Citation46,Citation47 Events responsible for such photo-reversible fluorescence of QDs have not yet been completely understood.Citation48
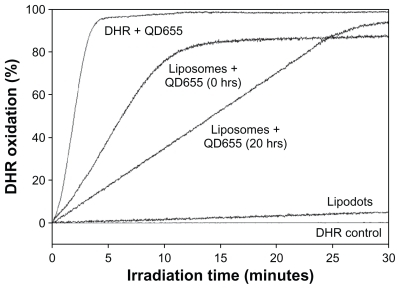
Along the endosomal pathway, large multilamellar/multivesicular granules (late endosomes and lysosomes) may be formed.Citation49 Therefore, incorporation of QDs in a liposome model probably resembles the real situation QDs meet upon their entry into cells. To prepare model membranes, a fast, low cost, and convenient method was employed as described earlier by MacDonald et al.Citation50 It has been shown that small unilamellar vesicles (SUVs) or multilamellar vesicles (MLVs) of variable sizes can be produced simply by extruding hydrated phospholipids through a polycarbonate filter.Citation51 Dynamic light scattering (DLS) measurements show that the average size of QD655 was ~26 nm and that of the liposomes was ~200 nm (). This corresponds practically to the size determined by the electron microscopy. QD655 represents spherical to elongated quantum dots from 6 to 12 nm in size. Liposomes are a mixture of unilamellar and multilamellar vesicles of variable sizes, 100–400 nm. Transmission electron microscope (TEM) images show that liposomal QDs (lipodots) contain dots indicating a QD655 inclusion within the liposomes or their membranes (). The encapsulation efficiency practically matches theoretical calculations: about four QDs expects to be distributed in a volume of a 400 nm liposome corresponding to the concentration 10 nmol/L QD655. Generation of free radicals by lipodots, as assayed using a radical scavenger DHR, was nearly inhibited compared to that of the free QDs in water (). This shows that, upon endosomal entrapment, QDs are destined to lose their ability to act as photosensitizers inside a cell.
Figure 2 Size distribution chart of QD655 and lipodots measured using the DLS technique.
Abbreviations: QD, quantum dot; DLS, dynamic light scattering.
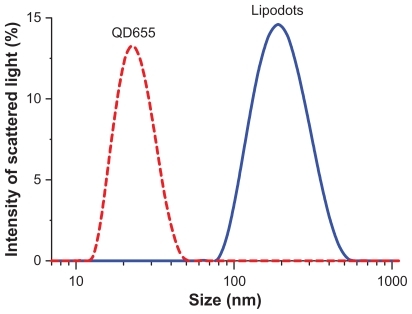
Figure 3 TEM images of the nanoparticles: (A) Empty liposomes as unilamellar and multilamellar vesicles of variable sizes (100–400 nm); (B) spherical to elongated QD655 from 6 to 12 nm in size; (C1) common view of the lipodots; (C2–C5) Magnified images of the lipodots of similar magnification.
Abbreviation: TEM, transmission electron microscope.
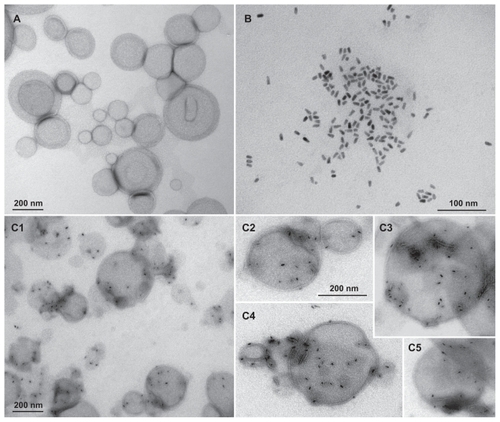
Figure 4 Oxidation kinetics of dihydrorhodamine123 by intact quantum dots QD655, lipodots, and in a mixture with empty liposomes (liposomes + QD655 incubated for 0 or 20 hours) during irradiation with 630 nm light.
Abbreviations: QD, quantum dot; DHR, dihydrorhodamine.
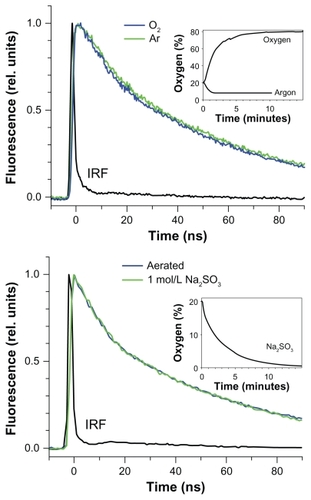
We also considered the possibility that fluorescence changes could be attributed to variations in intracellular oxygen concentrations. However, we did not observe significant differences in fluorescence decay kinetics of QDs in the presence or absence of oxygen (). Argon bubbling does not remove all the oxygen from the aqueous solution. In the presence of sodium sulfite, which is a very effective oxygen scavenger, the QD fluorescence decay kinetics was similar to that in the aerated solution. The QDs used in this study possess high fluorescence stability and good capping layer formulation. The layer successfully prevents the QDs from dynamic quenching by molecular oxygen. Opposite to what is expected in the presence of oxygen (decrease of lifetime due to energy transfer from QDs to nearby oxygen molecules), Anas et al actually reported fluorescence increase in the presence of oxygen.Citation52 Furthermore, photo-enhancement of QD fluorescence was observed both in air and in nitrogen saturated cellsCitation53 and solutions.Citation54 This presumably can be attributed to residual oxygen adsorbed on the QD surfaceCitation54 and the oxygen passivation effect.Citation55 Passivation is the process of making a material passive in relation to another material. In case of QDs, different materials (eg, trioctylphosphine [TOP] and its oxide, trioctylphosphine oxide [TOPO]; amines; mercapto-terminated molecules; and carboxyls) are used as surface ligands (known as passivating ligands) to prevent agglomeration of QDs during synthesis, protect their surfaces, and make them soluble in various solvents.Citation56 Capping with a shell such as a ZnS-shell layer can also passivate surface defects.Citation57 Surface states not blocked by capping ligands may form surface defects such as Cd and/or Se dangling bonds, introducing energy trap states that are involved in nonradiative recombination. Type and quality of surface passivating ligands are important for the optical and electrochemical properties of QDs.Citation58 Surface passivation by oxygen (chemical or physical adsorption) eliminates such defects, causing an increase in radiative recombination.Citation59 However, a series of redox processes mediates further surface oxidation in airCitation60 or under UV exposureCitation45 leading to SeO2, CdO, CdSeO3, and CdSeO4 formation and particle size reduction.
Figure 5 Comparative analysis of fluorescence decay of QD655 in aerated solution and in the absence or presence of oxygen in the solution. Distilled water was bubbled either with oxygen or argon gas for 15 minutes prior to the addition of the QDs. Oxygen was also removed by adding sodium sulfite to the QD solution. Each curve is an average of three separate measurements. The inserts show oxygen concentrations in water during bubbling with pure oxygen or argon and after adding sodium sulfite.
Abbreviations: QD, quantum dot; IRF, infrared fluorescence.
Endosomal entrapment is one of the problems QDs encounter upon entry into a cell. This could be the reason for the lack of significant photoeffect on cell killing by QDs.Citation36 For an efficient photosensitization, QDs must reach and interact with vital parts of the cell, and the first barrier to this action is their persistence in endosomes and lysosomes. This study was further focused on investigating photophysical changes of QDs encapsulated in lipid vesicles in comparison to intact QDs with the goal to understand how to overcome quenching of both fluorescence and phototoxicity of QDs. Artificial phospholipid nanoparticles (liposomes) may serve as a simplified model to investigate the effects of endosomal/lysosomal vesicles on the photophysical properties of QDs in a cell. Indeed, red fluorescence of QDs is quenched () and its lifetime decreases () upon their encapsulation in phospholipid vesicles, while the presence of surfactant or empty liposomes has no or little effect on the lifetime, respectively. It has already been shown that irradiation with blue light increases the fluorescence of endocytosed QDs in cellsCitation53 and presumably leads to rupture of lysosomes.Citation40 Our liposomal model confirms this by showing an increase in fluorescence intensity after irradiation (). The fluorescence lifetime of QDs also increased after irradiation with blue or red light, which was irreversible, as after 24 hours the lifetime remained unchanged (). Interestingly, mixing QDs with empty liposomes also resulted in a decreased fluorescence lifetime showing self-assembly of QDs with lipid vesicles (). Just as for the lipodots, the irradiation caused an increase in fluorescence lifetime of such QD-phospholipid assemblies (). However, differently from the liposomes that irreversibly leaked (, curve 2 vs curves 4 and 5 for lipodots), after irradiation the QDs reassembled with the empty liposomes, resulting again in decreased fluorescence lifetime (, curve 3 vs curves 4 and 5 for QD655).
Figure 6 (A) Fluorescence spectra of QD655 in PBS and lipodots. (B) Fluorescence decay of QD655 in different solutions. Fluorescence intensity is normalized to 1 at initial values.
Abbreviations: QD, quantum dot; PBS, phosphate buffered saline.
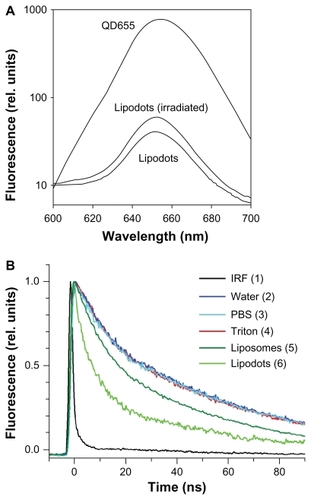
Figure 7 The effect of irradiation with red or blue light on fluorescence decay of lipodots. The fluorescence decay of QD655 is shown for comparison (curve 2). The same sample of lipodots was irradiated for 15 minutes (curve 4) and then for an additional 15 minutes (curve 5) for a total of 30 minutes either with the red or blue light. The curves are averages of three separate measurements. The fluorescence decay of the irradiated lipodots remained unchanged when measured 24 hours after the irradiation. See supporting material for calculated fluorescence decay times.
Abbreviations: IRF, infrared fluorescence; PBS, phosphate buffered saline.
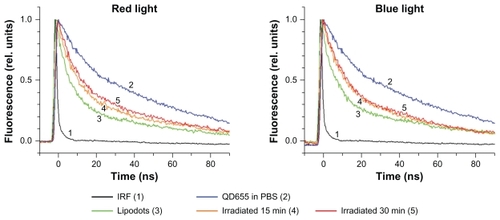
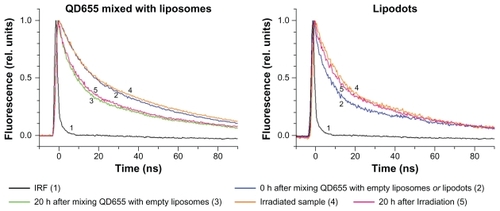
Figure 8 Fluorescence decay of intact QD655 in suspension of empty liposomes and of QD655 encapsulated in liposomes (lipodots). Fluorescence decay was measured immediately after addition of QD655 to the suspension of empty liposomes or the preparation of lipodots (0 hours, curve 2) and then after 20 hours storage at room temperature of the QD655 mixture with liposomes (curve 3). Further, the samples were irradiated with the blue light for 30 minutes, and their fluorescence decays were measured (curve 4). Lipodots were irradiated soon after sample preparation, while the QD655 mixture with empty liposomes was kept 20 hours prior to the irradiation. Finally, after the irradiation, both samples were kept for 20 hours at room temperature, and their fluorescence decay was measured again (curve 5).
Abbreviation: QD, quantum dots.
It must be noted that nonspecific passive delivery of QDs, though noninvasive and supposedly not compromising cell integrity and viability, completely relies on endocytosis.Citation61,Citation62 However, similar QDs from clathrin-coated pits can be destined for different fates after internalization: sent back to the cell surface, trafficked toward a degradative fate in endosomes and lysosomes, or to the perinuclear recycling endosomal compartment, depending on cell phenotype.Citation63 This means that internalization and trafficking of QDs, though highly controlled by the cell, can be manipulated by choosing proper targeting ligands. To increase passive intracellular loading, QDs may be coupled with ligands targeting surface membrane receptors such as growth factors or folate.Citation64,Citation65 Active techniques like electroporation and microinjectionCitation66,Citation67 can deliver these nanocrystals directly into the cytosol, but such delivery is invasive and was outside the scope of this paper. Quantum dots bioconjugated to different ligands, which are normally transported from endosomes to the Golgi apparatus, have also been found arrested in endosomes without routing them to Golgi.Citation68 Thus, such endosomal-lysosomal entrapment of bare or bioconjugated QDs may affect cell physiology as well as the imaging/therapeutic potential, preventing QDs from finding intracellular targets.Citation17 Peptide-coated QDs are a novel strategy to enhance QD delivery in mammalian cells. Cationic arginine-type peptide has been shown to increase endocytosis with subsequent transport of QDs to lysosomes.Citation69 Bioconjugation of QDs with cell-penetrating polyarginine-type peptide has resulted in partial colocalization of the QDs within endosomes.Citation70 Furthermore, coating with hyper-branched copolymer ligands has demonstrated an endosome-disrupting effect (endosomolysis).Citation71 The osmotic-imbalance strategy can also be employed by dipeptides that are cleaved by lysosomal dipeptidase.Citation72 Approaches like endosomal escape, non-endocytic uptake routes, and endosomal disruption may facilitate targeting of intracellular organelles by QDs.Citation66
One possible approach to overcome this endocytic control system for specific QD delivery inside the cell and additional specificity for QD delivery in vivo is loading of QDs into lipid-based polymers.Citation66 Hydrophobic QDs can be entrapped into phospholipid micelles or in a lipid bilayer of liposomes, while hydrophilic QDs will localize in the central aqueous compartment of such liposomes. There are significant findings in liposome-mediated drug delivery for photodynamic therapy, and at least one liposome-based commercial photosensitizer is available for clinical application already,Citation73 making liposomes of particular interest for specific QD delivery. Schroeder et al recently developed lipodotsCitation74 with QDs entrapped in a lipid shell for effective folate receptor targeted delivery of QDs. Liposomal QDs show improved shelf life stability and intracellular delivery.Citation75,Citation76
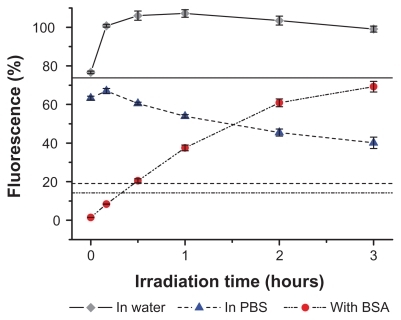
We have further checked the possibility of intracellular proteins to exert an effect on QD fluorescence. Indeed, in a model solution after incubation at room temperature with BSA, QD fluorescence lifetime decreased (, curve 2 vs 3) and after ~100 h, the fluorescence was completely quenched (). Such fluorescence decrease is due to static quenching through Förster Resonance Energy Transfer (FRET). The PEG layer of the QDs serves as a capping agent providing steric hindrance. The protein molecule needs time to reach the inorganic part of the QDs. Increasing temperature lowers the PEG density and facilitates the protein adhesion to the QD surface. Ipe and Niemeyer observed a decrease of QD fluorescence in the presence of cytochrome.Citation33 Interestingly, the authors detected triggering of the enzyme activity supposedly due to its photoactivation by QDs. Furthermore, just like photo-enhancement of QD fluorescence in cells or lipodots, we demonstrated photo-enhancement of QD fluorescence in aqueous solutions with BSA (). Immediately after irradiation, the fluorescence lifetime increased, and the decay curve was comparable to the initial one (, curve 2 vs 4). However, additional storage after irradiation caused readhesion of BSA to QDs and decrease in fluorescence lifetime (, curve 4 vs 5). Lifetimes of QD fluorescence in different environments are summarized in .
Table 1 Fluorescence lifetimes of QD655 in different solutions and the fluorescence lifetimes of lipodots before and after irradiation with the blue light
Figure 9 The effect of storage time and irradiation on the fluorescence decay of QD655 in (A) PBS and (B) 1% BSA in PBS. The fluorescence lifetime of QD655 was measured immediately after addition of the QDs to the solutions (0 h, curve 2) and then after the samples had been stored for 20 hours at room temperature in darkness (curve 3). The samples were irradiated with the blue light lamp for 3 hours, and their fluorescence lifetimes were measured (curve 4). Finally, the irradiated samples were stored for an additional 20 hours at room temperature in darkness, and fluorescence decay was measured again (curve 5).
Abbreviations: BSA, bovine serum albumin; PBS, phosphate buffered saline.
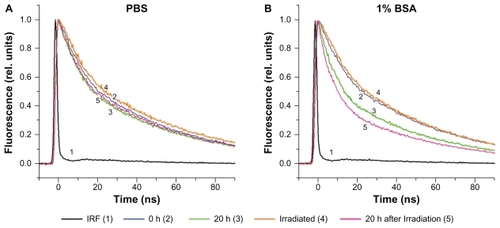
Figure 10 QD655 stability in different solvents: distilled water (A), PBS (B), and 1% BSA in PBS (C) at different temperatures. The dashed line (------) represents samples kept at room temperature (22°C) after being heated up to the highest temperature (65°C) to monitor possible recovery of fluorescence. The intensity kinetics were calculated as a percentage relative to the initial fluorescence intensity. Each data point represents an average of three independent samples with standard deviation.
Abbreviations: BSA, bovine serum albumin; PBS, phosphate buffered saline; QD, quantum dot.
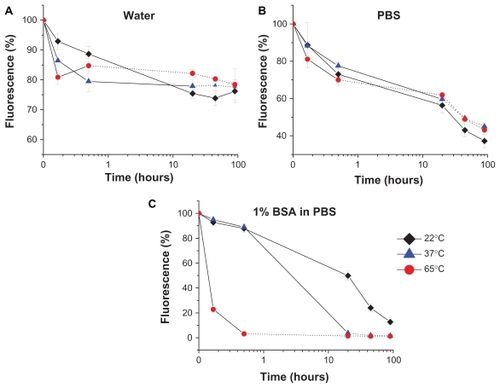
Figure 11 Fluorescence recovery of QD655 after irradiation with blue light. The samples of 10 nmol/L QD655 in different solvents (distilled water, PBS, and 1% BSA in PBS) were kept for 20 hours at 37°C and then for an additional 25 hours at room temperature (22°C) prior to the irradiation. The samples were irradiated with the blue light lamp. The intensity kinetics were calculated as a percentage relative to the initial fluorescence intensity. Each data point represents an average of three independent samples with standard deviation. The horizontal lines represent fluorescence of the samples 42 hours after the end of the irradiation.
Abbreviations: BSA, bovine serum albumin; PBS, phosphate buffered saline; QD, quantum dot.
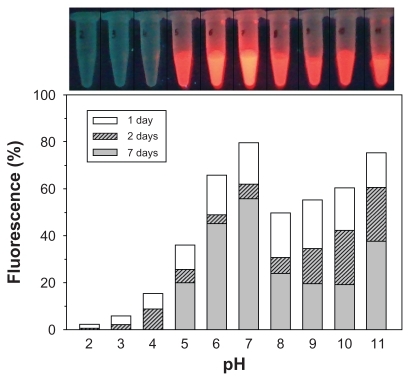
It is well known that different cell organelles have different aciditiesCitation77 to sustain certain pH-sensitive enzyme profiles.Citation78 Although the mechanisms by which intracellular vesicle trafficking regulated by an acidic pH remain unclear, the approximate intravesicular pH values are established to be around 5.5–6.5 for the endosomes, lysosomes, and trans-Golgi network and 7.2 for the endoplasmic reticulum and cytosol.Citation78 In formaldehyde-fixed cells, it has been noticed that QDs lost their fluorescence when the cells were immersed in a buffer of pH 4.6.Citation79 In the present study, we have thus investigated whether fluorescence quenching in living cells could be explained by the acidic environment in endosomes and lysosomes. Clearly, the QD fluorescence profile is pH dependent () with maximal photoluminescence intensity at pH 7 (corresponding to that of cytosol) and only 20%–30% of the initial intensity at pH 5 (equivalent to that of lysosomes). Acidic aqueous solution contains protons in abundance, which can etch the ZnS layer of the QDs, thus impairing surface passivation effect and decreasing radiative recombination. Since the photoluminescence intensity was not completely quenched at pH 5–6, loss of QD fluorescence in living cells cannot be explained solely by the low pH of these organelles. Upon entrapment in vesicles, the effect of self-quenching by high local fluorophore concentrations could be another possible factor.Citation80
Figure 12 Stability of QD655 fluorescence at different pH under storage for several days. Fluorescence intensity measured immediately after sample preparation corresponds to 100%.
Conclusions
The present study using an in vitro liposomal model has demonstrated that QDs lose their fluorescence and photosensitizing action when entrapped in phospholipid vesicles. In addition, acidic environment (pH < 6) and protein adsorption also leads to quenching of QD fluorescence. Our model mimics the effect of the QD fluorescence quenching and reappearance as it happens in endocytic vesicles of living cells. Design of QDs that can either escape endosomes or lysosomes, or are routed through other internalization pathways to avoid entrapment in endocytic vesicles, is desirable to make them suitable for photodynamic applications.
Acknowledgments
This study was financed by the NANOMAT program of the Research Council of Norway (project number 182058). The work of S (Lukoseviciute) Kavaliauskiene was supported in part by the Norwegian Radium Hospital Research Foundation (project number FU0802) and in part by the European Commission’s ERASMUS Lifelong Learning Programme (LLP). Wei Chen would like to acknowledge the support from the startup funds from UTA, the NSF and DHS joint ARI program (2008-DN-077-ARI016-03, CBET-1039068), DOD DTRA08-005, and the US Army Medical Research Acquisition Activity (USAMRAA) under Contracts of W81XWH-10-1-0279 and W81XWH-10-1-0234. The authors thank Sandra Rocha for assistance with TEM technique.
Disclosure
The authors report no conflicts of interest in this work.
References
- AlivisatosPThe use of nanocrystals in biological detectionNat Biotechnol200422475214704706
- KlimovVISemiconductor and Metal Nanocrystals: Synthesis and Electronic and Optical PropertiesNew YorkMarcel Dekker2004
- AlivisatosAPSemiconductor clusters, nanocrystals, and quantum dotsScience1996271933937
- BoatmanEMLisenskyGCNordellKJA safer, easier, faster synthesis for CdSe quantum dot nanocrystalsJ Chem Edu20058216971699
- KippenyTSwaffordLARosenthalSJSemiconductor nanocrystals: A powerful visual aid for introducing the particle in a boxJ Chem Edu20027910941100
- SmithAMDuanHMohsAMNieSBioconjugated quantum dots for in vivo molecular and cellular imagingAdv Drug Deliv Rev2008601226124018495291
- AlivisatosAPPerspectives on the physical chemistry of semiconductor nanocrystalsJ Phys Chem19961001322613239
- AlivisatosAPGuWLarabellCQuantum dots as cellular probesAnnu Rev Biomed Eng20057557616004566
- RajanSSLiuHYVuTQLigand-bound quantum dot probes for studying the molecular scale dynamics of receptor endocytic trafficking in live cellsACS Nano200821153116619206333
- ChenHTitushkinIStroscioMChoMAltered membrane dynamics of quantum dot-conjugated integrins during osteogenic differentiation of human bone marrow derived progenitor cellsBiophys J2007921399140817114225
- GondaKWatanabeTMOhuchiNHiguchiHIn vivo nano-imaging of membrane dynamics in metastatic tumor cells using quantum dotsJ Biol Chem20102852750275719917603
- LeviVGrattonEExploring dynamics in living cells by tracking single particlesCell Biochem Biophys20074811517703064
- WarshawDMKennedyGGWorkSSKrementsovaEBBeckSTrybusKMDifferential labeling of myosin V heads with quantum dots allows direct visualization of hand-over-hand processivityBiophys J200588L303215764654
- GaoXCuiYLevensonRMChungLWKNieSIn vivo cancer targeting and imaging with semiconductor quantum dotsNature Biotechnol20042296997615258594
- SmithAMDaveSNieSTrueLGaoXMulticolor quantum dots for molecular diagnostics of cancerExpert Rev Mol Diagn2006623124416512782
- MichaletXPinaudFFBentolilaLAQuantum dots for live cells, in vivo imaging, and diagnosticsScience200530753854415681376
- SmithAMRuanGRhynerMNNieSEngineering luminescent quantum dots for in vivo molecular and cellular imagingAnn Biomed Eng20063431416450199
- GhasemiYPeymaniPAfifiSQuantum dot: magic nanoparticle for imaging, detection and targetingActa Biomed20098015616519848055
- JiangSGnanasammandhanMKZhangYOptical imaging-guided cancer therapy with fluorescent nanoparticlesJ R Soc Interface2010731819759055
- AkermanMEChanWCLaakkonenPBhatiaSNRuoslahtiENanocrystal targeting in vivoProc Natl Acad Sci U S A200299126171262112235356
- SongEQZhangZLLuoQYLuWShiYBPangDWTumor cell targeting using folate – conjugated fluorescent quantum dots and receptor–mediated endocytosisClin Chem20095595596319282359
- OzkanMQuantum dots and other nanoparticles: what can they offer to drug discoveryDrug Discov Today200491065107115582795
- NurunnabiMChoKJChoiJSHuhKMLeeYKTargeted near-IR QDs-loaded micelles for cancer therapy and imagingBiomaterials2010315436544420409581
- BakalovaROhbaHZhelevZIshikawaMBabaYQuantum dots as photosensitizersNat Biotechnol2004221360136115529155
- SamiaACDayalSBurdaCQuantum dot - based energy transfer: perspectives and potential for applications in photodynamic therapyPhotochem Photobiol20068261762516475871
- BijuVMundayoorSOmkumarRVAnasAIshikawaMBioconjugated quantum dots for cancer research: present status, prospects and remaining issuesBiotechnol Adv20102819921319969062
- IpeBILehnigMNiemeyerCMOn the generation of free radical species from quantum dotsSmall2005170670917193510
- ClarkeSJHollmannCAZhangZJPhotophysics of dopamine-modified quantum dots and effects on biological systemsNature Materials20065409417
- ZhangYAslanKPreviteMJGeddesCDPlasmonic engineering of singlet oxygen generationProc Natl Acad Sci U S A20081051798180218252825
- SamiaACChenXBurdaCSemiconductor quantum dots for photo-dynamic therapyJ Am Chem Soc2003125157361573714677951
- JuzenasPGeneralovRJuzenieneAMoanJGeneration of nitrogen oxide and oxygen radicals by quantum dotsJ Biomed Nanotechnol20084450456
- GingerDSGreenhamNCElectrical properties of semiconductor nano-crystalsKlimovVISemiconductor and Metal Nanocrystals: Synthesis and Electronic and Optical PropertiesNew YorkMarcel Dekker2004239288
- IpeBINiemeyerCMNanohybrids composed of quantum dots and cytochrome P450 as photocatalystsAngew Chem Int Ed Engl20064550450716365841
- ChangSQDaiYDKangBHanWMaoLChenDUV-enhanced cytotoxicity of thiol-capped CdTe quantum dots in human pancreatic carcinoma cellsToxicol Lett200918810411119446242
- DerfusAMChanWCWBhatiaSNProbing the cytotoxicity of semiconductor quantum dotsNano Lett200441118
- GeneralovRLukoseviciuteSJuzenieneAJuzenasPCytotoxicity and phototoxicity of red fluorescent nontargeted quantum dotsIEEE J Select Top Quantum Electron2010169971003
- GeneralovRChristensenILChenWSunY-PKristensenSJuzenasPGeneration of singlet oxygen and other radical species by quantum dot and carbon dot nanosensitizersProc SPIE20097380738072
- CrowJPDichlorodihydrofluorescein and dihydrorhodamine 123 are sensitive indicators of peroxynitrite in vitro: implications for intracellular measurement of reactive nitrogen and oxygen speciesNitric Oxide199711451579701053
- KooyNWRoyallJAIschiropoulosHBeckmanJSPeroxynitrite-mediated oxidation of dihydrorhodamine 123Free Radic Biol Med1994161491568005510
- SilverJOuWPhotoactivation of quantum dot fluorescence following endocytosisNano Letters200551445144916178255
- JinWJCosta-FernandezJMPereiroRSanz-MedelASurface-modified CdSe quantum dots as luminescent probes for cyanide determinationAnal Chim Acta200452218
- ZhelevZJoseRNagaseTEnhancement of the photoluminescence of CdSe quantum dots during long-term UV-irradiation: privilege or fault in life science researchJ Photochem Photobiol B2004759910515246356
- KorsunskaNEDybiecMZhukovLOstapenkoSZhukovTReversible and non-reversible photo-enhanced luminescence in CdSe/ZnS quantum dotsSemicond Sci Technol200520876881
- DembskiSGrafCKrugerTPhotoactivation of CdSe/ZnS quantum dots embedded in silica colloidsSmall200841516152618712754
- van SarkWGJHMFrederixPLTMVan den HeuvelDJGerritsenHCPhotooxidation and photobleaching of single CdSe/ZnS quantum dots probed by room-temperature time-resolved spectroscopyJ Phys Chem B200110582818284
- MooreDEPatelKQ-CdS photoluminescence activation on Zn2+ and Cd2+ salt introductionLangmuir20011725412544
- JinWJFernandez-ArguellesMTCosta-FernandezJMPereiroRSanz-MedelAPhotoactivated luminescent CdSe quantum dots as sensitive cyanide probes in aqueous solutionsChem Commun (Camb)2005788388515700069
- Carrillo-CarrionCCardenasSSimonetBMValcarcelMQuantum dots luminescence enhancement due to illumination with UV/Vis lightChem Commun (Camb)2009355214522619707627
- ChevallierJGruenbergJLipid membrane domains in endosomesDikicIEndosomesGeorgetown, New YorkLandes Bioscience, Springer Science and Business Media20061422
- MacDonaldRCMacDonaldRIMencoBPTakeshitaKSubbaraoNKHuLRSmall-volume extrusion apparatus for preparation of large, unilamellar vesiclesBiochim Biophys Acta199110612973031998698
- MayerLDHopeMJCullisPRVesicles of variable sizes produced by a rapid extrusion procedureBiochim Biophys Acta19868581611683707960
- AnasAAkitaHHarashimaHItohTIshikawaMBijuVPhotosensitized breakage and damage of DNA by CdSe-ZnS quantum dotsJ Phys Chem B2008112100051001118582008
- ZhangYHeJWangP-NTime-dependent photoluminescence blue shift of the quantum dots in living cells: Effect of oxidation by singlet oxygenJ Am Chem Soc2006128133961340117031951
- WangYTangZCorrea-DuarteMAMechanism of strong luminescence photoactivation of citrate-stabilized water-soluble nanoparticles with CdSe coresJ Phys Chem B20041081546115469
- MyungNBaeYBardAEnhancement of the photoluminescence of CdSe nanocrystals dispersed in CHCl3 by oxygen passivation of surface statesNano Lett20033747749
- InerbaevTMMasunovAEKhondakerSIDobrinescuAPlamadaAVKawazoeYQuantum chemistry of quantum dots: Effects of ligands and oxidationJ Chem Phys200913104410619655836
- YeCParkSKimJThe synthesis of CdSe quantum dots with carboxyl group and study on their optical characteristicsPhys Status Solidi20086924927
- QuernerCReissPSadkiSZagorskaMPronASize and ligand effects on the electrochemical and spectroelectrochemical responses of CdSe nanocrystalsPhys Chem Chem Phys200573204320916240033
- ShuG-WLeeW-ZShuI-JPhotoluminescence of colloidal CdSe/ZnS quantum dots under oxygen atmosphereIEEE Trans Nanotechnol20054632636
- Bowen KatariJEColvinVLAlivisatosAPX-ray photoelectron spectroscopy of CdSe nanocrystals with applications to studies of the nanocrystal surfaceJ Phys Chem19949841094117
- DelehantyJBBradburneCEBoenemanKDelivering quantum dot-peptide bioconjugates to the cellular cytosol: escaping from the endolysosomal systemIntegr Biol (Camb)2010226527720535418
- XiaoYForrySPGaoXHolbrookRDTelfordWGTonaADynamics and mechanisms of quantum dot nanoparticle cellular uptakeJ Nanobiotechnology201081320550705
- BaruaSRegeKCancer-cell-phenotype-dependent differential intracellular trafficking of unconjugated quantum dotsSmall2009537037619089841
- LidkeDSNagyPHeintzmannRQuantum dot ligands provide new insights into erbB/HER receptor-mediated signal transductionNat Biotechnol20042219820314704683
- BharaliDJLuceyDWJayakumarHPudavarHEPrasadPNFolate-receptor-mediated delivery of InP quantum dots for bioimaging using confocal and two-photon microscopyJ Am Chem Soc2005127113641137116089466
- DelehantyJBMattoussiHMedintzILDelivering quantum dots into cells: strategies, progress and remaining issuesAnal Bioanal Chemi200939310911105
- DerfusAMChanWCWBhatiaSNIntracellular delivery of quantum dots for live cell labeling and organelle trackingAdv Mater200416961966
- TekleCDeursBSandvigKIversenTGCellular trafficking of quantum dot-ligand bioconjugates and their induction of changes in normal routing of unconjugated ligandsNano Lett200881858186518570482
- LagerholmBCWangMMErnstLAMulticolor coding of cells with cationic peptide coated quantum dotsNano Letters2004420192022
- DelehantyJBMedintzILPonsTBrunelFMDawsonPEMattoussiHSelf-assembled quantum dot-peptide bioconjugates for selective intracellular deliveryBioconjug Chem20061792092716848398
- DuanHNieSCell-penetrating quantum dots based on multivalent and endosome-disrupting surface coatingsJ Am Chem Soc20071293333333817319667
- BirdSJLloydJBMechanism of lysosome rupture by dipeptidesCell Biochem Funct19951379837758151
- DeryckeASde WittePALiposomes for photodynamic therapyAdv Drug Deliv Rev200456173014706443
- SchroederJEShwekyIShmeedaHBaninUGabizonAFolate-mediated tumor cell uptake of quantum dots entrapped in lipid nanoparticlesJ Control Release2007124283417928088
- YangCDingNXuYFolate receptor-targeted quantum dot liposomes as fluorescence probesJ Drug Target20091750251119489689
- DuduVRamcharanMGilchristMLHollandECVazquezMLiposome delivery of quantum dots to the cytosol of live cellsJ Nanosci Nanotechnol200882293230018572640
- MaedaYKinoshitaTThe acidic environment of the Golgi is critical for glycosylation and transportMethods Enzymol201048049551020816224
- ParoutisPTouretNGrinsteinSThe pH of the secretory pathway: measurement, determinants, and regulationPhysiology (Bethesda)20041920721515304635
- SunYHLiuYSVernierPTPhotostability and pH sensitivity of CdSe/ZnSe/ZnS quantum dots in living cellsNanotechnology20061744694476
- OkuNKendallDAMacDonaldRCA simple procedure for the determination of the trapped volume of liposomesBiochim Biophys Acta1982691332340