Abstract
Background
Silica nanoparticles have been discovered to exert cytotoxicity and induce apoptosis in normal human cells. However, until now, few studies have investigated the cytotoxicity of silica nanoparticles in tumor cells.
Methods
This study investigated the cytotoxicity of 7–50 nm silica nanoparticles in human HepG2 hepatoma cells, using normal human L-02 hepatocytes as a control. Cell nucleus morphology changes, cellular uptake, and expression of procaspase-9, p53, Bcl-2, and Bax, as well as the activity of caspase-3, and intracellular reactive oxygen species and glutathione levels in the silica nanoparticle-treated cells, were analyzed.
Results
The antitumor activity of the silica nanoparticles was closely related to particle size, and the antiproliferation activity decreased in the order of 20 nm > 7 nm > 50 nm. The silica nanoparticles were also cytotoxic in a dose- and time-dependent manner. However, the silica nanoparticles showed only slight toxicity in the L-02 control cells, Moreover, in HepG2 cells, oxidative stress and apoptosis were induced after exposure to 7–20 nm silica nanoparticles. Expression of p53 and caspase-3 increased, and expression of Bcl-2 and procaspase-9 decreased in a dose-dependent manner, whereas the expression of Bax was not significantly changed.
Conclusion
A mitochondrial-dependent pathway triggered by oxidative stress mediated by reactive oxygen species may be involved in apoptosis induced by silica nanoparticles, and hence cytotoxicity in human HepG2 hepatic cancer cells.
Introduction
Due to their special physicochemical characteristics, nanoscaled materials with at least one dimension in the range of 1–100 nm have been increasingly used in food, cosmetics, microelectronics, ceramics, and catalysts. With improvements in their synthesis and surface modification in recent years, application of nanoparticles has extended to the biomedical and biotechnological fields, including cancer therapy,Citation1 medical imaging,Citation2 and drug delivery.Citation3 Of the prominent examples reported, some nanoscaled particles, such as hydroxyapatite and TiO2, have been found to show significant inhibitory effects on the metabolic viability of several types of cancer cells.Citation4–Citation6
Silica nanoparticles are a common type of compound, and have not only been widely utilized in the industrial field, but also in diagnostics, imaging, and drug delivery.Citation7–Citation9 Furthermore, in the past few years, several studies have investigated the toxic effects of silica nanoparticles in vitro and in vivo. These reports have demonstrated that exposure to silica nanoparticles can increase levels of reactive oxygen species and trigger cytokine release and apoptosis in macrophages and other human cells.Citation10 For example, Napierska et al found that 15 nm silica nanoparticles could cause cytotoxic damage and decrease cell survival in human endothelial cells.Citation11 Ye et al reported that 20–50 nm silica nanoparticles induced obvious cytotoxicity and apoptosis in myocardial cells, human hepatic cells, and human embryonic kidney cells,Citation12–Citation14 with oxidative stress being the main contributor to the cytotoxicity induced by silica nanoparticles. Although progress has been made in clarifying the interaction of silica nanoparticles with normal cells, there is still limited knowledge about the effects of silica nanoparticles on tumor cells. Further, the effect of particle size and the underlying molecular mechanisms for their antitumor activity remain unclear.
In this study, the apoptotic and cytotoxic effects of silica nanoparticles on tumor cells were investigated using human HepG2 hepatic cells as the model tumor cell line and a human L-02 hepatocyte cell line as the control. In particular, we studied the effect of silica nanoparticle size on cytotoxicity. The HepG2 cell line was selected because hepatoma is a common primary malignancy of the liver worldwide and this cell line has been widely used as a human hepatoma model in the development of new antitumor medicines.Citation15,Citation16
Materials and methods
Nanoparticles
The silica nanoparticles used in this study were sized 7 nm, 20 nm, and 50 nm, ie, SNP7, SNP20, and SNP50 respectively, and supplied by Shanghai Cabot Chemical Co Ltd. Their physicochemical characteristics are shown in . Fluorescein isothiocyanate (FITC)-labeled silica nanoparticles were prepared as follows. Firstly, 1.0 mg FITC, 5 mL N, N-dimethylformamide, and 20 μL KH550 were mixed by stirring for three hours at room temperature (solution A). Next, the silica nanoparticles were dissolved in 500 mL of ultrapurified water (solution B). Finally, solution A was added dropwise to solution B. The reaction took two hours to complete. FITC-labeled silica nanoparticles were finally obtained after washing several times with ultrapurified water.
Table 1 Physicochemical characteristics of the silica nanoparticles
Cell culture
Human HepG2 hepatoma and normal human L-02 hepatic cell lines were purchased from The Cell Bank of the Type Culture Collection of the Chinese Academy of Sciences, Shanghai, China. HepG2 and L-02 cells were maintained in Dulbecco’s modified Eagle’s medium (Gibco, Carlsbad, CA) supplemented with 10% (v/v) fetal bovine serum (Gibco), 100 U/mL penicillin, and 100 μg/mL streptomycin, and grown at 37°C in a 5% CO2 humidified environment.
Cellular uptake and distribution of silica nanoparticles
To determine the cellular localization of silica nanoparticles, HepG2 and L-02 cells were plated into 6 cm dishes at a density of 5 × 10⁴ cells/mL. After 24 hours of exposure to FITC-labeled SNP20 at a concentration of 320 μg/mL, the dishes were washed twice with phosphate-buffered saline to remove the culture medium. The cells were then fixed using 3.7% paraformaldehyde for 20 minutes and stained with DAPI for 30 minutes at 37°C. Localization of the silica nanoparticles and cell nuclear morphology were observed by fluorescence microscopy. To quantify further the uptake of the silica nanoparticles, HepG2 and L-02 cells were plated into 6 cm dishes at a density of 5 × 10⁵ cells/mL. After 24 hours of exposure to FITC-labeled SNP7, SNP20, and SNP50 at a concentration of 160 μg/mL, the dishes were washed twice with phosphate-buffered saline to remove the culture medium. The cells were collected and centrifuged, then rinsed with 0.1 M phosphate-buffered saline and resuspended in phosphate-buffered saline at a concentration of 1 × 10⁶ cells/mL. Flow cytometry analysis was performed at an emission wavelength of 530 nm for FITC.
Cytotoxicity
HepG2 and L-02 cells were plated into a 96-well culture plate at a density of 3 × 10⁴ cells/mL, and allowed to attach for 12 hours. The silica nanoparticles were then diluted to appropriate concentrations and immediately applied to the cells. Dose-dependent cytotoxicity was assessed by exposing cells to the silica nanoparticles at concentrations of 20, 40, 80, 160, 320, and 640 μg/mL for 48 hours. A time-dependent cytotoxicity study was performed by exposing cells to silica nanoparticles at a concentration of 160 μg/mL for 24, 48, and 72 hours. Viability of the cells was evaluated using the MTT reduction method. The cells were incubated with MTT for four hours, and 200 μL dimethyl sulfoxide was then added to each well to dissolve the dark blue crystal. An optical density of 492 nm was used to monitor cell viability.
Nuclear morphology
HepG2 cells were placed in a six-well culture plate, and treated with SNP20 particles at a concentration of 160 μg/mL for 24 and 48 hours. After rinsing with phosphate-buffered saline (pH 7.4) twice, the cells were fixed by 3.7% paraformaldehyde for 20 minutes. The cell nucleus was then stained with DAPI for 30 minutes at 37°C. The cell nuclear morphology was observed under a fluorescence microscope (excitation 330–380 nm, emission 430–460 nm). Apoptotic cells were identified by nuclear morphology changes, eg, chromatin condensation and fragmentation.
Annexin V-FITC/propidium iodide apoptosis assay
HepG2 and L-02 cells were placed in a six-well culture plate and treated with 160 μg/mL and 320 μg/mL of SNP20 particles for 24 hours. Normal, apoptotic, and necrotic cells were distinguished using an Annexin V-FITC/propidium iodide assay kit (Beyotime Bioengineering Institute, China) according to the manufacturer’s instructions. Thereafter, 1.0 × 10⁶ cells were washed with phosphate-buffered saline, resuspended in 400 μL of binding buffer, and 5 μL of Annexin V-FITC was then added to the samples. After incubation for 15 minutes at 4°C in the dark, 10 μL of propidium iodide was added and incubated for five minutes at 4°C. The flow cytometry analysis was performed within 15 minutes.
Caspase-3 fluorescence assay
HepG2 cells were seeded into a 96-well plate at a density of 5 × 10⁴ cells/well in 100 μL of culture medium. After 24 hours of attachment, the cells were treated with SNP20 at concentrations of 160 μg/mL and 320 μg/mL for 24 hours and 48 hours, respectively. The detached and attached populations were then pelleted by centrifugation (1200 rpm, five minutes). Thereafter, 200 μL of caspase-3 assay buffer was added to each well and the plate was centrifuged at 800 × g for five minutes, after which 100 μL of caspase-3 lysis buffer was added to each well and incubated by gentle shaking on an orbital shaker for 30 minutes at room temperature. After that, the cells were microcentrifuged for 10 minutes (10,000 × g), and 90 μL of the supernatant (cytosolic extract) were transferred to a fresh tube for protein assay. Finally 10 μL of caspase-3 assay buffer was added to appropriate wells and 100 μL of the caspase-3 substrate solution was also added into each well and incubated for 30 minutes. After reaction, the fluorescence intensity of each well was detected under a fluorescence plate reader (excitation 485 nm, emission 535 nm).
Western blotting analysis
HepG2 cells were treated with SNP20 for 48 hours to determine the p53, Bcl-2, Bax, and procaspase-9 proteins. The cells were harvested and lysed, and the total protein concentration was measured using the Bradford protein assay with bovine serum albumin as the standard. The protein samples were separated by 10% sodium dodecyl sulfate gels and transferred to polyvinylidene difluoride membranes (Millipore Corporation, Billerica, MA). After blocking with 5% nonfat dry milk, the membranes were incubated with a dilute solution (1:1000) of primary antibodies including anti-p53, anti-Bax, anti-Bcl-2 anti-procaspase-9, and anti-actin (Santa Cruz Biotechnology Inc, Santa Cruz, CA) overnight at 4°C. The membranes were then exposed to the secondary antibodies, ie, alkaline phosphatase-labeled goat antirabbit immunoglobulin or alkaline phosphatase-labeled goat antimouse immunoglobulin (Santa Cruz), at a dilution of 1:1000. The membrane was washed three times with phosphate-buffered saline containing 0.05% Tween-20 between every antibody binding reaction. Immunodetection using the secondary peroxide-conjugated antibody and chemiluminescence were performed according to the manufacturer’s instructions. Equal protein loading was verified by probing with the anti-β actin antibody.
Reactive oxygen species and glutathione assays
To compare particles with different sizes in the reactive oxygen species and glutathione assays, we chose SNP7 and SNP20, which have been shown to have strong cytotoxic effects on HepG2 in MTT assays. Intracellular reactive oxygen species were detected using 2′, 7′-dichlorofluorescin diacetate (DCFH-DA, Sigma, Shanghai, China), which is an oxidation-sensitive fluorescence probe. After treatment with 80, 160, and 320 μg/mL of SNP7 and SNP20 for 24 hours, the cells were washed twice with phosphate-buffered saline and then loaded with DCFH-DA 10 μM diluted in serum-free medium and incubated at 37°C for 30 minutes. The intensities of fluorescence were detected using a Synergy 2 multimode microplate reader (BioTek, Beijing, China), with an excitation wavelength of 485 nm and an emission wavelength of 528 nm.
To assay for glutathione, the L-02 cells and HepG2 cells were plated in 6 cm Petri dishes, and treated with 80, 160, and 320 μg/mL of SNP7 and SNP20 for 24 hours. After that, the cells were scraped off, collected, rinsed with phosphate-buffered saline to remove culture medium, and then resuspended in 0.5% cold Triton X-100. Complete cell disruption was achieved by freeze-thawing twice and centrifugation (12,000 g for 15 minutes at 4°C). The supernatant was used for the following assays. Protein concentrations were determined using the bovine serum albumin method. Glutathione, an antioxidant, protects cells from free radicals. Glutathione activity was assayed using a glutathione assay kit (Jiancheng Bioengineering Institute, Nanjing, China) according to the manufacturer’s instructions. The assay utilizes a colorimetric method, and the absorbances at 420 nm were quantitated using spectrophotometry.
Statistical analysis
All experiments were done at least three times unless otherwise indicated. Data are expressed as means ± standard deviation, and statistical significance was tested among and between groups using one-way analysis of variance followed by Dunnett’s post hoc test. Differences with P < 0.05 were considered to be significantly significant.
Results
Physicochemical characteristics
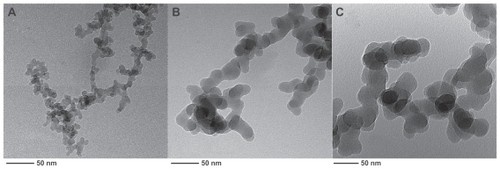
Typical physicochemical properties of the silica nanoparticles are summarized in . As shown, all silica nanoparticles used in this study were in an amorphous phase, and BET surface areas dramatically increased, with reduction in particle size. Transmission electron microscopic images () also confirmed sphere-like silica nanoparticles with approximate diameters of 7 nm, 20 nm, and 50 nm.
Figure 1 Transmission electron microscopic images of silica nanoparticles of three diameters: (A) 7 nm, (B) 20 nm, and (C) 50 nm.
Cellular uptake and sublocalization
FITC has been extensively used as a fluorescence marker to label nanoparticles. In this work, in order to explore the localization and distribution of silica nanoparticles in different cells, FITC was used as the fluorescence marker to label the silica nanoparticles in advance. Cellular uptake and subsequent localization of FITC-labeled silica nanoparticles in HepG2 cells and L-02 cells after 48 hours of incubation are shown in . are the corresponding images of HepG2 cells and L-02 cells without silica nanoparticle exposure for comparison. It can be seen from that the untreated HepG2 cells and L-02 cells were large and spindle-shaped in appearance, and the cell nuclei were round with homogeneous chromatin.
Figure 2 Fluorescence micrographs of HepG2 and L-02 cells treated for 48 hours (200× magnification). (A) vehicle (HepG2), (B) FITC-labeled SNP20 at 160 μg/mL (HepG2), (C) vehicle (L-02), (D) FITC-labeled SNP20 at 160 μg/mL (L-02). Cells were stained with DAPI to visualize nuclear morphology (blue). FITC-labeled SNP20 (green) were localized inside HepG2 cells. The top left quadrants represent the cell nuclei (blue) stained with DAPI. The top right quadrants represent the phase contrast image, the bottom left quadrants represent the FITC-labeled (green) silica nanoparticles, the bottom right quadrants represent the overlay of the top left quadrants and the bottom left quadrants. Also shown are flow cytometry analyses of (E) HepG2 and (F) L-02 cells incubated with 160 μg/mL FITC-labeled silica nanoparticles for 24 hours.
Abbreviations: FITC, fluorescein isothiocyanate; SNP7, size 7 nm silica nanoparticles; SNP20, size 20 nm silica nanoparticles; SNP50, size 50 nm silica nanoparticles.
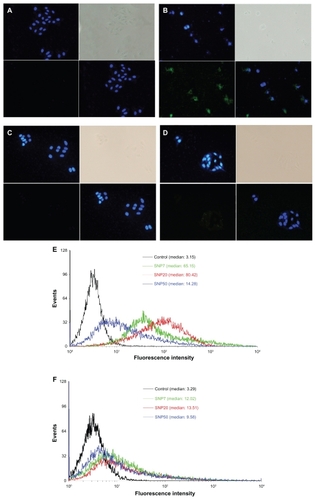
After exposure to silica nanoparticles, as shown in , many silica nanoparticles were located in the cytoplasm and inside the nucleus (, green color) of HepG2 cells, and cells exposed to silica nanoparticles for 48 hours changed greatly in morphology (eg, cell lysis and loss of spindle shape). More cell debris was also found in these samples. However, in the case of L-02 cells, very few silica nanoparticles were inside the cells, and were mainly in the perinuclear region (, green color) and not inside the nucleus. Almost all the L-02 cells were intact and of typical spindle-shaped appearance.
show the flow cytometry analysis of HepG2 and L-02 cells incubated with 160 μg/mL of different sized FITC-silica nanoparticles for 24 hours. As shown, in HepG2, distinct peaks of high fluorescence intensity were observed for cells with internalized FITC-SNP20, but fluorescence intensity was lower for cells incubated with cells having internalized FITC-SNP7 and FITC-SNP50. However, in L-02 cells, slight fluorescence intensity was detected for all kinds of cells with internalized silica nanoparticles.
Cytotoxicity
The cytotoxicity of silica nanoparticles at various sizes to HepG2 and L-02 cells was assessed using the MTT reduction method and the results are shown in . HepG2 cells exposed to SNP7 and SNP20 for 48 hours at dose levels of 80–640 μg/mL showed decreased cell viability as a function of concentration. Also, in contrast, SNP20 particles showed much higher cytotoxicity than SNP7 particles, while SNP50 particles did not have a significant cytotoxic effect on HepG2 cells at any concentration. Also, cell viability after exposure to SNP20 decreased markedly with an increase in concentration. Specifically, when the concentration of SNP20 reached 320 μg/mL, cell viability fell to less than 20% of the control value. shows the cell viability of L-02 cells after treatment with silica nanoparticles of different sizes. It can be seen that when the concentration was below 160 μg/mL, silica nanoparticles 7–50 nm in size showed negligible cytotoxicity. Upon increasing the concentration further to 320 μg/mL and 640 μg/mL, the SNP20 and SNP7 began to show slight toxicity.
Figure 3 Cell viability of (A) HepG2 cells and (B) L-02 cells treated with three different-sized silica nanoparticles at 20–640 μg/mL for 48 hours. Cell viabilities of (C) HepG2 cells and (D) L-02 cells treated with three different silica nanoparticles for 24, 48, and 72 hours (160 μg/mL) versus control group.
Note: *P < 0.05.
Abbreviations: FITC, fluorescein isothiocyanate; SNP7, size 7 nm silica nanoparticles; SNP20, size 20 nm silica nanoparticles; SNP50, size 50 nm silica nanoparticles.
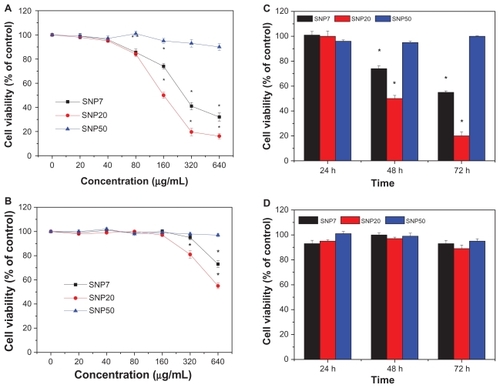
shows that the cell viability of HepG2 cells after exposure to SNP7 and SNP20 at 160 μg/mL decreased dramatically with the passage of time. For SNP20, after 72 hours of exposure, cell viability dropped to 18.5%. However, viability of HepG2 cells decreased slightly by 2%–5% within 72 hours of treatment with SNP50. In the case of L-02 cells, as shown in , no obvious cytotoxicity was observed even after 72 hours of incubation with SNP7, SNP20, and SNP50. Therefore, it can be concluded that the cytotoxicity of silica nanoparticles acted in a size-, dose-, time- and cell-dependent manner. Therefore we used mainly SNP20 particles in the subsequent study.
Apoptosis
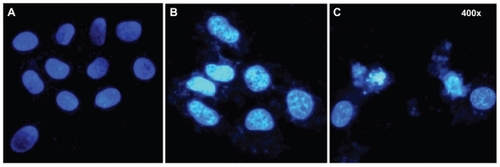
To investigate the influence of particle size on apoptosis, we stained HepG2 cells with DAPI after 24 hours and 48 hours of exposure to SNP20, and checked for cell morphology changes under fluorescence microscopy. shows significant morphological changes in nuclear chromatin after SNP20 treatment for 24 hours and 48 hours. It can be seen that untreated cells (controls) contain round nuclei with homogeneous chromatin and exhibit a less bright blue color (). In contrast, in cells treated with silica nanoparticles, particularly the 48-hour group, the blue emission light in the apoptotic cells is much brighter than that in the untreated cells. The nucleus shows the classical morphological characteristics of apoptosis, ie, reduction in nuclear size, chromatin condensation, and DNA fragmentation ().
Figure 4 Fluorescence micrographs of HepG2 cells treated by SNP20 at 160 μg/mL with (A) vehicle, (B) at 24 hours, and (C) at 48 hours (400× magnification). Cells were stained with DAPI to visualize nuclear morphology. Note that vehicle-treated HepG2 cells contained round nuclei with homogeneous chromatin. The cells treated with SNP20 showed chromatin condensation, reduction of nuclear size, and nuclear fragmentation.
Abbreviation: SNP20, size 20 nm silica nanoparticles.
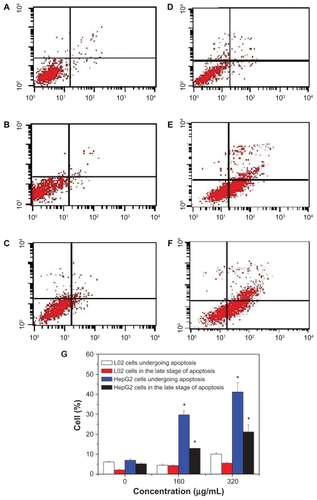
To quantify cell apoptosis further, the HepG2 cells and L-02 cells exposed to SNP20 particles at concentrations of 160 μg/mL and 320 μg/mL were stained using Annexin V-FITC/propidium iodide double-staining and analyzed by flow cytometry. Apoptotic cells that lose asymmetry of their membrane phospholipids leave phosphatidylserine behind on the outer leaflet of the plasma membrane. Annexin V, a calcium-dependent phospholipid-binding protein with a high affinity for phosphatidylserine, can therefore be used as a sensitive probe for the presence of phosphatidylserine on the cell membrane and hence as a marker of apoptosis. Propidium iodide is a nonspecific DNA intercalating agent, which is excluded by the plasma membrane of living cells, and thus can be used to distinguish necrotic cells from apoptotic and living cells by supravital staining without prior permeabilization. The results are shown in , where A–F correspond to the representative dot plots of Annexin V/propidium iodide staining in HepG2 cells and L-02 cells, and shows the calculated percentages of apoptotic cells. For L-02 cells, we can see from that almost no apoptotic cells were detected in controls or cells treated with silica nanoparticles. There were also no apoptotic cells detected in the control HepG2 cells (). However, in the SNP20-treated groups, many apoptotic cells could be found. After 24 hours of incubation with 160 μg/mL of SNP20 particles, the number of HepG2 cells undergoing apoptosis and in late-stage apoptosis are 29.65% and 12.9%, respectively, and the corresponding numbers in the 320 μg/mL group are 41.14% and 21.14% (), indicating that apoptosis induced in HepG2 cells by SNP20 is dose-dependent. These results confirm again that silica nanoparticles induce apoptosis in HepG2 cells and initiate apoptosis in L-02 cells.
Figure 5 Annexin V-FITC/PI double staining analysis of apoptosis in HepG2 cells and L-02 cells (24 hours). (A) L-02 control cells, (B) L-02 cells with SNP20 160 μg/mL, (C) L-02 cells with SNP20 320 μg/mL, (D) HepG2 control cells, (E) HepG2 cells with SNP20 160 μg/mL, (F) HepG2 cells with SNP20 320 μg/mL. Top right quadrant, dead cells in late stage of apoptosis; bottom right quadrant, cells undergoing apoptosis; bottom left quadrant, viable cells. (G) Percentages of apoptosis in L-02 and HepG2 cells. The total percentage of viable cells, cells undergoing apoptosis, apoptotic cells, and necrosis cells is taken as 100%. Typical data are shown from one of three independent experiments with similar results versus control group).
Note: *P < 0.05.
Abbreviations: FITC, fluorescein isothiocyanate; PI, propidium iodide; SNP20, size 20 nm silica nanoparticles.
Effect on apoptotic proteins
In order to understand the effect of silica particles on apoptosis- related proteins in HepG2 cells, two sets of experiments were carried out, ie, one investigating changes in caspase activity and the other investigating alteration in expression of apoptosis-related proteins.
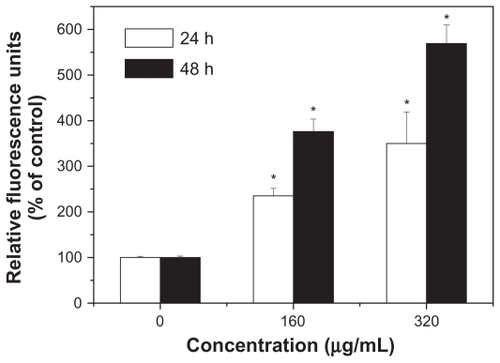
Caspase-3 plays a pivotal role in the terminal phase of apoptosis induced by diverse stimuli, and its activity in HepG2 cells was first measured. As shown in , SNP20 induced a dramatic increase of DEVD-specific caspase-3 activity. In the 160 μg/mL and 320 μg/mL groups, caspase-3 activity was about 2–3-fold higher than that of controls after 24 hours of incubation and about 3–5-fold after 48 hours of incubation. These results indicate that SNP20 induced caspase-3 activity in a dose- and time-dependent manner.
Figure 6 Activation of caspase-3 during apoptosis induced by silica nanoparticles. HepG2 cells were treated with size 20 nm silica nanoparticles at 160 and 320 μg/mL for 24 hours and 48 hours (versus control group).
Note: *P < 0.05.
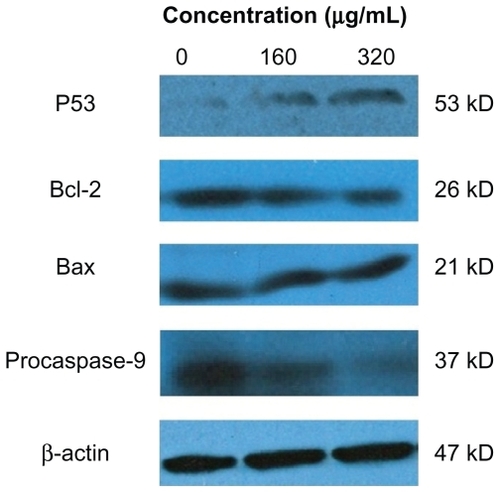
Levels of p53, procaspase-9, Bcl-2, and Bax in HepG2 cells after treatment with silica nanoparticles are shown in . It can be seen that after 24 hours of exposure to SNP20 at 160 μg/mL and 320 μg/mL, the level of p53, a tumor suppressor, increased significantly, and expression of Bcl-2 and procaspase-9 decreased in an obvious dose-dependent manner, while Bax showed little change ().
Figure 7 Effects of size 20 nm silica nanoparticles on p53, Bax, and Bcl-2 protein levels in HepG2 cells. Western blot analysis of p53, Bax, Bcl-2, procaspase-9, and β-actin protein abundances in HepG2 cells. Shown are typical data from one of three independent experiments with similar results.
Intracellular reactive oxygen species and glutathione levels
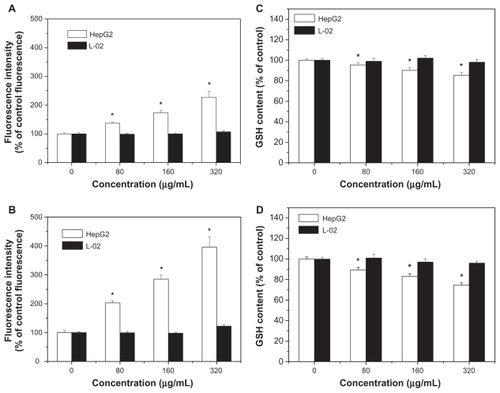
Levels of reactive oxygen species and glutathione serve as reliable indicators of oxidative stress. Results in show that exposure to SNP7 and SNP20 caused a dose-dependent increase in reactive oxygen species level. Reactive oxygen species was strongly increased in cells exposed to 80, 160, and 320 μg/mL of SNP7 and SNP20 compared with the control group. show that SNP7 and SNP20 induced a dose-dependent decrease in glutathione levels. However, no significant alteration of reactive oxygen species and glutathione levels was seen in L-02 cells exposed to silica nanoparticles at all the concentrations tested. There was a significant reverse correlation between reactive oxygen species levels and glutathione levels (R2 = 0.98849, 0.99427). This phenomenon implies that SNP7 () and SNP20 () generate oxidative stress in hepatic tumor cells.
Figure 8 Effects of SNP7 and SNP20 on reactive oxygen species and glutathione levels in HepG2 and L-02 cells. (A) Effect of SNP7 on reactive oxygen species levels, (B) effect of SNP20 on reactive oxygen species levels, (C) effect of SNP7 on glutathione levels, and (D) effect of SNP20 on glutathione levels. (versus control group).
Figure 9 Correlation between reactive oxygen species levels and glutathione levels after 24 hours of exposure to 80, 160, and 320 μg/mL of silica nanoparticles. (A) SNP7 and (B) SNP20.
Abbreviations: SNP7, size 7 nm silica nanoparticles; SNP20, size 20 nm silica nanoparticles; ROS, reactive oxygen species; GSH, glutathione.
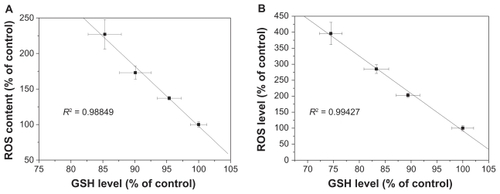
Note: *P < 0.05.
Abbreviations: GSH, glutathione; SNP7, size 7 nm silica nanoparticles; SNP20, size 20 nm silica nanoparticles.
Discussion
With their dramatically increasing applications in the industrial and biomedical fields, the in vitro and in vivo biodistribution and biosafety of silica nanoparticles have attracted more and more attention in recent years.Citation17–Citation19 Previous reports have shown that silica nanoparticles can cause marked proliferative inhibition in myocardial cells, human embryonic kidney cells, and human hepatic cell lines in vitro.Citation9,Citation12,Citation13 It has also been suggested that induction of apoptosis is involved in cytotoxicity. In this study, we wanted to investigate further the effect of silica nanoparticles on cytotoxicity and apoptosis in human hepatoma HepG2 cells. With this classic model cell line, the results reported here may be valuable in the discovery and development of tumor chemotherapy and other antitumor-related research.
Data obtained from in vitro MTT research show that silica nanoparticles 7–50 nm in size induce sharp growth inhibition of HepG2 cells above 80 μg/mL and that the strength of the antiproliferative effect is in the order of SNP20 > SNP7 > SNP50. Also, the results showed that the cytotoxicity of silica nanoparticles occurred in a dose-dependent and time-dependent manner, which is consistent with a trend reported previously.Citation12,Citation13,Citation20 Meanwhile, our data reveal that in normal human L-02 cells, SNP7 and SNP20 exhibited slight cytotoxicity at concentrations of 160 and 320 μg/mL, whereas SNP50 showed almost no cytotoxicity. These results are consistent with a previous report from Ye et al which found that 21 nm silica nanoparticles at concentrations above 300 μg/mL could induce oxidative stress, apoptosis, and cytotoxicity in L-02 cells, but 48 nm and 86 nm silica nanoparticles, even at the concentration of 600 μg/mL, did not exhibit obvious cytotoxicity.Citation13
This noticeable cell- and size-dependent cytotoxicity in human normal and tumor cells aroused our attention. Because of their small size, nanoparticles can interact readily with biomolecules either on the surface of or within cells. Cellular/subcellular distribution of the particles has a considerable influence on protein aggregation, gene expression, and cell cytotoxicity.Citation21,Citation22 Previously, Nel et al had suspected that nanomaterials could penetrate cell membranes, lodge in mitochondria, and trigger injurious responses.Citation23 Recent studies have confirmed that nanomaterials can trigger cytotoxic effects by injuring the plasma membrane.Citation24–Citation26 Therefore, from this point of view, understanding how silica nanoparticles induce cytotoxicity requires study of the trafficking of silica nanoparticles within different cells. In our study, SNP20 which had the greatest difference in cytotoxicity in HepG2 and L-02 cells were used to track the biodistribution of silica nanoparticles. As expected, cellular localization of FITC-labeled 20 nm silica nanoparticles at 160 μg/mL in HepG2 and L-02 cells was very different. Also, the amount of FITC-labeled SNP20 localized inside the HepG2 cells was much greater than that localized in the L-02 cells. Since silica nanoparticles of the same size and from the same batch were used for both types of cells, it can be inferred that the distinct responses of silica nanoparticles to different cells (HepG2 and L-02) might be related to the cell surface properties or uptake capacity of the different cells. Correlating cellular uptake and cytotoxicity in the different cells, it can be hypothesized that few silica nanoparticles translocated into L-02 cells thereby causing little cytotoxicity, whereas more silica nanoparticles localizing inside HepG2 cells initiated more cytotoxicity. Based on this premise, it can be inferred that the size-dependent cytotoxicity of silica nanoparticles in HepG2 might also be related to the amount of silica nanoparticles taken by the HepG2 cells. To investigate this, flow cytometry analysis was used to detect the silica nanoparticle uptake rate by both types of cells. As expected, the results showed that fluorescence intensity was present in a cell- and size-dependent manner, which is consistent with our MTT results.
Apoptosis, or programmed cell death, is an important way to maintain homeostasis in terms of cell division and cell death. Dysregulation of apoptosis is implicated in the development of most cancers. Thus, induction of apoptosis in cancer cells is an important focus in the discovery of anticancer drugs.Citation27 To study the cytotoxicity initiated by silica nanoparticles further, we investigated apoptosis using silica nanoparticles in HepG2. Morphological changes in the nucleus and Annexin V-FITC/PI staining showed distinct dose-dependent induction of apoptosis after 24 hours in HepG2 cells treated with SNP20. It is well accepted that apoptosis requires the activation of a series of caspases, including initiator and effector caspases, which are ubiquitously and constitutively expressed as inactive zymogens in the cytosol.Citation28 The initiator caspase, the hallmark promoter of apoptosis, can be activated by the mitochondria or by death receptors on the cell surface. Because most anticancer drugs are believed to trigger apoptosis via a mitochondria-mediated pathway,Citation26,Citation29 we hypothesize that silica nanoparticles, as a new anticancer biomaterial, might also initiate apoptosis via a mitochondria-mediated pathway. On this premise, we studied changes in mitochondrial-dependent apoptotic protein levels, including caspase-3 activity, which is the most important effector caspase, and the apoptosis-related Bcl-2 family of proteins which control the mitochondrial death pathway. The results show that SNP20 was a potent inducer of caspase-3 activity in HepG2 cells. Furthermore, as mentioned earlier, there are two major apoptotic pathways, ie, the extrinsic pathways (death receptors) and intrinsic pathways (mitochondria), which are initiated by the caspase family of proteins. Therefore, it is feasible to differentiate between them by evaluating the activities of these proteins.Citation30,Citation31 The results of this study indicate that silica nanoparticles could activate caspase-3 and downregulate procaspase-9, which might indicate an activation of caspase-9 in HepG2 cells. These results suggest that silica nanoparticles can potentially change apoptotic protein expression and trigger apoptosis in mitochondria-dependent pathways in HepG2 cells. In addition, HepG2 cells exposed to SNP20 showed decreased expression of Bcl-2, while expression of Bax was equal in each group. In other investigations, the change in Bax/Bcl-2 ratio has resulted in significant activation of caspases, and led to cell death.Citation32,Citation33 These results obtained here suggest that silica nanoparticles could potentially alter apoptotic protein expression and thus trigger apoptosis in a mitochondria-dependent pathway in HepG2 cells.
Recent studies have suggested that p53 has a critical role in the cellular response to DNA damage and apoptosis induced by reactive oxygen species.Citation34,Citation35 Our data for Western blotting () suggest that SNP20-activated p53 mediated the apoptosis response in a dose-dependent manner. This result is consistent with a study by Mroz et al, which showed that nanoparticles and reactive oxidative species could induce DNA damage, activate p53, and mimic irradiation-related carcinogenesis pathways.Citation36
Oxidative stress is now considered to be one of the main triggers of apoptosis in response to the damage done to DNA. With a high amount of oxidative stress, nanomaterials are suspected to be involved in perturbing mitochondrial pores, resulting in apoptosis.Citation23 Roberts et al found that hydroxylated fullerenes at concentrations higher than 20 μM would induce apoptosis in lens cells whether or not the cells were irradiated.Citation37 Foucaud et al stated that the oxidative potential of nanoparticles was a central consideration in measuring their toxicity.Citation38 It is also well established that reactive oxygen species and glutathione are two important biochemical and physiological indicators of intracellular oxidative stress. Previous papers have reported that oxidative stress mediated by reactive oxygen species play a pivotal role in the ability of some materials (nano-TiO2, nano-CeO2, and nano-C60) to disrupt normal cellular function.Citation20,Citation39–Citation41 Our data show that the level of reactive oxygen species in HepG2 cells in the SNP20-exposed group increased substantially when compared with the control group and SNP7-exposed group (). In addition to the increase in reactive oxygen species, the reduced glutathione level indicated lipid peroxidation in HepG2 cells. Therefore, concomitant cellular oxidative stress was manifested by elevated reactive oxygen species levels and reduced glutathione levels. The inverse linear relationship between the reactive oxygen species level and the glutathione level shown in indicates that free radical species were generated by exposure to silica nanoparticles, which reduced intracellular antioxidant levels (R2 = 0.98849 in the SNP7-exposed group; R2 = 0.99427 in the SNP20-exposed group).
Conclusion
In this study, we have demonstrated that silica nanoparticles in the 7–50 nm size range exhibited obvious proliferative inhibition in human hepatoma HepG2 cells in a size-, time-, and dose-dependent manner, whereas they appeared to be less toxic in human normal L-02 cells. Furthermore, oxidative stress mediated by reactive oxygen species, activation of p53, upregulation of Bax/Bcl-2 ratio, and activation of procaspase-9 and caspase-3 expression were involved in the mitochondrial-dependent pathways of apoptosis induced by silica nanoparticles. These findings provide the valuable information that silica nanoparticles alternatively induce antiproliferation effects in HepG2 cells, and a mitochondria-dependent pathway is involved in this nanoparticle-induced apoptosis. Based on these results, it can be concluded that oxidative stress is the possible mechanism underlying the etiology of cytotoxicity and apoptosis induced by silica nanoparticles.
Acknowledgments
The authors appreciate the financial support from the National Natural Science Foundation of China (No 50732002), the Shanghai Nanotechnology Special Foundation (No 0952nm05400), the Fundamental Research Funds for the Central Universities and Program for Changjiang Scholars, and the Innovative Research Team in University (IRT0825).
Disclosure
The authors report no conflicts of interest in this work.
References
- HirschLRStaffordRJBanksonJANanoshell-mediated near-infrared thermal therapy of tumors under magnetic resonance guidanceProc Natl Acad Sci U S A2003100135491355414597719
- SantraSZhangPWangKTapecRTanWConjugation of biomolecules with luminophore-doped silica nanoparticles for photostable biomarkersAnal Chem2001734988499311681477
- VenkatesanNYoshimitsuJItoYShibataNTakadaKLiquid filled nanoparticles as a drug delivery tool for protein therapeuticsBiomaterials2005267154716315967493
- YinMZHanYCBauerIWChenPLiSPEffect of hydroxyapatite nanoparticles on the ultrastructure and function of hepatocellular carcinoma cells in vitroBiomed Mater20061384118458384
- LiuSXuLZhangTRenGYangZOxidative stress and apoptosis induced by nanosized titanium dioxide in PC12 cellsToxicology201026717217719922763
- OberdörsterGToxicology of ultrafine particles: In vivo studiesTrans R Soc Lond2000A35827192740
- BottiniMD’AnnibaleFMagriniAQuantum dot doped silica nanoparticles as probes for targeting of T-lymphocytesInt J Nanomedicine2007222723317722550
- JiaHHouWWeiLXuBLiuXThe structures and antibacterial properties of nano-SiO2 supported silver/zinc-silver materialsDent Mater20082424424917822754
- WangCMaQDouWSynthesis of aqueous CdTe quantum dots embedded silica nanoparticles and their applications as fluorescence probesTalanta2009771358136419084649
- HamiltonRFJrThakurSAHolianASilica binding and toxicity in alveolar macrophagesFree Radic Biol Med2008441246125818226603
- NapierskaDThomassenLCRabolliVSize-dependent cytotoxicity of monodispersed silica nanoparticles in human endothelial cellsSmall2009584685319288475
- YeYLiuJChenMSunLLanMIn vitro toxicity of silica nanoparticles in myocardial cellsEnviron Toxicol Pharmacol20102913113721787594
- YeYLiuJXuJSunLChenMLanMNano-SiO2 induces apoptosis via activation of p53 and Bax mediated by oxidative stress in human hepatic cell lineToxicol In Vitro20102475175820060462
- WangFGaoFLanMYuanHHuangYLiuJOxidative stress contributes to silica nanoparticle-induced cytotoxicity in human embryonic kidney cellsToxicol In Vitro20092380881519401228
- HsiehTJLiuTZLuFJHsiehPYChenCHActinodaphnine induces apoptosis through increased nitric oxide, reactive oxygen species and down-regulation of NF-jB signaling in human hepatoma Mahlavu cellsFood Chem Toxicol20064434435416168547
- ChenCNHuangHHWuCLIsocostunolide, a sesquiterpene lactone, induces mitochondrial membrane depolarization and caspase-dependent apoptosis in human melanoma cellsCancer Lett200724623725216697106
- ServiceRFNanotoxicology: Nanotechnology grows upScience20043041732173415205504
- BrumfielGNanotechnology: A little knowledgeNature200342424624812867950
- MrinmoyDeParthaSRotelloVMApplications of nanoparticles in biologyAdv Mater20082042254241
- LinWHuangYWZhouXDMaYIn vitro toxicity of silica nanoparticles in human lung cancer cellsToxicol Appl Pharmacol200621725225917112558
- JiangWKimBYSRutkaJTChanWCWNanoparticle-mediated cellular response is size-dependentNat Nanotechnol2008314515018654486
- ChenFQGerionDFluorescent CdSe/ZnS nanocrystal-peptide conjugates for long-term, nontoxic imaging and nuclear targeting in living cellsNano Lett2004418271832
- NelAXiaTMädlerLLiNToxic potential of materials at the nanolevelScience200631162262716456071
- SayesCMGobinAMAusmanKDMendezJWestJLColvinVLNano-C60 cytotoxicity is due to lipid peroxidationBiomaterials2005267587759516005959
- HiranoSKannoSFuruyamaAMulti-walled carbon nanotubes injure the plasma membrane of macrophagesToxicol Appl Pharmacol200823224425118655803
- LiSQZhuRRZhuHNanotoxicity of TiO2 nanoparticles to erythrocyte in vitroFood Chem Toxicol2008463626363118840495
- ChoiBHKimWLWangQCKimDCTanSNYongJWHKinetin riboside preferentially induces apoptosis by modulating Bcl-2 family proteins and caspase-3 in cancer cellsCancer Lett2008261374518162289
- NakajimaHMagaeJJTsurugaMInduction of mitochondria-dependent apoptosis through the inhibition of mevalonate pathway in human breast cancer cells by YM529, a new third generation bisphosphonateCancer Lett2007253899617316980
- GradJMCeperoEBoiseLHMitochondria as targets for established and novel anti-cancer agentsDrug Resist Updat20014859111512525
- ChoSGChoiEJApoptotic signaling pathways: Caspases and stress-activated protein kinasesJ Biochem Mol Biol200235242716248966
- HoPKHawkinsCJMammalian initiator apoptotic caspasesFEBS J20052725436545316262685
- ZagurovskayaMShareefMMDasAEGR-1 forms a complex with YAP-1 and upregulates Bax expression in irradiated prostate carcinoma cellsOncogene2009281121113119137013
- CucinaAProiettiSD’AnselmiFEvidence for a biphasic apoptotic pathway induced by melatonin in MCF-7 breast cancer cellsJ Pineal Res20094617218019175854
- CardaciSFilomeniGRotilioGCirioloMRReactive oxygen species mediate p53 activation and apoptosis induced by sodium nitroprusside in SH-SY5Y cellsMol Pharmacol2008741234124518676676
- ChowdhuryRChowdhurySRoychoudhuryPMandalCChaudhuriKArsenic induced apoptosis in malignant melanoma cells is enhanced by menadione through ROS generation, p38 signaling and p53 activationApoptosis20091410812319082730
- MrozRMSchinsRPLiHNanoparticle-driven DNA damage mimics irradiation-related carcinogenesis pathwaysEur Respir J20083124125118057054
- RobertsJEWielgusARBoyesWKAndleyUChignellCFPhototoxicity and cytotoxicity of fullerol in human lens epithelial cellsToxicol Appl Pharmacol2008228495818234258
- FoucaudLWilsonMRBrownDMStoneVMeasurement of reactive species production by nanoparticles prepared in biologically relevant mediaToxicol Lett20071741917888595
- MarkovicZTodorovic-MarkovicBKleutDThe mechanism of cell-damaging reactive oxygen generation by colloidal fullerenesBiomaterials2007285437544817884160
- KangSJKimBMLeeYJChungHWTitanium dioxide nanoparticles trigger p53-mediated damage response in peripheral blood lymphocytesEnviron Mol Mutagen20084939940518418868
- ParkEJChoiJParkYKParkKOxidative stress induced by cerium oxide nanoparticles in cultured BEAS-2B cellsToxicology20082459010018243471