 ?Mathematical formulae have been encoded as MathML and are displayed in this HTML version using MathJax in order to improve their display. Uncheck the box to turn MathJax off. This feature requires Javascript. Click on a formula to zoom.
Abstract
The immune complement (IC) is a cell-free protein cascade system, and the first part of the innate immune system to recognize foreign objects that enter the body. Elevated activation of the system from, for example, biomaterials or medical devices can result in both local and systemic adverse effects and eventually loss of function or rejection of the biomaterial. Here, the researchers have studied the effect of surface nanotopography on the activation of the IC system. By a simple nonlithographic process, gold nanoparticles with an average size of 58 nm were immobilized on a smooth gold substrate, creating surfaces where a nanostructure is introduced without changing the surface chemistry. The activation of the IC on smooth and nanostructured surfaces was viewed with fluorescence microscopy and quantified with quartz crystal microbalance with dissipation monitoring in human serum. Additionally, the ability of pre-adsorbed human immunoglobulin G (IgG) (a potent activator of the IC) to activate the IC after a change in surface hydrophobicity was studied. It was found that the activation of the IC was significantly attenuated on nanostructured surfaces with nearly a 50% reduction, even after pre-adsorption with IgG. An increase in surface hydrophobicity blunted this effect. The possible role of the curvature of the nanoparticles for the orientation of adsorbed IgG molecules, and how this can affect the subsequent activation of the IC, are discussed. The present findings are important for further understanding of how surface nanotopography affects complex protein adsorption, and for the future development of biomaterials and blood-contacting devices.
Introduction
Surface nanotopography has recently been shown to influence events such as cell adhesion, cell viability, and tissue integration.Citation1,Citation2 These findings are expected to greatly influence the development of the next generation of biomaterials.Citation3–Citation5 Although the adsorption of proteins to biomaterial surfaces is considered important for cell response, fundamental knowledge of how nanostructured surfaces affect this event is still insufficient.
A general conception in biomaterials research is that one of the first events to occur when an implant or medical device encounters body fluids is the rapid adsorption of various plasma proteins onto the surface of the material.Citation6–Citation8 Among these are the proteins involved in the immune complement (IC) system. The IC system is part of the innate immune system, and one of its main functions is to act as a first line of defense against foreign objects, and is therefore highly important in the context of biomaterial and implant development.Citation9,Citation10
The adsorption of plasma proteins to nanoparticles has recently been subject to increased research, largely due to their potential as carriers of pharmaceuticals for targeted drug delivery or as adjuvants in vaccines.Citation11,Citation12 When nanoparticles in suspension are exposed to plasma or serum, the protein composition as well as the conformation of the adsorbed proteins is subject to changes which may have implications for a physiological response.Citation12–Citation14 However, on nanostructured surfaces, most studies so far have been carried out in single-protein solutions, and the knowledge of how complex protein solutions such as serum or plasma interact with the surface is therefore limited.
Recently the authors of this paper have been studying different aspects of blood compatibility on a clinically used biomaterial coating comprised of nanosized particles of the noble metals gold (Au), silver (Ag), and palladium (Pd).Citation15 They found that none of the individual metals in the coating could alone explain the low response in IC activation and thrombin/antithrombin complex formation found in their experiments. Based on this, the possibility that the nano-structure itself could have an effect on these events cannot be ignored.
The study of how nanotopography influence protein adsorption and cell adhesion has been considered difficult, since the introduction of a nanostructure on a surface often is associated with a change in surface chemistry.Citation16 This present paper presents a solution to this problem using a simple self-assembly procedure (briefly overviewed in ) where gold nanoparticles are immobilized on a gold substrate and sintered onto the surface by a following washing step. The particles used for surface preparation in the present study are in a size range that has previously been reported to affect adsorption of plasma proteins.Citation6,Citation14
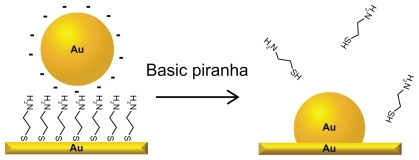
Figure 1 Schematic illustration of the fabrication process of the nanostructured gold surface: citrate protected gold nanoparticles are electrostatically immobilized to a self-assembled monolayer of cysteamine. After washing in basic piranha solution, the particles are integrated with the gold substrate and the cysteamine is desorbed, leaving a clean gold surface.
The IC is comprised of more than 20 different proteins including activation and inhibition factors revolving around the central complement factor 3 (C3). The activation of the complement system on biomaterial surfaces can be triggered via the classical or alternative pathway.Citation17 The classical pathway is activated when the complement protein C1 binds to immunoglobulin G (IgG) molecules adsorbed on a surface. The alternative pathway is independent of C1 activation through antibodies and is instead triggered through the spontaneous hydrolysis of C3 to C3b. It then proceeds, as the reactive thioester part of C3b binds to a surface or to proteins adsorbed on the surface.Citation18 Both pathways generate the surface-bound C3 and C5 convertases. The C3 convertase catalyzes cleavage of C3 into C3b and the soluble peptide C3a, and the C5 convertase cleaves C5 to produce C5b and a soluble C5a peptide. Both C3a and C5a enhance the inflammatory response through stimulation of mast cells and by recruiting macrophages to the complement activating site.Citation19 The authors of this present paper have previously shown that surface-bound complement factor C3b can be measured and used to quantify activation of the IC.Citation20,Citation21
In the present study, fluorescence microscopy and quartz crystal microbalance with dissipation monitoring (QCM-D) was used to study the effects of nanotopography on the activation of the IC system in human serum. Additionally studied was the ability of adsorbed human IgG (a very potent activator of the IC) to activate the IC cascade on the surfaces, and how an increase in hydrophobicity of the nanostructured surfaces affected this ability.
Material and methods
Nanoparticle synthesis
Gold nanoparticles were synthesized through the reduction of Au3+ ions to Au0 by citrate, using a modified version of a protocol described by Kimling et al.Citation22 In brief, 100 mL of 1.5 mM solution of gold salt was prepared by dissolving HAuCl4 (Sigma, St Louis, MO) in ultra-pure water (18.2 MΩ cm). The solution was heated to 60°C and stirred vigorously, and 4 mL of sodium citrate (1% w/v) was then added as the reducing agent. The reaction was stopped after 1 hour, and the solution was diluted 1:2 with 10 mM sodium citrate buffer at pH 4.0. This “stock” solution was then stored at room temperature until use (weeks).
Surface preparation
Gold substrates were purchased from Litcon AB (Gothenburg, Sweden). The substrates were prepared on 10 mm × 10 mm × 0.5 mm silica wafers by RF (radio frequency) sputtering of 150 nm gold on a supporting layer of 10 nm of titanium. The mean surface roughness (Rms) of the gold substrates was 0.9 nm according to atomic force microscopy measurements from the manufacturer. Standard gold QCM-D sensor crystals with an Rms < 3 nm according to the manufacturer, were purchased from Q-Sense (Gothenburg, Sweden). All surfaces were washed for 10 minutes at 80°C in a basic piranha solution containing 5:1:1 Milli-Q® (Millipore, Bedford, MA) water, NH3 (24%) and H2O2 (30%), washed in excess of Milli-Q water, and dried in gaseous N2. Surfaces to be deposited with gold nanoparticles were immersed in 20 mM of cysteamine (Fluka, Buchs, Switzerland) dissolved in 99.5% ethanol, and incubated overnight to establish a self-assembled monolayer (SAM). After incubation, the surfaces were washed three times in 99.5% ethanol and an additional three times in Milli-Q water, and used immediately for particle immobilization.
Hydrophobic surfaces were created by incubation of the gold substrates directly after the washing procedure in 10 μM 1-propane-thiol in 99.5% ethanol overnight.
Immobilization of gold nanoparticles
The stock solution of nanoparticles was centrifuged at 2900 × g for 30 minutes, and the pellet was saved and resuspended in 10 mM sodium citrate buffer. In total, the stock solution was concentrated 2:1. The concentrated particle solution was then incubated on the cysteamine-modified gold surfaces (see above) overnight. The surfaces were washed for 15 minutes at 70°C in basic piranha solution to sinter the particles to the surface and to wash away any residue of cysteamine, and used immediately for the experiments.
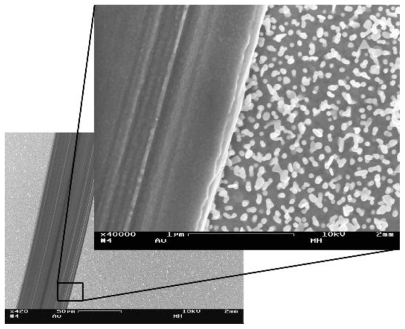
Surfaces to be used for the fluorescent detection of IC activation were gently scratched in a lengthwise manner with a syringe needle, creating thin lines (approximately 50 μm wide) on the surface where the nanoparticles were removed (see ). In this way, both smooth and nanostructured areas could be housed on the same sample and could thus easily be compared in a single image. The syringe needle was mounted in a spring loaded fashion to ensure that a constant force was applied to the needle along the whole scratch. The surfaces were then washed in basic piranha for 15 minutes before use.
Figure 2 Scanning electron microscopy images showing a smooth area on a nanostructured gold surface, created by scratching away the particles with a syringe needle. The dark line represents the smooth area. The difference in surface roughness is clearly seen in the magnified inset. done with the software of the instrument, using a Tougaard background and tabulated sensitivity factors.
Surface characterization
The surfaces were viewed through a Zeiss 982 Gemini® (Zeiss, Oberkochen, Germany) scanning electron microscope (SEM) operating at 10 kV in secondary electron mode, using the in-lens detector. The average particle size and surface coverage was then determined using the image analysis software ImageJ (National Institutes of Health, Bethesda, MD) under the assumption that all particles were spherical.
To estimate the effect of the introduced nanostructure on the surface area available for protein binding, the surface capacitance was measured before and after modification with nanoparticles. The capacitance was measured using a dedicated instrumentCitation23 (Layerlab AB, Gothenburg, Sweden) using gold electrodes provided by the instrument manufacturer. For a bare gold electrode in salt solution, the capacitance depends on the thickness of the electrical double layer outside the electrode. For the physiological buffer used in this study, the double layer is <1 nm. Since the capacitance depends linearly on the electrode area, the small extension of the double layer will give capacitance values reflecting the real surface area of the nanostructured surfaces.Citation24
Static contact angles were measured according to the sessile drop technique by adding a 10 μL ultra-pure (18.2 MΩ cm) water droplet to the surface, measuring the diameter and reading the contact angle in the table provided by Dahlgren and Sundquist.Citation25
The surface chemical composition of smooth gold substrates and surfaces with immobilized nanoparticles was analyzed with X-ray photoemission spectroscopy (XPS) and time-of-flight secondary ion mass spectrometry (ToF-SIMS).
XPS survey spectra and high resolution spectra of selected peaks were measured on areas of ~1 mm2, using a PHI 5500 instrument (Physical Electronics, Eden Prairie, MN). Monochromatized Al-Kα radiation (1486.6 eV) was used at a source power of 350 W. Survey and high resolution spectra were acquired with a pass energy of 93.9 eV and 23.5 eV, respectively. The take-off angle was 45° in all cases. Quantification of relative concentrations (atom %) were
ToF-SIMS measurements were done with a ToF-SIMS IV instrument (ION-TOF GmbH, Münster, Germany), equipped with a bi-cluster primary ion source. Spectra of positive and negative secondary ions were measured from areas of 500 μm × 500 μm, using 25 keV Bi3+ primary ions at an average beam current of around 0.1 pA and instrument settings for high mass resolution (m/Δm(FWHM) around 6000 at m/z 28). Acquisition times were kept below 200 seconds, ensuring that the spectra represented surfaces that were essentially undamaged by the primary ion beam.
Blood products
Fresh whole blood from eight healthy donors was a kind gift from Sahlgrenska University Hospital, Gothenburg, Sweden. The blood was left to clot at room temperature for 2 hours and then centrifuged at 500 × g. The supernatant serum was collected, pooled, and stored at −70°C prior to the measurements.
The QCM-D technique
The quartz crystal microbalance technique is an acoustic method based on the piezo-electric properties of the quartz crystal.Citation26 The technique is described in detail by Rodahl et al.Citation27 Briefly, the resonance frequency of a sensor quartz crystal is monitored over time. Mass adsorbed onto the sensor results in a decrease in the resonance frequency (Δf ). The decrease is proportional to the adsorbed mass, which can be calculated by the Sauerbrey equation below:
where M is the mass in ng/cm2, C is the mass sensitivity constant (17.7 ng cm−2 Hz−1, for a 5 MHz sensor crystal), and n the overtone number 1, 3, … n. The Sauerbrey equation is typically valid for the modeling of adsorbed homogenous layers and when Δf values, normalized against their respective overtone, do not show large spreading. In this present experiment, the variation of the Δf values for the different overtones was in the order of 10% or less. The use of QCM-D to study protein adsorption on nanostructured surfaces have previously been carried out by Lord et alCitation28 and Malmstrom et al.Citation29
Fluorescent evaluation of IC activation
The nanostructured surfaces carrying a scratch (see “Immobilization of gold nanoparticles”) where the particles were removed were incubated with pooled human serum diluted 1:5 in veronal buffered saline containing 0.15 mM CaCl2 and 0.5 mM MgCl2 (VBS2+) for 20 minutes at room temperature. The surfaces were then rinsed with VBS2+ for 5 minutes, incubated with 380 μg/mL fluorescein isothiocyanate (FITC)-labeled rabbit antihuman C3c antibodies (Sigma) for 20 minutes, and finally rinsed with VBS2+ buffer for 5 minutes. Negative controls were performed in the same manner, but with the use of heat-inactivated serum (56°C for 30 minutes). The fluorescence of bound antibodies was then evaluated using a Leica DM-RXA fluorescence microscope (Leica Microsystems, Wetzlar, Germany) at 400× magnification with a FITC filter mounted, with the camera working in manual mode using the same exposure time and aperture for all images.
QCM-D measurements of IC activation
The IC activation was measured on standard QCM-D gold sensor crystals (QSX-301, Q-Sense) with or without immobilized gold nanoparticles. Pooled human serum was diluted 1:5 in veronal buffer saline containing VBS2+. The adsorption of serum proteins was then monitored for 20 minutes in the QCM-D at the third overtone (15 MHz). A 5-minute rinse with buffer solution was then performed to wash away any unbound proteins. To detect complement C3 proteins on the surface, rabbit antihuman C3c antibodies was subsequently introduced and incubated for 20 minutes at a concentration of 200 μg/mL. A final rinse with buffer was then performed for 5 minutes to wash away any unbound antibodies. Positive controls and pre- adsorption studies with IgG were done by pre-adsorption on the surfaces of human IgG for 20 minutes at a concentration of 100 μg/mL. Negative controls were performed in the same manner, but with the use of heat-inactivated serum (56°C for 30 minutes). To evaluate any contribution of the cysteamine SAM, an additional control experiment with cysteamine-coated smooth gold surfaces was performed. All measurements were performed in a minimum of four replicates on a QCM-D model D300 (Q-Sense) operating in ambient room temperature (22.0°C ± 0.2°C).
Data analysis
All experiments were performed in a minimum of five replicates, and data were analyzed using one way analysis of variance and Cochran’s test. Error bars in figures represent standard deviation from the mean.
Results
SEM evaluation of surface-bound gold nanoparticles
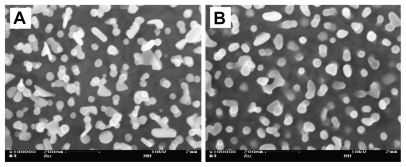
SEM analysis was performed before and after the washing procedure with basic piranha. In the SEM depiction in , the gold nanoparticles are clearly visible against the smooth gold background. After washing, the particles were further immobilized and partly integrated with the background surface, as seen in . The average particle diameter was 58 nm, and the surface coverage of particles was on average 36%.
Figure 3 Scanning electron microscopy images of gold nanoparticles bound to the smooth gold background. (A) Particles bound to the surface by electrostatic interaction with a self-assembled monolayer of cysteamine. (B) After washing in basic piranha the particles are integrated with the background surface. Magnification: 100,000×.
Surface analysis
The surface capacitance of the experimental surfaces was measured in order to estimate the surface area magnification caused by the nanostructure. Capacitance was measured directly after washing of the surfaces in basic piranha solution to minimize the influence of adsorbed species. The capacitance, normalized to the nominal electrode area, was determined to 30.4 μF/cm2 for the smooth surfaces, and to 58.8 μF/cm2 for the nanostructured surfaces. This indicates that the surface area increases approximately 93% by the introduction of the nanotopography.
Water contact angle, XPS, and TOF-SIMS analyses were performed to ensure that surface topography, not chemistry, was the only parameter that differed between the surfaces. The physical properties of the surfaces are summarized in . After washing of the surfaces in basic piranha all surfaces were highly hydrophilic, demonstrated by water contact angles less than 10°. After hydrophobization, the water contact angles on both smooth and nanostructured surfaces were increased to around 80° ().
Table 1 Physicochemical properties of smooth and nanostructured surfaces used in the experiments
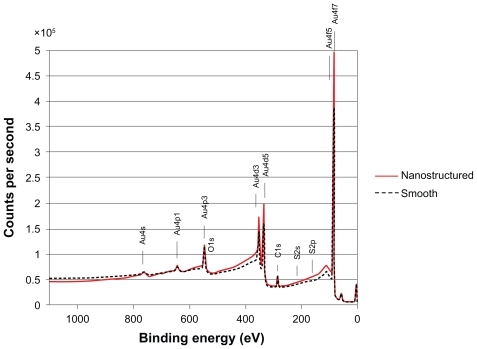
XPS spectra () of the smooth surfaces and the nanostructured gold surfaces were essentially identical and dominated by strong signals from Au and also showed weak signals from C and traces of O and S. The chemical similarity between the surfaces was confirmed after calculation of the atomic concentrations of the elements detected in the XPS analysis (). ToF-SIMS analysis confirmed the chemical similarity between the surfaces, but also revealed some differences, mainly with regard to sulfate-related signals (ToF-SIMS spectra are available in the Supplementary data).
Figure 4 Overlay of X-ray photoemission spectroscopy survey spectra from nanostructured (solid line) and smooth (dotted line) surfaces, showing essentially similar chemical fingerprints.
Fluorescent detection of the IC activation
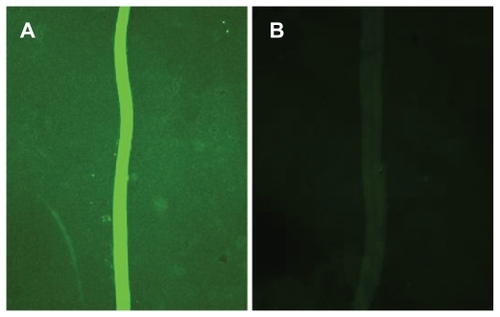
In the initial experiments, the activation of the IC on a smooth and a nanostructured surface were compared by the use of fluorescence microscopy. It was found that FITC-labeled anti-C3c antibodies bound to a significantly lower degree to serum proteins adsorbed on the immobilized gold nanoparticles, as seen in . In the area where the nanoparticles were removed by scratching with a syringe needle (see ), antibodies bound to a higher extent, resulting in a very high intensity fluorescence, seen as a bright line in . The negative control (heat-inactivated serum) is seen in . All images were captured with the camera working in manual mode, using the same aperture and exposure time.
Figure 5 Fluorescence microscopy images of FITC-labeled antibodies binding to C3c in serum adsorbed to the nanostructured surfaces visualized in . (A) The increased fluorescence from the smooth area of the surface is seen as a bright line. (B) Negative control using heat inactivated serum.
Abbreviation: FITC, fluorescein isothiocyanate.
QCM-D measurements of IC activation
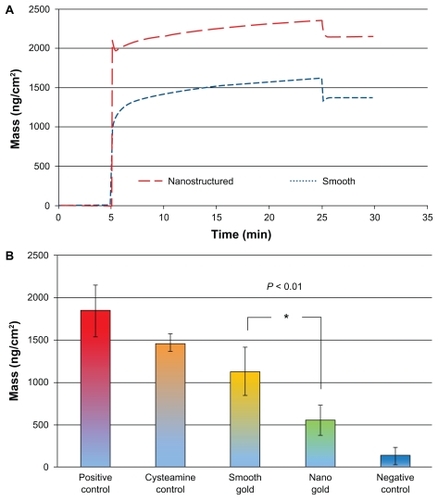
The IC activation was quantified with QCM-D as the amount of anti C3c antibodies binding to a pre-adsorbed layer of human serum on the surfaces. Smooth hydrophilic surfaces adsorbed significantly less serum than the nanostructured hydrophilic surfaces, as seen in . The average mass of serum proteins adsorbed on the smooth surfaces was 1300 ng/cm2, and on the nanostructured surfaces, 2200 ng/cm2. As seen in , the IC was activated to a significantly higher degree in serum adsorbed to smooth hydrophilic surfaces than to nanostructured hydrophilic surfaces. On average, 1100 ng/cm2 of anti-C3c antibodies bound to the serum layer on the smooth gold surfaces, whereas 600 ng/cm2 bound to serum proteins adsorbed on the nanostructured surfaces.
Figure 6 (A) QCM-D measurements of the mass adsorption of serum proteins on smooth and nanostructured surfaces. (B) Activation of the immune complement measured in QCM-D as the amount of binding anti-C3c antibodies to serum adsorbed on smooth or nanostructured gold surfaces. Positive controls with immunoglobulin G and cysteamine, and the negative control (heat-inactivated serum) are also shown.
Notes: Error bars represent standard deviations; N ≥ 5.
Abbreviation: QCM-D, quartz crystal microbalance with dissipation monitoring.
Activation of the IC system by pre-adsorbed IgG
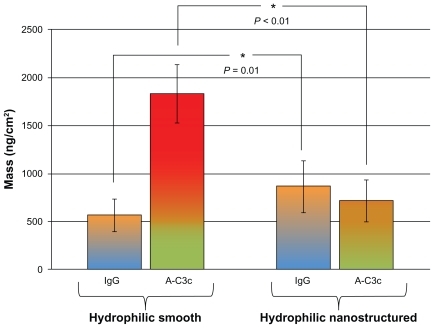
In the attempt to provoke the activation of the IC by preadsorption of human IgG to the surfaces, it was found that IgG adsorbed to a significantly higher extent to hydrophilic nanostructured surfaces (900 ng/cm2) than to hydrophilic smooth surfaces (600 ng/cm2, P = 0.01). Representative QCM-D graphs of the adsorption of IgG are available in the Supplementary data.
Shown in is the amount of IgG adsorbed to smooth (left group), and nanostructured (right group) hydrophilic surfaces, and the corresponding activation of the IC (binding of anti-C3c antibodies) that this amount of IgG induced. After incubation with serum, antibodies towards C3c bound to a significantly lower degree to the nanostructured surfaces (700 ng/cm2) when compared with the smooth ones (1800 ng/cm2).
Figure 7 Adsorption of human IgG and the corresponding activation of the immune complement in human serum measured with QCM-D on hydrophilic surfaces. Smooth surfaces are shown to the left, and nanostructured surfaces to the right.
Notes: Error bars represent standard deviation; N ≥ 5.
Abbreviations: IgG, immunoglobulin G; QCM-D, quartz crystal microbalance with dissipation monitoring.
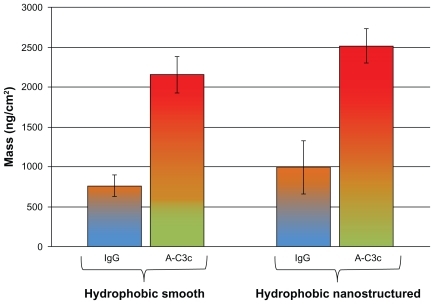
In , the amount of IgG adsorbed to hydrophobic smooth (left group), and nanostructured (right group) surfaces, and the corresponding activation of the IC is shown. When hydrophobized, no difference in IgG adsorption was seen between the surfaces (900 ng/cm2). A small, but not significant (P = 0.06), difference in anti-C3 antibody binding was found between the smooth (2200 ng/cm2) and nanostructured (2500 ng/cm2) hydrophobic surfaces. However, note the large increase in IgG-induced IC activation on the nanostructured surfaces when hydrophobized (compare right groups in and ).
Figure 8 Adsorption of human IgG and the corresponding activation of the immune complement in human serum measured with QCM-D on hydrophobic surfaces. Smooth surfaces are shown to the left, and nanostructured surfaces to the right.
Note: Error bars represent standard deviation; N ≥ 5.
Abbreviations: IgG, immunoglobulin G; QCM-D, quartz crystal microbalance with dissipation monitoring.
Discussion
A striking result in these experiments was the significantly reduced IC activation found on the nanostructured surfaces, apparent both in the fluorescence and QCM-D measurements (see respectively). Remarkably, although the amount of adsorbed serum increased 70% with the presence of the nanostructure, this increase did not result in a corresponding rise in IC activation. Instead, the activation on the nanostructured surfaces was reduced by almost 50% (, respectively). From these experiments, it is therefore obvious that the mere introduction of nanoparticles on the surface induced changes to the adsorbing protein film. Pre-adsorption of IgG (a powerful activator of the IC) to the surfaces further enhanced this difference (see ). The observed differences in IC activation are therefore correlated to changes in IgG adsorption between smooth and nanostructured surfaces. The underlying reasons may be: (1) exclusion or higher exchange of IgG in serum proteins adsorbed to the nanostructured surfaces (Vroman effect); (2) increased structural stability of IgG molecules adsorbed to nanostructured surfaces; and (3) sterical restrictions imposed by the nanostructure on the binding of IgG, affecting the interaction with complement proteins. Below, these different alternatives are discussed in the light of the results.
The classical pathway of the IC system is initiated when the head group of C1q binds to a sufficient number of IgG molecules present on the surface. Upon binding, a change in the conformation of C1q triggers the subsequent cascade events of the IC.Citation30,Citation31 The introduction of nanostructures increased the amount of IgG by approximately 50% in these present experiments (); hence the topography itself did not seem to exclude adsorption of IgG molecules. Normalization with the real surface area, however, revealed that the surface density of IgG may be lower on the nanostructured surface. In a recent study by Lundqvist et al,Citation14 the composition of the plasma protein corona on polystyrene nanoparticles was investigated; particles with a size of 50 and 100 nm and with three different surface chemistries (hydroxyl, amine, or unmodified) were used, and individual proteins in the corona was identified using mass spectrometry. After 1 hour of incubation in plasma, IgG was found on all particles, although to a lesser extent on the smaller (50 nm) hydrophilic particles. Comparing with Lundqvist et al’s study,Citation14 where IgG remained on the particles after 1 hour, the authors of this present paper find it likely that the pre-adsorbed IgG in this present study still remains after 20 minutes of subsequent serum adsorption. Therefore, the authors do not correlate the low activation of the IC on the nanostructured surfaces to removal or absence of IgG during serum adsorption. Earlier ellipsometric investigations of IgG and serum show that IgG is rapidly (within minutes) adsorbed on both hydrophilic and hydrophobic silicon surfaces.Citation21 This is in accordance with the findings of this present study, where a near saturation of IgG is seen on all surfaces after 20 minutes of adsorption, regardless of surface energy (see QCM-D measurements in the Supplementary data). Any prolonged pre-adsorption of IgG to the surfaces would therefore most likely not change the outcome of these experiments.
It is generally considered that proteins undergo a certain amount of deformation or conformational change upon adsorption. These changes have previously been shown to increase with an increase in hydrophobicity of the surface for a number of proteins including IgGCitation32,Citation33 (see also the Supplementary data for detailed information on QCM-D measurements of IgG adsorption). An increase in IC activation by precoated IgG on hydrophobic surfaces has earlier been reported by Wettero et alCitation34 and has been proposed to originate from surface-induced conformational changes of the IgG molecule.Citation35 However, in the attempt to augment the activation of the IC by pre-adsorption of IgG, high activation was found on smooth surfaces regardless of their hydrophobicity (compare left groups in and ). Intriguingly, when nanotopography was introduced on the surface, the activation was markedly restrained, as seen in . This phenomenon was strongly affected by a change in hydrophobicity, resulting in a high activation when the nanostructured surface was hydrophobized (compare right groups in and ). Since no differences in surface density of IgG were found between hydrophilic and hydrophobic nanostructured surfaces, the authors ascribe the low IC activation on the nanostructured surface to a combination of preserved nativity of the adsorbed IgG molecule and nanotopography. Based on this, the authors propose a mechanism below in which the nanotopography of hydrophilic surfaces is suggested to play a role for the orientation of adsorbed IgG molecules, thereby attenuating the activation of the IC.
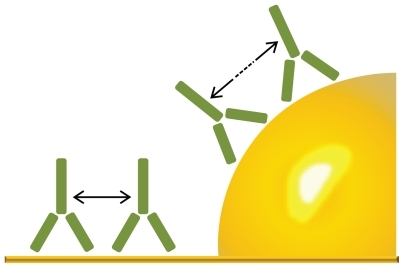
The monomeric IgG molecule has a size of 14.5 nm (height) × 8.5 nm (width) × 4 nm (thickness).Citation36 The approximate “footprint” of the molecule will hence occupy an area of roughly 35 nm2. At random sequential adsorption (~54% surface coverage), approximately 170 IgG molecules would adsorb on the surface of a 60 nm spherical nanoparticle, a number most sufficient to activate the IC. However, when compared with a flat surface, the curvature of a particle will affect the distance between the adsorbed molecules, as illustrated in . This effect naturally decreases with increasing particle size, and eventually the surface of the sphere will appear flat to the adsorbing protein. If the particle instead reaches a certain minimum size, it will be too small to affect the orientation of the protein, and the surface will again appear flat. Interestingly, in the aforementioned study by Lundqvist et al,Citation14 although IgG fragments were found in the corona on all particles regardless of size or surface modification, the complement protein C1q was not found on the smaller (50 nm) hydrophilic particles. This phenomenon was not observed on the unmodified (hydrophobic) particles, where C1q was found on particles of both size. In these present experiments, classical IC activation was markedly reduced on the nanostructured hydrophilic surface compared with the smooth ones, but not when the surfaces were made hydrophobic ( and , respectively).
Figure 9 Illustration of how the curvature of a 60 nm particle affects the distance between adsorbed proteins. In this example, the distance between the C1q binding hinge region of immunoglobulin G molecules are clearly increased by the curvature. (Image drawn according to scale.)
The structure of the IgG binding domain of C1q consists of six globular heads that are equally distributed in a circle of approximately 20 nm in diameter.Citation37 Thus, in order to activate C1q, the required number of IgG molecules must be present within this diameter. Crystallography of the IgG binding part of the C1q head also suggests the important role of the relative orientation of the Fc and Fab regions of the IgG molecule for successful binding between C1q and IgG.Citation38 The authors of this present paper suggest that the particles used in this present study and Lundqvist et al’s study are in a required size range that will prevent a sufficiently large number of IgG molecules from adsorbing close enough, or in the required alignment on the surface to bind to the head groups of C1q. Also, when the particles/nanostructured surfaces are hydrophobized, a higher degree of denaturation of IgG is expected, and this effect therefore vanishes. This could explain the lack of C1q on the 50 nm hydrophilic particles (but not on the 100 nm) in Lundqvist et al’s study and the markedly reduced classical activation of the IC on the nanostructured surfaces in this present study.
To ensure that chemicals used in the fabrication of the nanostructured surfaces were effectively removed by the washing process, extensive surface chemistry analyses were carried out. The low (<10°) water contact angles found on both smooth and nanostructured surfaces ensured a clean surface and were strongly supported by the results from the surface sensitive (1–10 nm analytical depth) XPS analyses (). If present, residues from cysteamine used in the immobilization of the gold nanoparticles would be detected as differences in sulfur or nitrogen signals in the XPS spectra. After washing in basic piranha, only ~1.5 atom % of sulfur was detected on the surfaces, and nitrogen signals were below the detection limit of the instrument. The even more sensitive ToF-SIMS analyses (see the Supplementary data) confirmed the overall similarities between the surfaces, but also confirmed the small difference in sulfur content seen in the XPS analyses (). However, these are minute differences in already very low amounts, and the authors of this paper therefore regard the surfaces as having the same surface chemistry.
Through the simple protocol provided here, nanostructured model surfaces with a defined surface chemistry can easily be produced in any conventional laboratory to a feasible cost. Due to the gold chemistry of the surfaces, thiolated molecules can be covalently bound to the surface to achieve a variety of functional surface chemistries. The authors believe that the use of these surfaces as model biomaterial surfaces can be a helpful tool in the understanding of how nanostructured biomaterials interact with proteins, cells, and tissue.
Conclusion
In this study, a simple and robust process was developed where nanostructured surfaces with defined surface chemistry can easily be fabricated. From these present experiments it can be concluded that the presence of surface-bound hydrophilic gold nanoparticles suppresses the activation of the IC system. The ability of human IgG to activate the IC system was also significantly reduced by the nanostructures of the surface. This effect was blunted by an increase in hydrophobicity.
Figure S1 Positive secondary ion mass spectra from (A) cysteamine, nonwashed gold surface, (B) flat gold surface, (C) nanostructured gold surface, and (D) scratched area on nanostructured surface.
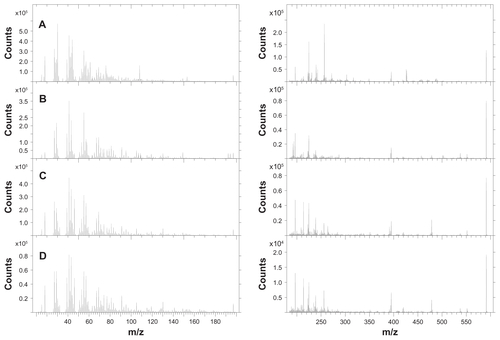
Figure S2 Negative secondary ion mass spectra from (A) cysteamine, nonwashed gold surface, (B) flat gold surface, (C) nanostructured gold surface, and (D) scratched area on nanostructured surface.
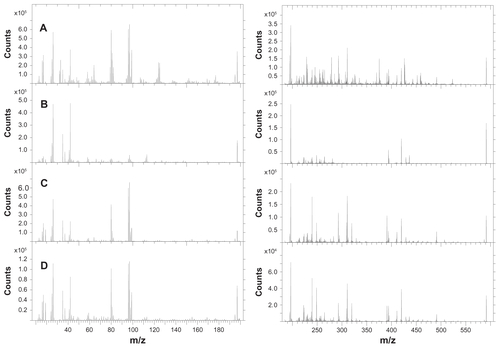
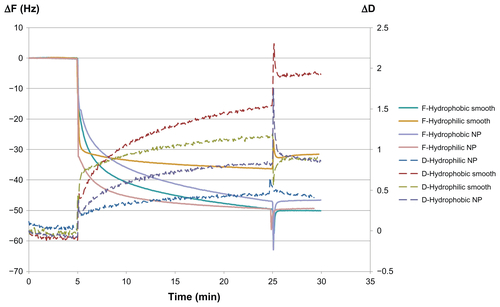
Figure S3 Representative QCM-D graph showing ΔF and ΔD for the adsorption of human IgG (100 μg/mL) for 20 minutes on hydrophilic and hydrophobic smooth and nanostructured gold surfaces. After 5 minutes of baseline with carrier buffer, IgG was introduced. After 20 minutes of adsorption of the protein, a 5-minute rinse with carrier buffer was performed. Note the ΔD when both nanostructured and smooth surfaces are hydrophobized, interpreted here as a higher degree of denaturation of the adsorbed protein.
Abbreviations: ΔF, change in resonance frequency; ΔD, change in dissipation; IgG, immunoglobulin G; NP, nanoparticle; QCM-D, quartz crystal microbalance with dissipation monitoring.
Acknowledgments
The authors acknowledge Bactiguard AB for financial support, Per Borchardt at SP technical research institute for his excellence in TOF-SIMS, Urban Jelvestam for XPS measurements, and Julia Hedlund for her skills in electrochemical measurements. They also thank Kristina Nilsson Ekdahl and Pentti Tengvall for helpful discussions.
Supplementary data
ToF-SIMS analyses
To further investigate the chemical composition of the flat and nanostructured surfaces, time-of-flight secondary ion mass spectrometry (ToF-SIMS) was used. ToF-SIMS is an even more surface-sensitive chemical analysis technique than X-ray photoemission spectroscopy (XPS), with a probing depth of 1–3 nm. Being a high resolution mass spectrometric technique, ToF-SIMS also has the potential to provide more detailed and molecule-specific chemical information than XPS, via secondary ion peaks representing intact molecular ions or unique or characteristic fragment ions of the molecules present on the surface. For comparison, the scratched area of the nanostructured surfaces, and a cysteamine-coated surface which had not been subjected to the piranha washing step, was also analyzed.
The results of the analyses are shown in and , which show representative positive and negative ion spectra, respectively, from the four investigated types of surfaces. For clarity, each set of spectra is presented as two mass ranges, the left panels showing a mass-to-charge ratio (m/z) = 9–200 and the right panels showing m/z = 180–600.
Positive spectra in the lower mass range show a similar overall appearance and are dominated by strong organic signals of the type CxHy+ at odd mass numbers, with the exception for the cysteamine surface, which also has strong organic signals at even mass numbers, representing CxHyN species. The peak at m/z = 76, which is only observed for the cysteamine sample, can be assigned to a deprotonated cysteamine molecular ion (M-H)+. The peaks from CxHyN species also appear at the nanostructured surface and the scratched surface, although at lower intensities. A clear peak from NH4+ is observed at all surfaces, but with a lower intensity for the flat surface. The peak from gold is weak, but this is due to the fact that Au+ has a low secondary ion yield. In the higher mass range, the spectra are dominated by species of the type AuCxHy+, and the gold trimer at m/z = 591, which is characteristic for a gold surface. The cysteamine surface differs from those of the other surface, by the presence of a strong peak at m/z = 257, which can be assigned to an Au-cysteamine complex that has lost an amino group due to fragmentation by the primary ion beam. This peak is absent in the spectrum from the flat surface, and very weak for the nanostructured surface.
The negative spectra in the lower mass range for all surfaces show strong signals from Au and the gold trimer at m/z = 591. In addition, all spectra show strong peaks at m/z = 26 and 42, which can be assigned to CN and CNO, respectively. For the cysteamine surface, the nanostructured surface, and the scratched area in the nanostructured surface, strong signals from sulfate species such as SO2, SO3, SO4, and HSO4 are observed, as well as an unidentified peak at m/z = 311. These peaks are all very weak for the flat surface. The nanostructured surface and the scratched surface show some additional unidentified peaks at higher masses that are weak or not present for the flat surface.
Overall, the ToF-SIMS spectra thus show many similarities between the flat surface and the nanostructured surface. On the other hand, several spectral differences can be observed, most of which appear to be associated with sulfate species (in negative spectra) and nitrogen- containing organic species (in positive spectra), both of which presumably originate from the cysteamine pretreatment.
Quartz crystal microbalance with dissipation monitoring (QCM-D) measurements of immunoglobulin G (IgG) adsorption
In QCM-D, both mass and viscoelastic properties (dissipation) of an adsorbing protein can be measured in real time. A negative change in frequency is proportional to increased mass load on the surface. Dissipation is a dimensionless entity that describes the viscoelastic modulus of the adsorbed mass. Typically, a soft matter will give rise to a higher dissipation than a rigid one. A positive shift in dissipation indicates a higher loss of energy from the oscillating QCM-D crystal and is generally interpreted as loss of organized structure of the adsorbing layer. In , representative data from the adsorption of human IgG onto hydrophilic and hydrophobic smooth and nanostructured gold surfaces are presented. A higher shift in dissipation was observed on the hydrophobic surfaces, regardless of surface nanotopography, indicating a higher degree of denaturation of the protein.
Disclosure
The authors report no conflicts of interest in this work.
References
- LipskiAMPinoCJHaseltonFRChenIWShastriVPThe effect of silica nanoparticle-modified surfaces on cell morphology, cytoskeletal organization and functionBiomaterials200829283836384618606447
- AnselmeKPlouxLPoncheACell/material interfaces: influence of surface chemistry and surface topography on cell adhesionJ Adhesion Sci Technol2010245831852
- ZhangLJWebsterTJNanotechnology and nanomaterials: promises for improved tissue regenerationNano Today2009416680
- GoldbergMLangerRJiaXQNanostructured materials for applications in drug delivery and tissue engineeringJ Biomater Sci Polym Ed200718324126817471764
- MitragotriSLahannJPhysical approaches to biomaterial designNat Mater200981152319096389
- RoachPFarrarDPerryCCInterpretation of protein adsorption: surface- induced conformational changesJ Am Chem Soc2005127228168817315926845
- TangLHuWMolecular determinants of biocompatibilityExpert Rev Med Devices20052449350016293087
- WilsonCJCleggRELeavesleyDIPearcyMJMediation of biomaterial- cell interactions by adsorbed proteins: a reviewTissue Eng2005111–211815738657
- NilssonBEkdahlKNMollnesTELambrisJDThe role of complement in biomaterial-induced inflammationMol Immunol2007441–3829416905192
- RemesAWilliamsDFImmune response in biocompatibilityBiomaterials199213117317431391394
- AggarwalPHallJBMcLelandCBDobrovolskaiaMAMcNeilSENanoparticle interaction with plasma proteins as it relates to particle biodistribution, biocompatibility and therapeutic efficacyAdv Drug Deliv Rev200961642843719376175
- KarmaliPPSimbergDInteractions of nanoparticles with plasma proteins: implication on clearance and toxicity of drug delivery systemsExpert Opin Drug Deliv20118334335721291354
- LynchIDawsonKAProtein-nanoparticle interactionsNano Today200831–24047
- LundqvistMStiglerJEliaGLynchICedervallTDawsonKANanoparticle size and surface properties determine the protein corona with possible implications for biological impactsProc Natl Acad Sci U S A200810538142651427018809927
- HulanderMHongJAnderssonMBlood interactions with noble metals: coagulation and immune complement activationACS Appl Mater Interfaces2009151053106220355891
- JagerMZilkensCZangerKKrauspeRSignificance of nano- and microtopography for cell-surface interactions in orthopaedic implantsJ Biomed Biotechnol2007 Article ID: 69036
- GorbetMBSeftonMVBiomaterial-associated thrombosis: roles of coagulation factors, complement, platelets and leukocytesBiomaterials200425265681570315147815
- AnderssonJEkdahlKNLambrisJDNilssonBBinding of C3 fragments on top of adsorbed plasma proteins during complement activation on a model biomaterial surfaceBiomaterials200526131477148515522749
- FranzSRammeltSScharnweberDSimonJCImmune response to implants – a review of the implications for the design of immunomodulatory biomaterialsBiomaterials201132286692670921715002
- AnderssonMAnderssonJSellbornABerglinMNilssonBElwingHQuartz crystal microbalance-with dissipation monitoring (QCM-D) for real time measurements of blood coagulation density and immune complement activation on artificial surfacesBiosens Bioelectron2005211798615967354
- ElwingHIvarssonBLundstromIComplement deposition from human sera on silicon surfaces studied insitu by ellipsometry – the influence of surface wettabilityEur J Biochem198615623593653084251
- KimlingJMaierMOkenveBKotaidisVBallotHPlechATurkevich method for gold nanoparticle synthesis revisitedJ Phys Chem B200611032157001570716898714
- HedlundJLundgrenALundgrenBElwingHA new compact electrochemical method for analyzing complex protein films adsorbed on the surface of modified interdigitated gold electrodesSensors Actuators B Chem20091422494501
- BardAJFaulknerLRElectrochemical Methods2nd edNew YorkJohn Wiley & Sons Inc2001
- DahlgrenCSundquistTPhagocytosis and hydrophobicity: a method of calculating contact angles based on the diameter of sessile dropsJ Immunol Methods19814017117916944558
- SauerbreyGVerwendung von Schwingquartzen zur Wägung dünner Schichten und Mikrowägung. The use of an oscillating quartz crystal for micro-weighing and weighing of thin filmsZeitschrift für Physik1959155206222 (German)
- RodahlMHookFKrozerABrzezinskiPKasemoBQuartz-crystal microbalance setup for frequency and Q-factor measurements in gaseous and liquid environmentsRev Sci Instrum199566739243930
- LordMSCousinsBGDohertyPJThe effect of silica nanoparticulate coatings on serum protein adsorption and cellular responseBiomaterials200627284856486216757021
- MalmstromJAgheliHKingshottPSutherlandDSViscoelastic Modeling of highly hydrated laminin layers at homogeneous and nanostructured surfaces: quantification of protein layer properties using QCM-D and SPRLangmuir200723199760976817691829
- KishoreUKojouharovaMSReidKBMRecent progress in the understanding of the structure-function relationships of the globular head regions of C1qImmunobiology20022054–535536412395999
- HwangHYDuvallMRTomlinsonSBoackleRJHighly specific inhibition of C1q globular-head binding to human IgG: a novel approach to control and regulate the classical complement pathway using an engineered single chain antibody variable fragmentMol Immunol20084592570258018313756
- SivaramanBFearsKPLatourRAInvestigation of the effects of surface chemistry and solution concentration on the conformation of adsorbed proteins using an improved circular dichroism methodLangmuir20092553050305619437712
- BuijsJNordeWChanges in the secondary structure of adsorbed IgG and F(ab′)2 studied by FTIR spectroscopyLangmuir199612616051613
- WetteroJAskendalABengtssonTTengvallPOn the binding of complement to solid artificial surfaces in vitroBiomaterials200223498199111791932
- SellbornAAnderssonMHedlundJAnderssonJBerglinMElwingHImmune complement activation on polystyrene and silicon dioxide surfaces. Impact of reversible IgG adsorptionMol Immunol200542556957415607815
- LeeKBParkSJMirkinCASmithJCMrksichMProtein nanoarrays generated by dip-pen nanolithographyScience200229555601702170511834780
- KilchherrEHofmannHSteigemannWEngelJStructural model of the collagen-like region of C1q comprising the kink region and the fibrelike packing of the 6 triple helicesJ Mol Biol198518624034153878889
- GaboriaudCJuanhuixJGruezAThe crystal structure of the globular head of complement protein C1q provides a basis for its versatile recognition propertiesJ Biol Chem200327847469744698212960167