 ?Mathematical formulae have been encoded as MathML and are displayed in this HTML version using MathJax in order to improve their display. Uncheck the box to turn MathJax off. This feature requires Javascript. Click on a formula to zoom.
Abstract
Background
Acute myocardial ischemia results in scar formation with ventricular dilatation and eventually heart failure. Placental growth factor (PlGF) is reported to stimulate angiogenesis and improve cardiac function. In this study, it was hypothesized that intramyocardial injection of PlGF contained in nanoparticles can be released at the site of action for an extended time period as a sustained slow-release protective mechanism that accelerates myocardial recovery in a rat model of ischemic cardiomyopathy.
Methods
PlGF-loaded chitosan-alginate nanoparticles were injected into an acute myocardial infarction model in rats (n = 10 per group). Transthoracic echocardiography was performed at different time intervals. Enzyme-linked immunosorbent assay was used to measure the serum cytokines levels at 8 weeks. Hearts were stained with Masson’s trichrome for scar area analysis. Immunofluorostaining was performed to evaluate the extent of myocardial angiogenesis at the infarction border. PlGF enzyme-linked immunosorbent assay was used to measure the in vitro release kinetics of PlGF-loaded nanoparticles.
Results
At 8 weeks after coronary ligation, hearts that were treated with PlGF-loaded chitosan-alginate nanoparticles had significant increases in left-ventricular function (P < 0.01), vascular density (P < 0.01), and in the serum level of the anti-inflammatory cytokine interleukin-10 (P < 0.05). There was significant decrease in scar area formation (P < 0.05) and in serum levels of the proinflammatory cytokines tumor necrosis factor-alpha and interleukin-6 (P < 0.01). In vitro PlGF-release kinetic studies showed a sustained release of PlGF from the particles over a 120-hour period.
Conclusion
The use of nanoparticles as a vehicle for PlGF delivery, as opposed to the direct injection of the growth factor after acute myocardial infarction, can provide sustained slow-release PlGF therapy, enhancing the positive effects of the growth factor in the setting of acute myocardial ischemia.
Introduction
Myocardial infarction (MI) results in scar formation with ventricular dilatation and eventually heart failure. Treatment modalities include medications, heart transplantation, and implantable left-ventricular assist devices (LVADs). The latter modalities are not popular due to the limited supply of organ donors and the high complication rates with LVADs.Citation1,Citation2 The ideal therapy should be able to facilitate the production of new cardiomyocytes and stimulate revascularization of the ischemic region by promoting angiogenesis to preserve cardiac function.Citation3
Inducing angiogenesis is a novel approach to the treatment of myocardial ischemia. Proangiogenic growth factors are used to promote the growth and development of new blood vessels and, in turn, promote regeneration of the myocardium at risk. One of these factors is placental growth factor (PlGF).Citation4 PlGF is a 50 kDa homodimeric glycoprotein sharing 53% sequence homology at the amino acid level with vascular endothelial growth factor (VEGF). PlGF is able to bind with high affinity to the fms-like tyrosine kinase (Flt-1) receptor but not to the kinase domain region receptor, thought to be critically involved in mediating VEGF biological action. It is able to significantly potentiate the effects of low concentrations of VEGF, both in vitro and in vivo.Citation5 PlGF is reported to stimulate angiogenesis with the same efficacy as VEGF but without any of the side-effects that normally accompany VEGF therapy, such as edema, hypotension, and the formation of hemangiomas.Citation6
Despite advances in the treatment of MI, a major obstacle to drug therapy is the limited access drugs in an active form have to the ischemic myocardium. Delivering growth factors remains a challenging process as most of these factors do not remain at the site of interest (ie, infarcted tissue). Possible causes for this include the modes of delivery, local enzymatic degradation, differences between animal models, and the “washing-out” mechanism of the contracting myocardium.Citation7 One novel approach to dealing with these problems is to use nanoparticles for drug delivery. Nanodelivery systems deal with materials and systems whose structures and components exhibit novel and significantly improved physical, chemical, and biological properties due to their nanoscale size.Citation8 Multiple types of nanomaterials have been used to deliver drugs to certain sites in the body.Citation9,Citation10 Of these, chitosan-alginate nanoparticles are widely used for their unique properties. Firstly, they are biodegradable and biocompatible with a very low potential for toxicity. Secondly, they are able to induce a prolonged slow release of the material they carry. Lastly, these particles provide protection from local enzymatic degradation.Citation11,Citation12
In this study, it was hypothesized that intramyocardial injection of PlGF contained in chitosan-alginate nanoparticles can provide a sustained slow-release protective mechanism that accelerates myocardial recovery in a rat model of ischemic cardiomyopathy.
Materials and methods
Animals
The experiment was performed on female Lewis rats (200–250 g; Charles River Laboratories, Senneville, Canada) in accordance with the guidelines set forth by the Canadian Council on Animal Care and were approved by the institutional ethics committee. Rats were housed in groups of two to three per cage, at 23°C, fed with Purina rat ration, and were allowed free access to water.
Chemicals and growth factor
Low viscosity alginic acid sodium salt from brown algae (viscosity: ~250 centipoise, 2% in water at 25°C) was bought from Sigma Chemicals (St Louis, MO). Chitosan (low viscosity, Mv = 7.2 × 10⁴ by viscometry, degree of deacetylation at 73.5% by titration) was purchased from Wako BioProducts (Richmond, VA). Calcium chloride was bought from Sigma-Aldrich Canada Ltd (Oakville, Canada). Recombinant human PlGF was purchased from R&D Systems Inc (Minneapolis, MN).
Preparation of chitosan-alginate nanospheres
Chitosan-alginate nanospheres were prepared using a method modified from Rajaonarivony et al.Citation13 Aqueous calcium chloride (2 mL of 0.67 mg/mL) was added dropwise to 10 mL of aqueous sodium alginate (0.6 mg/mL) while sonicating with a microtip probe ultrasonic sonicator (Branson 2510; Cleveland, OH) for 1 minute at 50 W. The resultant calcium alginate pre-gel was transferred to a beaker, stirred for 30 minutes, and then 2 mL of a 0.3 mg/mL solution of chitosan in 3% v/v acetic acid was added and stirred for an additional 30 minutes. The resultant suspension was equilibrated overnight to allow nanospheres to form with uniform particle size. These nanospheres were isolated by ultracentrifugation at 140,000 g for 60 minutes at 4°C. The resultant pellet was redispersed in distilled water by sonicating for 1 minute, and the nanospheres were washed twice in water by ultracentrifugation. The PlGF-loaded nanoparticles were formed in the same way by adding CaCl2 solution to alginate solution containing 1.0 mg/mL PlGF. The nanoparticles were characterized for PlGF encapsulation efficiency (amount of PlGF encapsulated with respect to the initial amount of PlGF used), as described previously.Citation14
In vitro release kinetics of PlGF-loaded chitosan-alginate nanoparticles
For in vitro release kinetics, the PlGF-loaded particles were suspended in 20 mL of phosphate-buffered saline (pH 7.4) and placed in a thermostatic environment at 37°C with horizontal shaking (100 rpm). At appropriate time intervals, 1 mL of the medium was periodically removed and replaced with the same quantity of phosphate- buffered saline. The concentration of PlGF released at different times was assayed by PlGF enzyme-linked immunosorbent assay (ELISA) (R&D Systems Inc) according to the manufacturer’s instructions. All experiments were performed in triplicate. The amount of encapsulated protein was determined as the difference between the initial amount of protein and what remained in the supernatant, measured by ELISA.
Morphology and structure characterization of nanoparticles
Transmission electron microscopy was used to determine the size characterization. Nanoparticles were photographed using a CM-200 FEG Transmission Electron Microscope (Philips, Markham, Canada). The size was confirmed using a particle sizer instrument. The size of the nanoparticles was measured by electrophoretic laser Doppler anemometry using a Zeta Potential Analyzer (Brookhaven Instruments Corp, Holtsville, NY). ZetaPlus Particle Sizer (v 4.11; Brookhaven Instruments Corporation) software was used to determine the size distribution of the nanoparticles and Zeta Potential Analyzer (v 3.57; Brookhaven Instruments Corporation) was the software used for the zeta potential. The particle sizes were measured for three batches of nanoparticles, and each measurement was obtained after taking the average of three runs.
Ligation of the left coronary artery and intramyocardial injection of nanoparticles
The surgery was performed as previously described.Citation7 Briefly, rats were anesthetized using 5% isoflurane, intubated, and mechanically ventilated at 80 breaths/minute. Via a left thoracotomy (through the fourth intercostal space), the left anterior descending coronary artery was permanently ligated 2 mm from its origin with a 7/0 polypropylene suture (Ethicon Inc, Somerville, NJ). The ischemic myocardial segment rapidly became identifiable through its pallor and akinesia corresponding to the distribution of the left anterior descending coronary artery territory distal to the occlusion, which resulted in MI of the free left ventricle (LV) and subsequently heart failure. Fifteen minutes after ligation of the artery, three equal peri-infarct intramyocardial injections were performed using a 27-G needle. Rats were randomized into four groups: control group I (n = 10) received empty chitosan-alginate nanoparticles, treatment group II (n = 10) received intramyocardial injection of 1 μg of PlGF in 300 μL of saline into the border zone, and treatment group III (n = 10) received intramyocardial injection of 1 μg of PlGF contained in chitosan-alginate nanoparticles in 300 μL of saline (). All of these groups had coronary ligation and injection of material into the peri-infarcted area. The final group, group IV, was a sham-operated group (n = 5). Sham and control animals were similarly handled, except that the suture around the coronary artery was not tied. The reason for using empty nanoparticles as a control was to ensure that these particles had no positive impact on cardiac function and the choice of dosage of PlGF was based on a previous study that showed its efficacy in cardiac function improvement in rats.Citation4 Body weight, general behavior, and mortality of the animals were monitored on a regular basis.
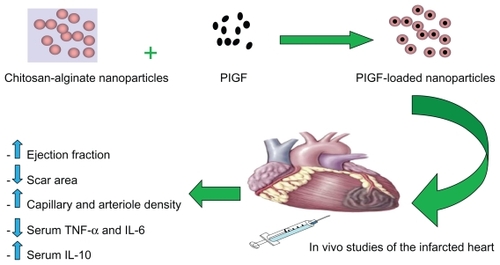
Figure 1 Schematic representation of placental growth factor (PlGF) encapsulation with chitosan-alginate nanoparticles and subsequent intramyocardial delivery to the infarcted rat heart. Its therapeutic effects include increase in cardiac function, decrease in scar area formation, increase in angiogenesis, decrease in proinflammatory serum cytokines levels, and an increase in the anti-inflammatory serum cytokine level of IL-10.
Abbreviations: IL, interleukin; TNF-α, tumor necrosis factor-alpha.
Echocardiography
Echocardiographic examinations were performed under inhaled isoflurane anesthesia (2.5% in oxygen, 500–700 mL/ minute). Transthoracic echocardiography was performed for each rat as a baseline before the surgery, after ligation at 2 days, 1 week, and 4 weeks, and at 8 weeks. Echocardiograms were obtained with a commercially available system (Micromaxx P04224; SonoSite, Bothell, WA), equipped with a linear probe 7–13 MHz 25 mm footprint turbo transducer (P06519.11; SonoSite). Briefly, LV end-diastolic diameters (LVEDD) and end-systolic diameters (LVESD) were measured with M-mode tracings between the anterior and posterior walls from the parasternal short-axis view just below the level of the papillary muscles of the mitral valve. The time of end-diastole was defined as time of maximum diameter of the LV in one heart cycle. Accordingly, end-systole was defined as the minimum diameter. Following the American Society of Echocardiology leading-edge method, two images on average were obtained in each view and averaged over three consecutive cycles.Citation15 Left-ventricular fractional shortening (LVFS) was determined as = [(LVEDD – LVESD)/ LVEDD] × 100. The left-ventricular end-diastolic volume (LVEDV) and left-ventricular end-systolic volume (LVESV) were measured using the Teichholz formula: LVEDV was calculated as 7.0 × LVEDDCitation3/(2.4 + LVEDD), and LVESV as 7.0 × LVESDCitation3/(2.4 + LVESD).Citation16 The left ventricular ejection fraction (LVEF) was determined as
Scar area analysis
Eight weeks postoperation, rats were deeply anesthetized and sacrificed by rapid excision of the heart. Scar area analysis was performed as previously described.Citation17 Briefly, the excised hearts were immediately soaked in cold saline to remove excess blood from the ventricles and then fixed in neutral-buffered 4% formalin. Paraffin-embedded samples were sectioned at 5 μm, and Masson’s trichrome staining (DBS, Pleasanton, CA) was performed to delineate scar tissue (blue color) from the total area of myocardium. Masson’s trichrome-stained sections were captured as digital images and analyzed by ImageJ (v 1.41; National Institutes of Health, Bethesda, MD) software. Infarct areas were calculated and expressed as a percentage.
Angiogenesis assessment
Neovascularization was evaluated by analyzing the capillary and arteriole density in the peri-infarct area. For this, immunofluorostaining was performed with antibodies against platelet endothelial cell adhesion molecule (Santa Cruz Biotechnology Inc, Santa Cruz, CA) for identification of endothelial cells and smooth muscle α-actin (Santa Cruz Biotechnology Inc) for tracing the smooth muscle cells.Citation18,Citation19 Briefly, for measurement of capillary density, five fields in the peri-infarct area were imaged and average numbers of capillaries with diameter <10 μm were counted. The capillary density was quantified as the (mean total CD31-positive microvessels)/mm2 using three tissue sections spanning the peri-infarct tissue region of each animal. Similarly, arteriole densities were quantified as (mean total smooth muscle α-actin-positive microvessels)/mm2.
Serum concentration of soluble cytokines
At 8 weeks and before harvesting the hearts, blood samples were collected from the left atrium of each rat by direct cardiac puncture. Samples were then centrifuged at 14000 rpm for 10 minutes. After that, samples were stored at −20°C until analysis. As described previously,Citation20 serum levels of interleukin (IL)-10, tumor necrosis factor-alpha (TNF-α), and IL-6 were measured using commercially available Rat Inflammatory Cytokines Multi-Analyte ELISArray Kit (SABiosciences, QIAGEN Company, Frederick, MD). The kit format was microtiter plates precoated with a murine monoclonal antibody against the rat cytokine being measured. Standards of the analyte and serum samples were added in duplicate. Fifty microliters of the sample was added to the appropriate wells of the ELISA strips. The samples were incubated for 2 hours. Then 100 μL of detection antibody solution was pipetted and incubated for 1 hour at room temperature. One hundred microliters of avidin-horseradish peroxidase (HRP) solution was added to all wells and incubated for 30 minutes at room temperature. After that, 100 μL of development solution (tetramethylbenzidine) was added to each well and incubated for 15 minutes at room temperature in the dark. Finally, 100 μL of stop solution (1 M sulfuric acid) was added to each well. The color changes from blue to yellow and the absorbance were read at 450 nm within 30 minutes of stopping the reaction and standard curves were plotted. All assays were conducted in a blinded fashion. The intra- and interassay coefficients of variation in the laboratory were below 10%.
Statistical analysis
All statistical analyses were carried out using the GraphPad Prism (v 5.00; GraphPad Software, La Jolla, CA) software. All statistical tests were two-tailed. P values of ≤0.05 were considered indicative of statistical significance. All data are expressed as mean ± standard deviation (SD).
Repeated measurements of LVFS and LVEF
Repeated echocardiographic variables at baseline, 2 days, 1 week, and 4 weeks, and 8 weeks postinfarct were compared by means of two-way repeated-measures analysis of variance (ANOVA). Preliminary checks were conducted to ensure that there was no violation of the assumptions of normality, linearity, homogeneity of variances, and homogeneity of regression slopes. If a significant F ratio was obtained, a Bonferroni post hoc test was used to assess pairwise differences.
Scar area percentage, capillary density, arteriolar density, and cytokines concentration
One-way ANOVA was used to compare mean percentage scar area, capillary density, arteriolar density, and serum cytokine level among the groups. Post hoc comparisons of means were performed with the Bonferroni method for the adjustment of P values and 95% confidence intervals (CIs) for multiple testing, which is recommended for balanced ANOVA.
Results
Sample size and mortality
Forty-three female Lewis rats were included in the study. A mortality rate of 23% (eight rats) was observed, with a total of 35 rats surviving to the experimental endpoint at 2 months. All of the mortalities occurred during the first 48 hours after coronary ligation. There was no significant difference in mortality among the different groups. No late deaths were observed in the surviving rats.
Characterization of nanoparticles
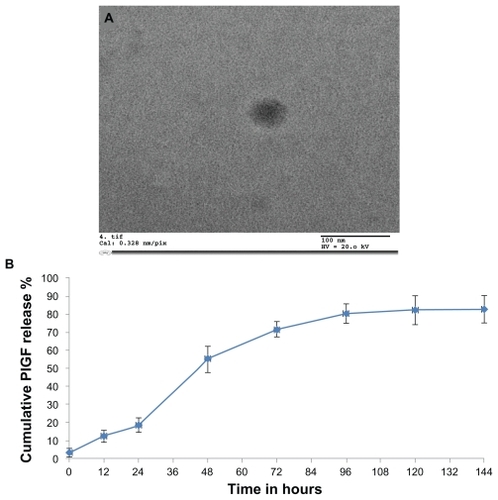
Electron microscopy analysis confirmed the presence of nanoparticles and provided morphological information on the typical PlGF-loaded chitosan-alginate nanoparticles. Using transmission electron microscopy, the particles were about 100–200 nm in diameter (), and spherical in shape. However, the nanoparticles did not appear to have smooth surfaces but rather “fluffy” surfaces. These particles had a positive Zeta potential 7.2 ± 0.5 mV. The encapsulation efficiency was found to be 38.4% ± 3.4%.
Figure 2 Characterization of nanoparticles: (A) Transmission electron microscopy was used to obtain the size characterization. The chitosan-alginate nanoparticles measured 100–200 nm in diameter. Most nanoparticles were spherical in shape. (B) In vitro release kinetics of placental growth factor (PlGF)-loaded chitosan-alginate nanoparticles over time.
Note: There was no further drug release after 120 hours.
In vitro release kinetics
The concentration of PlGF released at different times was assayed and showed a biphasic release model in the in vitro release study. During the first 24 hours, there was limited drug release but at 48 hours there was a rapid release of the growth factor due to the gradual degradation of the nanoparticles over time. There was no drug release after 120 hours. The release of PlGF from chitosan-alginate nanoparticles over time is illustrated in . This release pattern can be controlled depending on the concentration of alginate used in the preparation of the nanoparticles.
Echocardiography measurements
LVFS measurements
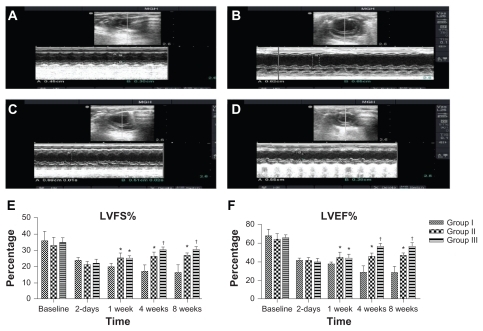
The LV fractional shortening was not significantly different among the groups preoperatively or even 2 days postinfarct (P > 0.05). Two-way ANOVA showed that there was a significant difference between the groups in the mean LVFS at 1 week postinfarct. Post-hoc comparisons showed that mean LVFS at 1 week postinfarct for group II was not statistically significant compared with group III (95% CI [−4.3, 3.9], P > 0.05). However, mean LVFS values at 1 week postinfarct for group II and group III were higher than the mean LVFS for group I and the differences were statistically significant, with differences of 5.3% (95% CI [1.2, 9.4], P < 0.001) and 5.1% (95% CI [1.01, 9.2], P < 0.01), respectively. Moreover, two-way ANOVA showed that there was a significant difference between the groups in the mean LVFS at 4 weeks postinfarct. Post-hoc comparisons showed that mean LVFS at 4 weeks postinfarct for group II was statistically significant compared with group III (95% CI [−0.3, 7.9], P < 0.05). The mean LVFS values at 4 weeks postinfarct for group II and group III were higher than the mean LVFS for group I and the differences were statistically significant, with differences of 9.6% (95% CI [5.3, 13.5], P < 0.001) and 13.2% (95% CI [9.1, 17.3], P < 0.001), respectively. Similarly, two-way ANOVA showed that there was a significant difference between the groups in the mean LVFS at 8 weeks postinfarct. Post-hoc comparisons showed that mean LVFS at 8 weeks postinfarct for group II was statistically significant compared with group III (95% CI [−0.2, 8], P < 0.05). The means at 8 weeks postinfarct for group II and group III were higher than the mean LVFS for group I and the differences were statistically significant, with differences of 10.4% (95% CI [6.3, 14.5], P < 0.001) and 14.3% (95% CI [10.2, 18.4], P < 0.001), respectively. The means and SDs of LVFS at baseline, 2 days, 1 week, 4 weeks, and 8 weeks postinfarct are shown in .
Figure 3 Echocardiographic analysis of heart function. Examples of two-dimensional and M-mode echocardiographic images obtained from: (A) a normal heart before infarction (pre-MI), (B) group I at 2 months after MI and injection with empty nanoparticles, (C) group II at 2 months after MI and injection with PlGF, and (D) group III at 2 months after MI and injection with PlGF contained in nanoparticles. Note the changes in left ventricular end-diastolic/systolic diameters (LVEDD and LVES D) between groups as group III had the least left ventricular cavity dilatation. E–F show graphs of functional parameters obtained from echocardiographic images (data presented as mean ± standard deviation). Parameters shown are (E) fractional shortening as determined from 2D images, and (F) ejection fraction as determined from two-dimensional images.
Notes: *P < 0.05 versus group I; †P < 0.05 versus group II.
Abbreviations: MI, myocardial infarction; PlGF, placental growth factor; LVEDD, left ventricle end-diastolic diameters; LVESD, left ventricle end-systolic diameters.
LVEF measurements
The LV ejection fraction was not significantly different among the groups preoperatively or even at 2 days postinfarct (P > 0.05). Two-way ANOVA showed that there was a significant difference between the groups in the mean LVEF at 1 week postinfarct. Post-hoc comparisons showed that the mean LVEF at 1 week postinfarct for group II was not statistically significant compared with group III (95% CI [−6.9, 5.5], P > 0.05). However, mean LVEF values at 1 week postinfarct for group II and group III were higher than the mean LVEF for group I and the differences were statistically significant, with differences of 7.2% (95% CI [1.01, 13.4], P < 0.01) and 6.4% (95% CI [0.3, 12.7], P < 0.05), respectively. Moreover, two-way ANOVA showed that there was a significant difference between the groups in the mean LVEF at 4 weeks postinfarct. Post-hoc comparisons showed that mean LVEF at 4 weeks postinfarct for group II was statistically significant compared with group III (95% CI (−4.3, 16.7), P < 0.001). The mean LVEF values at 4 weeks postinfarct for group II and group III were higher than the mean LVEF for group I and the differences were statistically significant, with differences of 17% (95% CI (10.8, 23.2), P < 0.001), and 27.5% (95% CI (21.3, 33.7), P < 0.001) respectively. Similarly, two-way ANOVA showed that there was a significant difference between the groups in the mean LVEF at 8 weeks postinfarct. Post-hoc comparisons showed that the mean LVEF at 8 weeks postinfarct for group II was statistically significant compared with group III (95% CI [3.3, 15.7], P < 0.001). The means at 8 weeks postinfarct for group II and group III were higher than the mean LVEF for group I and the differences were statistically significant, with differences of 19.5% (95% CI [13.3, 25.7], P < 0.001) and 29% (95% CI [22.8, 35.2], P < 0.001) respectively. The means and SDs of LVEF at baseline, 2 days, 1 week, 4 weeks, and 8 weeks postinfarct are shown in .
Scar area measurements
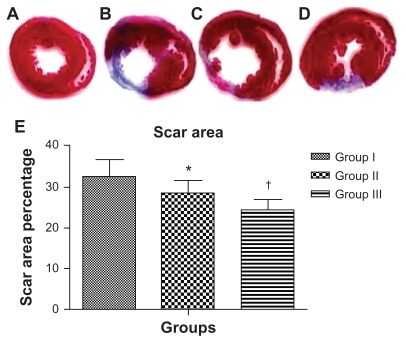
One-way ANOVA showed that there was a significant difference among the groups in the mean scar area percentage at 8 weeks postinfarct. Scar area percentage was significantly different between the groups (32.7% ± 4% in group I versus 28.4% ± 3% in group II, 95% CI [0.61, 8] P < 0.01; 28.4% ± 3% in group II versus 24.5% ± 2.6% in group III, 95% CI [0.2, 7.6] P < 0.01; 32.7% ± 4% in group I versus 24.5% ± 2.6% in group III, 95% CI [4.5, 11.9] P < 0.0001). Mean percent scar and SD per group are presented in .
Figure 4 Injection of acutely infarcted hearts with PlGF contained in nanoparticles attenuated the extent of infarction. Images of thin sections of a heart from the sham group (A); 2 months after MI and injection with empty nanoparticles (B); 2 months after MI and injection with PlGF (C); 2 months after MI and injection with PlGF contained in nanoparticles (D). Red indicates viable myocardium; blue indicates fibrosis due to infarction damage. (E) The percentage of infarcted left ventricular area for group I (empty nanoparticles), group II (PlGF), and group III (nanoparticles + PlGF) presented as the mean ± standard deviation. Note that group III had the least scar area percentage compared with the other groups.
Notes: *P < 0.01 versus group I; †P < 0.01 versus group II.
Abbreviations: PlGF, placental growth factor; MI, myocardial infarction.
Angiogenesis measurements
One-way ANOVA showed that there was a significant difference between the groups in the mean capillary density at 8 weeks postinfarct. Capillary density, quantified as (mean total CD31-positive microvessels)/mm2, was significantly different between the groups (33.3 ± 11.7 total CD31-positive microvessels/mm2 in group I versus 80.8 ± 20.4 total CD31-positive microvessels/mm2 in group II, 95% CI [−66.2, −28.8] P < 0.0001; 80.8 ± 20.4 total CD31- positive microvessels/mm2 in group II versus 128.7 ± 15.9 total CD31-positive microvessels/mm2 in group III, 95% CI [−66.6, −29.2] P < 0.0001; 33.3 ± 11.7 total CD31- positive microvessels/mm2 in group I versus 128.7 ± 15.9 total CD31-positive microvessels/mm2 in group III, 95% CI [−114.1, −76.7] P < 0.0001) (). Mean capillary density and SD per group are presented in .
Figure 5 Angiogenesis and arteriogenesis in the peri-infarct area. Immunohistological staining of CD31 to detect endothelial cells in different groups (upper panel; magnification 400×). Immunohistological staining of smooth muscle α-actin for smooth muscle cells in different groups (lower panel; magnification 200×). (A and D) Group I (empty nanoparticles), (B and E) group II (PlGF), and (C and F) group III (nanoparticles + PlGF). (D) Capillary density and (E) arteriole density graphs for all groups presented as the mean ± standard deviation. Note the higher capillary and arteriole densities in group III as compared to the other groups.
Notes: *P < 0.01 versus group I; †P < 0.01 versus group II.
Abbreviation: PlGF, placental growth factor.
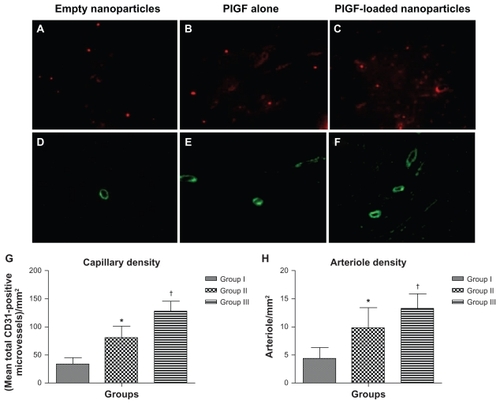
One-way ANOVA showed that there was a significant difference between the groups in the mean arteriole density at 8 weeks postinfarct. Arteriolar density, quantified as (mean total smooth muscle α-actin-positive microvessels)/mm2, was significantly different between the groups (4.3 ± 1.9 total smooth muscle α-actin-positive microvessels/mm2 in group I versus 9.8 ± 3.6 total smooth muscle α-actin-positive microvessels/mm2 in group II, 95% CI [−8.6, −2.3] P < 0.0001; 9.8 ± 3.6 total smooth muscle α-actin-positive microvessels/mm2 in group II versus 13.3 ± 2.5 total smooth muscle α-actin-positive microvessels/mm2 in group III, 95% CI [−6.76, −0.3] P < 0.01; 4.3 ± 1.9 total smooth muscle α-actin-positive microvessels/ mm2 in group I versus 13.3 ± 2.5 total smooth muscle α-actin-positive microvessels/ mm2 in group III, 95% CI [−12.12, −5.8] P < 0.0001) (). Mean arteriole density and SD per group are presented in .
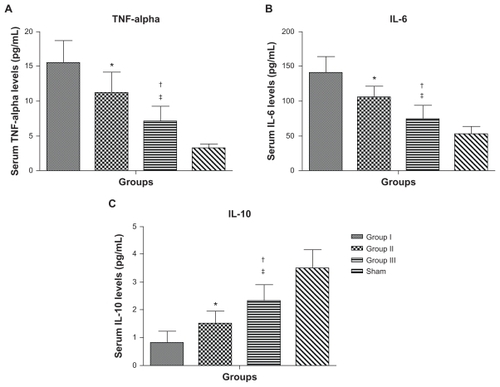
Serum cytokines measurements
One-way ANOVA showed that there was a significant difference between the groups in the mean cytokine levels at 8 weeks postinfarct. Serum TNF-α levels were significantly different between the groups (, 16.6 ± 4.1 pg/mL in group I versus 11.1 ± 3 pg/mL in group II, 95% CI [1.2, 7.8] P < 0.01; 11.1 ± 3 pg/mL in group II versus 7.1 ± 2.2 pg/mL in group III, 95% CI [0.7, 7.3] P < 0.022; 16.6 ± 4.1 pg/mL in group I versus 7.1 ± 2.2 pg/mL in group III, 95% CI [5.2, 11.8] P < 0.0001). Serum IL-6 levels were significantly different between the groups (, 145.5 ± 28.5 pg/mL in group I versus 105.7 ± 16.8 pg/mL in group II, 95% CI [10.3, 59.3] P < 0.01; 105.7 ± 16.8 pg/mL in group II versus 75.4 ± 19.2 pg/mL in group III, 95% CI [5.8, 54.8] P < 0.01; 145.5 ± 28.5 pg/mL in group I versus 75.4 ± 19.2 pg/mL in group III, 95% CI [40.6, 89.6] P < 0.0001). However, the anti-inflammatory cytokine IL-10 was significantly increased in group III compared with the other groups at 8 weeks postinfarct (, 0.9 ± 0.5 pg/mL in group I versus 1.5 ± 0.5 pg/mL in group II, 95% CI [−1.4, −0.04] P < 0.01; 1.5 ± 0.5 pg/mL in group II versus 2.3 ± 0.6 pg/mL in group III, 95% CI [−1.5, −0.1] P < 0.01; 0.9 ± 0.5 pg/mL in group I versus 2.3 ± 0.6 pg/mL in group III, 95% CI [−2.2, −0.8] P < 0.0001).
Figure 6 Serum cytokine levels for group I (empty nanoparticles), group II (PlGF), group III (nanoparticles + PlGF), and the sham group at 8 weeks postinfarction. (A) Serum tumor necrosis factor (TNF)-alpha levels. (B) Serum interleukin (IL)-6 levels. (C) Serum IL-10 levels. Group III had significantly lower levels of TNF-alpha and IL-6 with higher levels of the anti-inflammatory cytokine IL-10 as compared with the other groups (excluding the sham group).
Note: Data presented as mean ± standard deviation (*P < 0.01 versus group I; †P < 0.022 versus group II; ‡P < 0.0001 versus group I).
Abbreviation: PlGF, placental growth factor.
Discussion
Heart failure occurs most commonly as a consequence of ischemic heart disease.Citation21 One novel approach for treating ischemic heart disease is angiogenesis. PlGF has been used for this purpose for almost two decades. PlGF is a 50 kDa homodimeric glycoprotein sharing 53% sequence homology at the amino acid level with VEGF. Three isoforms resulting from alternative splicing are described: PlGF-1 and PlGF-2, which are identical except for the insertion of a heparin-binding domain at the carboxyl end of PlGF-2, and the longest isoform, PlGF-3. In this study, PlGF-2 was the isomer used.Citation22 PlGF is a unique proangiogenic growth factor compared with others because of its action on three cell types – endothelial cells, inflammatory cells, and smooth muscle cells – to promote neovascularization.Citation23 It induces angiogenesis by binding to Flt-1 (VEGF-R1), which leads to the activation of fetal liver kinase 1 (VEGF-R2) and, therefore, potentiates the effects of VEGF and provides a positive feedback.Citation24 Furthermore, PlGF stimulates the mobilization of VEGFR1+ hematopoietic cells from the bone marrow into circulation, which contributes to postischemic revascularization. Citation25 Several studies have been conducted demonstrating the effect of PlGF on cardiomyocytes. It has been shown that the administration of PlGF after an acute MI in mice, via an osmotic minipump (continuous infusion), resulted in a significant increase in left ventricular ejection fraction, significant reduction in the scar area, significant increase in left ventricular wall thickness, significant decrease in left ventricular dilatation, and remodeling suppression.Citation26 During hypoxic conditions, as in MI, cardiomyocytes’ PlGF expression is upregulated significantly by hypoxia in vitro as well as in vivo after myocardial damage. These results provide important evidence that endogenous PlGF may facilitate cardiac healing after myocardial hypoxic ischemic damage.Citation27 Kolakowski and colleagues were able to demonstrate the beneficial effects of PlGF on the infarcted heart after direct myocardial injection.Citation4 In the present study, similar results were obtained when comparing groups I and II in regards to LVEF, scar area, and angiogenesis analysis. Protein delivery was optimized by using the same PlGF dosage as in previous studies but with better results due to the use of nanoparticles as the drug delivery system.Citation4
Nanoparticles are submicron particles containing entrapped drugs. The nanoparticles allow these drugs to be released over a certain period of time in an unaltered state.Citation28 It has been shown that long-lasting responses (6 months) can be obtained using low molecular weight chitosan nanoparticles and also that the response is not influenced by the drug dose, thus achieving a significant response at a very low dose.Citation29 Kundu et al found that in vitro VEGF release from silk fibroin nanoparticles showed a significantly sustained release over 3 weeks, providing evidence of the potential application of nanoparticles as a growth factor delivery system.Citation30 In this study, the release kinetics of PlGF-loaded chitosan-alginate nanoparticles were assessed both in vitro and in vivo. To the authors’ knowledge, this is the first report of direct intramyocardial injection of PlGF contained in nanoparticles as a revascularization strategy for acute MI.
The recovery of heart function was evaluated by measuring both LVFS and LVEF. LVFS for group I reached 16.5% at 8 weeks post-MI. This result is comparable to the authors’ previous study that examined LVFS for a control group that received only culture medium at 7 weeks.Citation7 This comparison proves that the nanoparticles used had no negative effect on the heart. For group II, LVFS decreased initially as a response to the MI but started to increase after 2 days till it plateaued at 1 week. However, the LVFS for group III started to increase 2 days postinfarct and plateaued at 4 weeks. The same effect happened with LVEF. The possible reason for such a large discrepancy between the in vitro release time of PlGF from the nanoparticles and the improved cardiac performance at 4 weeks is the recovery time of the myocardium. After acute MI, the myocardium goes into a hibernating state or what is called “myocardial stunning.” This abnormality can persist for weeks or months and is potentially reversible by revascularization. After revascularization, the recovery of the viable myocardium takes time and is not immediate even after complete revascularization.Citation31,Citation32 In this study, revascularization was accomplished by PlGF injection. The in vitro release of PlGF from the nanoparticles reached a plateau on day 5, while in group II, which received PlGF alone, the growth factor was all released immediately after injection. PlGF in group II was unprotected from the local environment and hence most of it was lost. In group III, PlGF was protected by the nanoparticles with sustained release for 5 days. This resulted in much more angiogenesis in group III compared with group II. The myocardium would take time to recover as most of it is in the hibernating state. As expected, the results of this study indicate that delivering PlGF in nanoparticles increases cardiac function compared to injection of either empty nanoparticles or PlGF alone. Furthermore, it suggests that the chitosan-alginate nanoparticles provide a protective sustained-release mechanism for PlGF for a period of time postinfarct, which is comparable to the authors’ in vitro release kinetic studies of the particles. It can be assumed that these particles protected PlGF from local enzymatic degradation, thus prolonging the action of the growth factor.
To investigate this further and to clarify the mechanism underlying the beneficial effects of PlGF in acute MI, scar area, angiogenesis, and arteriogenesis were analyzed. Angiogenesis is considered a potential mechanism in the treatment of ischemia by improving blood flow and increasing oxygen availability at the MI border zone.Citation33 As expected, scar area percentage for group III decreased significantly and this correlates with the improvement in LVEF. Furthermore, antibodies against platelet endothelial cell adhesion molecule and anti-smooth muscle antibody staining demonstrated significantly higher capillary and arteriolar densities at the border zone of the infarct in group III compared with the other groups, which indicates a higher angiogenesis potential for PlGF contained in nanoparticles, despite using the same dose of PlGF. It has been previously shown that systemic PlGF administration causes remote hypertrophy of the noninfarcted myocardium by modifying the capillary/cardiomyocyte ratio. This hypertrophy contributed significantly to the recovery of the myocardium and had no negative effects.Citation34 This was not assessed in the present study as focus was on the peri-infarcted region.
The significant changes in LVEF, scar area, and arteriolar density were accompanied by a significant change in serum cytokine levels. Previous studies focused on the tissue expression of cytokines post-MI, while a small number of studies actually focused on the changes in serum levels of these cytokines.Citation35,Citation36 For this reason, it was decided to study the serum levels instead of the gene expression. Focus was mainly on serum levels of TNF-α, IL-6, and IL-10. TNF-α and IL-6 have a negative impact on the infarcted myocardium by causing remodeling, while IL-10 counteracts this effect.Citation35 Serum levels of the proinflammatory cytokines TNF-α and IL-6 were significantly lower in group III compared with the other groups. Furthermore, the serum level of the anti-inflammatory cardioprotective cytokine IL-10 was significantly higher in group III. This group had less left-ventricular remodeling than the other groups based on the minimal change in LVEDD and LVESD from baseline as shown in (detailed data is not shown), as well as the decrease in scar formation. It is not unusual to see persistently high levels of pro-inflammatory cytokines 8 weeks after MI, as the remodeling process may continue for weeks or months post-MI.Citation36 Furthermore, it has been shown that plasma TNF-α was significantly elevated in rats by 2 weeks after MI and gradually increased to a peak value at week 8.Citation37 Similarly, the beneficial effect of mesenchymal stem-cell therapy on myocardial remodeling through a decrease in the proinflammatory/anti-inflammatory cytokine ratio has been demonstrated previously by the authors’ group.Citation17
Direct intramyocardial injection of drugs, as opposed to other delivery approaches (ie, intravenous or oral), offers the delivery of a relatively high concentration of drugs and the precise targeting of the peri-infarcted tissue. However, one of its drawbacks is its invasiveness. It would be suitable only for patients who are undergoing open heart surgery or catheter-based interventions. To overcome this problem, a better approach needs to be designed. This can be done by modifying the surface characteristics of the nanoparticles to make them site specific. To combine stem-cell therapy and multiple factors with different molecular mechanisms to promote cell growth that protect the ischemic (infarcted) area from future damage will be an exciting future research endeavor. For example, the use of a specific mixture of growth factors (such as angiopioten, bFGF, and VEGF) contained in a protective sustained-release mechanism (such as microparticles or nanoparticles), which allows site-specific targeted delivery (for example, using receptor-specific antibodies like antimyosin light chain antibody), will further define the future of cell-based therapy for myocardial regeneration. This will allow cell-based therapy to be delivered intravenously rather than intramyocardially to the infarcted area and prevent it from being washed out by the contracting muscle.
Conclusion
The use of nanoparticles as a vehicle for PlGF delivery as opposed to the direct application of the growth factor after acute MI resulted in significant increase in LV function, vascular density, and the anti-inflammatory cytokine IL-10, with significant decrease in scar area formation and in proinflammatory cytokines TNF-α and IL-6. Thus, nanoparticles can be used to provide a sustained slow-release protective PlGF therapy, enhancing the positive effects of the growth factor in the setting of acute myocardial ischemia. Furthermore, this nanotechnology can be used as a drug delivery system for many anti-heart failure medications. This would retain most of the drug at the site of interest as well as minimizing systemic toxicity. Further experiments and studies are needed to optimize the method, which may lead to a new era in therapeutics.
Acknowledgments
The authors would like to acknowledge the support of research grants from the Natural Sciences and Engineering Research Council (NSERC) of Canada. Ziyad Binsalamah acknowledges financial support from King Fahad Medical City, Riyadh, Saudi Arabia. Arghya Paul acknowledges financial support from NSERC Alexander Graham Bell Canada Graduate Scholarship.
Disclosure
The authors confirm that there are no known conflicts of interest associated with this publication, other than the financial supports detailed in the Acknowledgments.
References
- HognessJRVanantwerpMThe Artificial Heart: Prototypes, Policies, and PatientsWashington DCNational Academy Press1991
- GoldsteinDJOzMCRoseEAImplantable left ventricular assist devicesN Engl J Med199833921152215339819452
- FraserJKSchreiberREZukPAHedrickMHAdult stem cell therapy for the heartInt J Bichem Cell Biol2004364658666
- KolakowskiSBerryMFAtluriPPlacental growth factor provides a novel local angiogenic therapy for ischemic cardiomyopathyJ Card Surg200621655956417073953
- ParkJEChenHHWinerJHouckKAFerraraNPlacenta growth factor – Potentiation of vascular endothelial growth-factor bioactivity, in-vitro and in-vivo, and high-affinity binding to Flt-1 but not to Flk-1/ KdrJ Biol Chem19942694125646256547929268
- OuraHBertonciniJVelascoPBrownLFCarmelietPDetmarMA critical role of placental growth factor in the induction of inflammation and edema formationBlood2003101256056712393422
- Al KindiAHAsenjoJFGeYMicroencapsulation to reduce mechanical loss of microspheres: implications in myocardial cell therapyEur J Cardiothorac Surg201139224124720494590
- RiehemannKSchneiderSWLugerTAGodinBFerrariMFuchsHNanomedicine-challenge and perspectivesAngew Chem Int Ed Engl200948587289719142939
- AmidiMRomeijnSGBorchardGJungingerHEHenninkWEJiskootWPreparation and characterization of protein-loaded N-trimethyl chitosan nanoparticles as nasal delivery systemJ Control Release20061111–210711616380189
- ShriverLPKoudelkaKJManchesterMViral nanoparticles associate with regions of inflammation and blood brain barrier disruption during CNS infectionJ Neuroimmunol20092111–2667219394707
- MotwaniSKChopraSTalegaonkarSKohlKAhmadFJKharRKChitosan-sodium alginate nanoparticles as submicroscopic reservoirs for ocular delivery: Formulation, optimisation and in vitro characterisationEur J Pharm Biopharm200868351352517983737
- YangSJChangSMTsaiKCChenWSLinFHShiehMJEffect of chitosan-alginate nanoparticles and ultrasound on the efficiency of gene transfection of human cancer cellsJ Gene Med201012216817919943342
- RajaonarivonyMVauthierCCouarrazeGPuisieuxFCouvreurPDevelopment of a new drug carrier made from alginateJ Pharm Sci19938299129178229689
- PandeyRAhmadZSharmaSKhullerGKNano-encapsulation of azole antifungals: potential applications to improve oral drug deliveryInt J Pharm20053011–226827616023808
- DavaniSMarandinAMersinNMesenchymal progenitor cells differentiate into an endothelial phenotype, enhance vascular density, and improve heart function in a rat cellular cardiomyoplasty modelCirculation2003108Suppl 1II25325812970242
- WykrzykowskaJJRosinbergALeeSUAutologous cardiomyotissue implantation promotes myocardial regeneration, decreases infarct size, and improves left ventricular functionCirculation201112316369
- ChenGYNayanMDuongMMarrow stromal cells for cell-based therapy: the role of antiinflammatory cytokines in cellular cardiomyoplastyAnn Thorac Surg201090119019720609773
- ChristmanKLFangQZYeeMSJohnsonKRSieversRELeeRJEnhanced neovasculature formation in ischemic myocardium following delivery of pleiotrophin plasmid in a biopolymerBiomaterials200526101139114415451633
- UrayamaKGuiliniCMessaddeqNThe prokineticin receptor-1 (GPR73) promotes cardiomyocyte survival and angiogenesisFASEB J200721112980299317442730
- StumpfCSeyboldKPetziSInterleukin-10 improves left ventricular function in rats with heart failure subsequent to myocardial infarctionEur J Heart Fail200810873373918599346
- LoehrLRRosamondWDChangPPFolsomARChamblessLEHeart failure incidence and survival (from the Atherosclerosis Risk in Communities study)Am J Cardiol200810171016102218359324
- HauserSWeichHAA heparin-binding form of placenta growth-factor (PlGF-2) is expressed in human umbilical vein endothelial cells and in placentaGrowth Factors1993942592688148155
- CarmelietPMechanisms of angiogenesis and arteriogenesisNat Med20006438939510742145
- AutieroMLuttunATjwaMCarmelietPPlacental growth factor and its receptor, vascular endothelial growth factor receptor-1: novel targets for stimulation of ischemic tissue revascularization and inhibition of angiogenic and inflammatory disordersJ Thromb Haemost2003171356137012871269
- HattoriKHeissigBWuYPlacental growth factor reconstitutes hematopoiesis by recruiting VEGFR1(+) stem cells from bone-marrow microenvironmentNat Med20028884184912091880
- TakedaYUemuraSIwamaHTreatment with recombinant placental growth factor (PlGF) enhances both angiogenesis and arteriogenesis and improves survival after myocardial infarctionCirc J20097391674168219602778
- TorryRJTomanekRJZhengWMillerSJLabarrereCATorryDSHypoxia increases placenta growth factor expression in human myocardium and cultured neonatal rat cardiomyocytesJ Heart Lung Transplant200928218319019201345
- JiaoYYUbrichNMarchand-ArvierMIn vitro and in vivo evaluation of oral heparin-loaded polymeric nanoparticles in rabbitsCirculation2002105223023511790706
- VilaASanchezAJanesKLow molecular weight chitosan nanoparticles as new carriers for nasal vaccine delivery in miceEur J Pharm Biopharm200457112313114729088
- KunduJChungYIKimYHTaebGKunduSCSilk fibroin nanoparticles for cellular uptake and control releaseInt J Pharm20103881–224225020060449
- BirnbaumYKlonerRATherapy for myocardial stunningBasic Res Cardiol19959042912938534250
- BolliRHartleyCJRabinovitzRSClinical relevance of myocardial “stunning”Cardiovasc Drugs Ther1991558778901756133
- LandaNMillerLFeinbergMSEffect of injectable alginate implant on cardiac remodeling and function after recent and old infarcts in ratCirculation2008117111388139618316487
- RoncalCBuysschaertIChorianopoulosEKBeneficial effects of prolonged systemic administration of PlGF on late outcome of postischaemic myocardial performanceJ Pathol2008216223624418729077
- ParrishDCAlstonENRohrerHInfarction-induced cytokines cause local depletion of tyrosine hydroxylase in cardiac sympathetic nervesExp Physiol201095230431419880537
- SuttonMGSSharpeNLeft ventricular remodeling after myocardial infarction – Pathophysiology and therapyCirculation2000101252981298810869273
- FuYHLinQXLiXHA novel rat model of chronic heart failure following myocardial infarctionMethods Find Exp Clin Pharmacol200931636737319798451