 ?Mathematical formulae have been encoded as MathML and are displayed in this HTML version using MathJax in order to improve their display. Uncheck the box to turn MathJax off. This feature requires Javascript. Click on a formula to zoom.
Abstract
Objective
The purpose of this study was to improve skin permeation of evodiamine and rutaecarpine for transdermal delivery with microemulsion as vehicle and investigate real-time cutaneous absorption of the drugs via in vivo microdialysis.
Methods
Pseudoternary phase diagrams were constructed to evaluate microemulsion regions with various surfactants and cosurfactants. Nine formulations of oil in water microemulsions were selected as vehicles for assessing skin permeation of evodiamine and rutaecarpine in ex vivo transdermal experiments. With a microdialysis hollow fiber membrane implanted in the skin beneath the site of topical drug administration, dialysis sampling was maintained for 10 hours and the samples were detected directly by high performance liquid chromatography. Real-time concentrations of the drugs in rat skin were investigated and compared with those of conventional formulations, such as ointment and tincture. Furthermore, the drugs were applied to various regions of the skin using microemulsion as vehicle.
Results
In ex vivo transdermal experiments, cutaneous fluxes of evodiamine and rutaecarpine microemulsions were 2.55-fold to 11.36-fold and 1.17-fold to 6.33-fold higher, respectively, than those of aqueous suspensions. Different drug loadings, microemulsion water content, and transdermal enhancers markedly influenced the permeation of evodiamine and rutaecarpine. In microemulsion application with in vivo microdialysis, the maximum concentration of the drugs (evodiamine: 18.23 ± 1.54 ng/mL; rutaecarpine: 16.04 ± 0.69 ng/mL) were the highest, and the area under the curve0–t of evodiamine and rutaecarpine was 1.52-fold and 2.27-fold higher than ointment and 3.06-fold and 4.23-fold higher than tincture, respectively. A greater amount of drugs penetrated through and was absorbed by rat abdominal skin than shoulder and chest, and a reservoir in the skin was found to supply drugs even after the microemulsion was withdrawn.
Conclusion
Compared to conventional formulations, higher cutaneous fluxes of evodiamine and rutaecarpine were achieved with microemulsion. Based on this novel transdermal delivery, the transdermal route was effective for the administration of the two active alkaloids.
Introduction
Evodiae fructus is the dried and unripe fruit of Evodia rutaecarpa (Juss) Benth. E. rutaecarpa (Juss) Benth. var. officinalis (Dode) Huang or E. rutaecarpa (Juss) Benth. var. bodinieri (Dode) Huang is also known as Wuzhuyu in China and has a long history of common use as a traditional Chinese medicine. Wuzhuyu was officially listed in the Pharmacopoeia of the People’s Republic of China for oral administration or navel application of the powder mixed with vinegar for the treatment of headache, abdominal pain, difficult menstruation, vomiting, diarrhea, and other diseases.Citation1 Evodiamine (Evo) and rutaecarpine (Rut) are the main active ingredients isolated from E. fructus.Citation2 With respect to the pharmacological actions of Evo and Rut, more attention has been paid to their antinociceptive activity and antiinflammatory effects.Citation3–Citation6 In the authors’ previous studies, topical administration of Evo and Rut at a ratio of 1:1 (w/w) elicited good antiinflammatory and analgesic effects in mice. Thus, Evo and Rut have the potential to be developed into topical antiphlogistic and analgesic preparations.
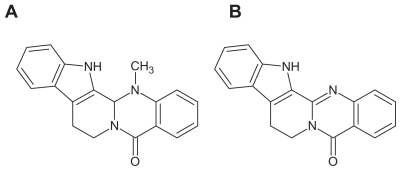
Evo and Rut are both sparingly soluble, small molecules () that must be carried by an appropriate agent at a therapeutic dose for transdermal delivery in the clinic. A rate-limiting step in transdermal drug delivery is the permeation through the stratum corneum. Thus, methods to improve skin penetration of active ingredients to achieve therapeutically relevant levels are critical for transdermal formulations. However, the high solubilities and permeation fluxes required by regular formulations, such as tinctures and ordinary creams, are difficult to achieve with Evo and Rut.
Figure 1 Structures of evodiamine (A) and rutaecarpine (B).
A microemulsion (ME) is a dispersion with a droplet diameter usually within the range of 10–100 nm.Citation7 During recent decades, numerous studies have suggested that MEs have the potential to increase cutaneous drug delivery of both hydrophilic and lipophilic drugs compared to conventional vehicles.Citation8 MEs are associated with enhanced drug solubility, thermodynamic activity towards skin, enhancement of ME component permeation, ease of formulation, and thermodynamic stability of the system.Citation9,Citation10 In this paper, because of the sparing solubilities of both Evo and Rut in aqueous solution, oil in water (O/W) MEs were employed as transdermal vehicles for improving the solubility and subsequent skin flux of each drug. The formulations of Evo and Rut-loaded MEs were optimized mainly through ex vivo skin permeation experiments. The characteristics of the prepared MEs and the stability of drug-loaded MEs prepared according to an optimal formulation were evaluated.
To further investigate skin permeation characteristics of the MEs, microdialysis was used to assess drug concentrations in the skin.Citation11 Microdialysis is a minimally invasive, in vivo sampling technique for measuring concentrations of endogenous and exogenous substances in the extracellular space of tissues or organs in the body. Dialysis is the process of sampling fluid in the in vivo environment using a semipermeable membrane that allows biological molecules to diffuse into a sample via a concentration gradient.Citation12 Preliminary results have demonstrated the ability of microdialysis probes to continuously monitor the concentrations of drugs in the dermis in vivo. Besides assessing actual skin concentrations in vivo, the microdialysis technique was successfully used for obtaining a reliable pharmacokinetic model to estimate cutaneous permeation on a routine basis.Citation13 The aim of this study was to evaluate transdermal drug delivery of Evo and Rut in rats using the in vivo microdialysis technique. To this end, different dosages and formulations of Evo and Rut (ie, tincture, ointment, and ME) were used on different regions of rat skin (eg, abdomen or shoulder). The dialysate samples were analyzed by high performance liquid chromatography (HPLC), and in vivo recovery of the probe was assessed with the retrodialysis method. Performance of the ME was compared with the performance of conventional forms to evaluate its potential for enhancing transdermal delivery.
The focus of this study was the application of in vivo microdialysis to assess transdermal drug delivery, and the innovation was to investigate the percutaneous absorption of drugs by different regions of the skin (eg, abdomen or shoulder) via microdialysis.
Materials and methods
Materials
Evo and Rut (purity > 98%, determined by HPLC) were both provided by Linuo Biotechnology Co, Ltd (Zhengzhou, China). Ethyl oleate was purchased from Shanghai Yunhong Chemical Preparation Auxiliary Technology Co, Ltd (Shanghai, China). Polyethylene glycol (PEG)-35 castor oil (Cremophor® EL) was obtained from BASF (Ludwigshafen, Germany) and all other chemicals were from Sinopharm Chemical Reagent Co, Ltd (Shanghai, China), and were of HPLC or analytical grade.
Animals
Male Sprague-Dawley rats of clean grade, weighing 180– 220 g, were used. The animal study was conducted in accordance with the approval of the Animal Ethical Committee, Shanghai University of Traditional Chinese Medicine. Animals were kept in an agreeable environment with free access to rodent diet and water, and were acclimatized for at least 1 week before start of the study.
HPLC analysis of Evo and Rut
The LC-2010A HT Liquid Chromatograph system (Shimadzu Corporation, Kyoto, Japan) was used for dialysate sample analysis to detect the presence of Evo and Rut and to determine their concentrations. The HPLC system consisted of a double plunger pump (Shimadzu Corporation, Kyoto, Japan), an autosampler (Shimadzu Corporation), an online degasser (Shimadzu Corporation), a Diamonsil C18 reverse phase column (5 μm, 4.6 mm inner diameter × 25 cm; Dikma Technologies, Inc, Beijing, China), a column oven (Shimadzu Corporation), an ultraviolet detector (Hamamatsu Photonics, Hamamatsu, Japan), and a recording integrator (Shimadzu Corporation). The mobile phase was acetonitrile:water (43:57, v/v) containing 0.04% (w/v) sodium 1-octanesulfonate with a flow of 1 mL/min. The column temperature was constant at 35°C and the detection wavelength was 225 nm. Percentage recoveries ranged from 98.6%–101.2%. The intra-day relative standard deviation values were 0.25% for Evo and 0.31% for Rut, and inter-day relative standard deviation values were 1.58% and 1.74% for Evo and Rut, respectively. The samples from ex vivo experiments were filtered through a nylon 0.45 μm pore size disposable syringe filter (diameter: 13 mm [Shanghai Anpel Scientific Instrument Inc, Shanghai, China]) before automatic injection with HPLC, and the samples from in vivo microdialysis were directly assayed in a timely manner without any handling.
Construction of pseudoternary phase diagrams
Pseudoternary phase diagrams were constructed using the water titration method at 25°C to investigate the concentration range of components for ME formation. For the preparation of each phase diagram, the weight ratios of oil in a mixture of surfactant and cosurfactant were set at 1:9, 2:8, 3:7, 4:6, 5:5, 6:4, 7:3, 8:2, and 9:1. To each mixture of oil, surfactant, and cosurfactant as above, water was added dropwise under magnetic stirring at 300 rpm. After equilibration, the mixtures were visually assessed and determined as being MEs, crude emulsions, or gels.
Preparation of Evo and Rut MEs
Based on the phase diagrams, the compositions of ME1 to ME9 were determined for various surfactants and cosurfactants, as listed in . For the preparation of each ME, Evo and Rut were accurately weighed and added to a mixture of ethyl oleate, surfactant, and cosurfactant, and stirred for about 1 hour with a polytetrafluoroethylene magnetic stir bar (length: 3 cm [Shanghai Xinpei Technology Inc, Shanghai, China]) at 300 rpm to dissolve the drugs. The required amount of water was then added dropwise under magnetic stirring at 300 rpm to form the ME. The loading of each drug was 2.0% (w/w) in all the prepared MEs; the water content of all nine formulations was 50% (w/w). To further optimize the formulation, ME2 was prepared with different drug loadings and water content and with or without permeation enhancers. To evaluate the permeation enhancers, defined levels of volatile oils or azone were directly added to the prepared MEs, and magnetically stirred for 0.5 hours at 300 rpm. Every sample of the prepared ME weighed 200 g. All the operations were performed at room temperature.
Table 1 Compositions and drug loadings of microemulsions ME1–ME9
ME characterization
The viscosities of the prepared MEs were measured using a DV-I + Digital Viscometer (Brookfield Engineering Laboratories Inc, Middleboro, MA) with No. 1 rotor set at 100 rpm, and the pH values were determined with a Jenway Digital pH Meter (Bibby Scientific Limited, Staffordshire, United Kingdom) at 25°C. The average droplet sizes of the prepared MEs were measured by photocorrelation spectroscopy using Nicomp 380/ZLS Instrument (PSS, Port Richey, FL). The appearance of the MEs was examined using a transmission electron microscope (Philips Tecnai 12; Philips, Amsterdam, the Netherlands). The samples were prepared for negative staining as follows: copper nets carrying formvar-supporting film (Zhong Jing Ke Yi Technology Inc, Beijing, China) were placed onto a stencil plate. MEs were dropped gently onto the film, and the film was allowed to dry for about 20 minutes. A drop of 2% phosphotungstic acid was then added to the film and allowed to dry for 10 minutes, and the film was then observed under a transmission electron microscope.
Preparation of formulations for comparison
The ointments used for comparison included 13% stearic acid, 6.5% glyceryl monostearate, 0.3% sodium lauryl sulfate, 2% liquid paraffin, 13% glycerol, 6.5% Vaseline® (Unilever, London, UK), 0.3% triethanolamine, and water. Stearic acid, glyceryl monostearate, liquid paraffin, and Vaseline were used as the oil phase and were mixed together in a water bath at 70°C until a clear liquid was obtained. The drugs were then added and dissolved; other components were in the aqueous phase and were mixed at 70°C. Then, the oil phase was mixed into the aqueous phase under stirring and was stirred continuously until the mixture cooled to room temperature and turned into a uniform white ointment. The aqueous suspension was prepared with pure water, and the tincture with 70% (w/w) ethanol. The concentrations of Evo and Rut in the compared ointment, aqueous suspension, and tincture were identical to those in the ME. For microdialysis study, the penetration enhancer azone (1% w/w) was added to the MEs, ointment, and tincture.
Ex vivo skin permeation studies
The ex vivo penetration experiments were carried out with a Franz diffusion cell (Tianjin Fulansi Electronic Science and Trade Co, Ltd, Tianjin, China) fitted with excised rat skin, and the prepared MEs were compared with Evo and Rut aqueous suspension and ointment.Citation14 To each donor compartment with a diffusion area of 1.77 cm2, 2 g of ME, aqueous suspension, or ointment was added and sealed with parafilm. Each receptor compartment, with a volume of 16 mL, was filled with freshly prepared 30% ethanol in water (3:7 v/v) to provide sink conditions, thermostated at 32°C, ± 0.5°C, and stirred with a magnetic bar at 300 rpm. Each experiment was performed in triplicate. At predetermined time points, 1 mL samples were removed from each receptor compartment, which was replenished with an equal volume of receptor fluid equilibrated to 32°C, ± 0.5°C. The concentrations of Evo and Rut in the obtained samples were determined by HPLC.Citation15 Permeation profiles for Evo and Rut were obtained by plotting the mean cumulative permeation amounts per cm2 of MEs, aqueous suspension, or ointment against time. Linear regression analysis was performed to determine skin fluxes (Js, μg/cm2/hour) of Evo and Rut.
Stability of MEs
For stability evaluation, Evo and Rut-loaded MEs prepared according to optimal formulation were stored at 25°C for 6 months. The physical stability of each ME was evaluated monthly through observation of physical changes, such as phase separation, flocculation and/or precipitation, droplet size change, and a centrifugation stability test at 10,000 rpm for 30 minutes. Chemical stability was evaluated monthly by measuring Evo and Rut concentrations using HPLC.
Microdialysis system
The microdialysis system consisted of a WZ-50C6 Micro Infusion pump (Smiths Medical, Norwell, MA) with a 20 mL plastic syringe and a linear microdialysis probe. The Spectra/ Por® Microdialysis Hollow Fibers (Spectrum Laboratories, Inc, Chicago, IL) were prepared using regenerated cellulose (200 μm inner diameter, 280 μm outer diameter, 13,000 Da molecular weight cut-off). The fiber was glued with cyanoacrylate adhesive (MXBON® Super Glue; Cartell Chemical Co Ltd, Chia-Yi Hsien, Taiwan) to quartz capillary tubing (Welch Materials, Inc, Shanghai, China) to make linear microdialysis probes. The inlet tube of the probe was connected to the microinjection pump using polyethylene tubing. In all experiments, the length of the membrane accessible to dialysis was approximately 20 mm, and the perfusate flow rate was 0.2 mL/hour (3.33 μL/minute). Cannulas were used as insertion guides, and vials were used to collect the dialysate samples.
Standard (STD) solutions of Evo and Rut were prepared by dissolving pure Evo and Rut in 10% (w/w) ethanol solution. The concentrations of the STD solutions were as follows: STD1 (0.40 μg/mL), STD2 (0.80 μg/mL), STD3 (1.60 μg/mL), STD4 (2.40 μg/mL), STD5 (3.20 μg/mL), and STD6 (4.00 μg/mL). An aqueous solution of urethane 20% (w/w) was used in the experiments.
Ex vivo recovery validation
Ex vivo recovery was estimated prior to the onset of microdialysis studies to ensure that the probes used would provide reproducible and efficient sampling.
A linear probe was placed in a 50 mL beaker containing STD3 solution, and the dialysis membrane part of the probe was completely immersed in the solution at room temperature. The probe was perfused with 10% (w/w) ethanol solution under a flow rate of 0.2 mL/hour (3.33 μL/minute). After an equilibration period of 30 minutes, the dialysate was collected into a small vial for 30 minutes. Then, the dialysate sample was analyzed by HPLC for determining the concentrations of Evo and Rut. Relative recovery (RR) was calculated as the slope of the linear regression of drug concentration in the dialysate (Cd) as a function of drug concentration in the medium (Cm) (EquationEquation 1(1) ).
For the retrodialysis studies, the probe was perfused with STD solutions containing different concentrations of Evo and Rut (STD1, STD2, STD3, STD4, STD5, and STD6) in sequence. A linear probe was placed in a 50 mL beaker with the membrane part completely immersed in 10% (w/w) ethanol solution at room temperature. STD1 was first used as a perfusate at a flow rate of 3.33 μL/minute. After equilibration for 30 minutes, the dialysate sample was collected into a vial for another 30 minutes. Next, STD1 was replaced with STD2, STD3, STD4, STD5, and STD6 in order, and the procedure was repeated as above with the ethanol solution refreshed each time. The diffusive loss of Evo and Rut from perfusates was determined, and RR was calculated using EquationEquation 2(2) , where Cp is the drug concentration in the perfusate.
The retrodialysis method was also used to study the influence of various flow rates on recovery of the probe. Again, a linear probe was placed in a 50 mL beaker with the membrane part completely immersed in 10% (w/w) ethanol solution at room temperature. STD3 solution was selected as the perfusate, and the probe was perfused at flow rates of 0.1 mL/hour (1.67 μL/minute), 0.2 mL/hour (3.33 μL/minute), 0.3 mL/hour (5 μL/minute), 0.4 mL/hour (6.67 μL/minute), and 0.5 mL/hour (8.33 μL/minute). For each flow rate, the dialysate sample was collected after 30 minutes equilibration. Five dialysate samples were obtained for each probe and further analyzed by HPLC. Using EquationEquation 2(2) , RR was calculated for each flow rate.
In vivo microdialysis studies
Probe implantation
A male Sprague-Dawley rat, weighing about 200 g, was anesthetized with urethane aqueous solution (1.3 g/kg, intraperitoneally), and anesthesia was maintained throughout the experiment. Abdominal fur was manually clipped with a blade, taking care not to damage the skin. The rat was immobilized on a mat with the abdomen facing upward. The ambient temperature was kept constant at 25°C. Probe insertion was accomplished with a hypodermic needle, which served as a guide cannula. An entry puncture was made in the skin, and the needle was inserted through the skin for an appropriate length (20–25 mm) before leaving the skin via an exit puncture. The microdialysis probe was then inserted through the guide cannula, which was then retracted to expose the active dialysis window beneath the site of topical drug administration. The insertion guide was removed and the inlet tube was attached to the microinjection pump via connecting tubing. After probe implantation, the skin was visually inspected for punctures. The probe was also implanted under the skin of the shoulder or chest in the same manner as above.
In vivo microdialysis sampling
Following probe implantation, the connective tubing from the probe was immobilized with adhesive tape to secure its position in the skin. After making sure that the tubing was unblocked, perfusion was initiated with the microdialysis pump at a flow rate of 0.2 mL/hour (3.33 μL/minute). The probe was continuously perfused with 10% (w/w) ethanol solution. The skin was allowed to equilibrate for 1 hour before a blank sample was taken. At 1.5 hours after perfusion, the drug was applied. Due to fluidity, cotton wool soaked with the ME (2 g) or tincture (2 g) was applied on the skin above the probe. The ointment (2 g) was applied directly on the skin above the probe. Dialysate samples were collected into small vials, and the collection vial was replaced every 30 minutes. Dialysis sampling was maintained for 10 hours. The ME, tincture, and ointment were all tested on the abdominal region, while ME was also tested on the shoulder and chest regions. Furthermore, another experiment was carried out in which the ME was removed after a 3 hour application on the abdominal skin.
In vivo recovery correction
In vivo RR was estimated in separate experiments subsequent to microdialysis studies, using the retrodialysis-by-drug method, which relies on the assumption that net drug transport from the perfusate into the surrounding tissues through the microdialysis membrane equals the net drug transport from the tissues into the perfusate.Citation16 The diffusive loss of the drugs of interest was determined, and RR was calculated using EquationEquation 2(2) .
In this experiment, a linear probe was inserted into the dermis of an anesthetized rat’s abdominal skin, as described above. However, the rat did not receive any test formulation. After perfusing with 10% (w/w) ethanol solution for 1 hour, STD1 was used as the perfusate. Perfusion by STD1 was allowed to equilibrate for 30 minutes, after which the perfusion continued for another 30 minutes with sampling as usual. Following a 1 hour perfusion, STD1 was replaced with STD2. The same procedures were performed with STD2, and the other solutions STD3, STD4, STD5, and STD6 were sequentially perfused in the same manner. HPLC assay and data analysis were carried out to determine the loss of Evo and Rut from the STD solutions.
Statistical analysis
The results are expressed as mean ± standard deviation. Statistical data were analyzed by one-way analysis of variance, and comparisons were made with Student’s t-test using SPSS software (v 13.0; SPSS, Inc, Chicago, IL). P values less than 5% were considered to be significant. The cutaneous pharmacokinetic parameters of Evo and Rut were calculated with WinNonLin (v 5.2; Pharsight Corporation, Sunnyvale, CA) using noncompartmental analysis.
Results and discussion
Selection of components for MEs
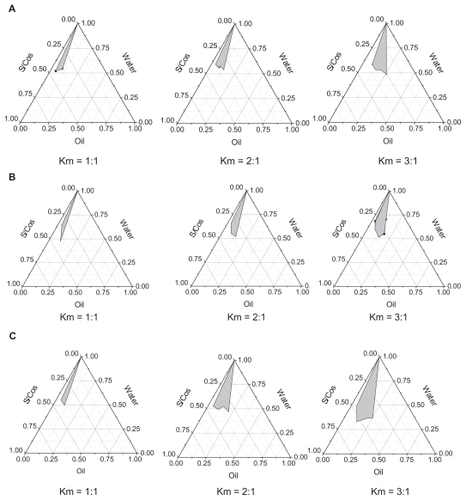
Ethyl oleate was selected as the oil phase for satisfactory solubilities of Evo and Rut. With increasing Km (the weight ratio of surfactant to cosurfactant), O/W ME regions increased in all phase diagrams. As shown in , the barely satisfactory results improved with Cremophor EL as the surfactant, and the largest grey area occurred with PEG400 as the cosurfactant at the same Km value. PEG400 has a solubilization capacity for lipid-soluble drugs and the highest hydrophile–lipophile balance value among all the cosurfactants, which may contribute to ME formation.
Figure 2 Pseudoternary phase diagrams of microemulsions with ethyl oleate as the oil phase. (A) represents the pseudoternary phase diagrams of microemulsions with Tween®-80 as surfactant (S) and ethanol as cosurfactant (Cos); (B) represents the pseudoternary phase diagrams of microemulsions with Cremophor® EL as surfactant and ethanol as cosurfactant (Cremophor EL/ethanol, S/Cos); (C) represents the pseudoternary phase diagrams of microemulsions with Cremophor EL as surfactant and polyethylene glycol 400 as cosurfactant (Cremophor EL/PEG400, S/Cos); Km represents the weight ratios of surfactant to cosurfactant.
Characterization of MEs
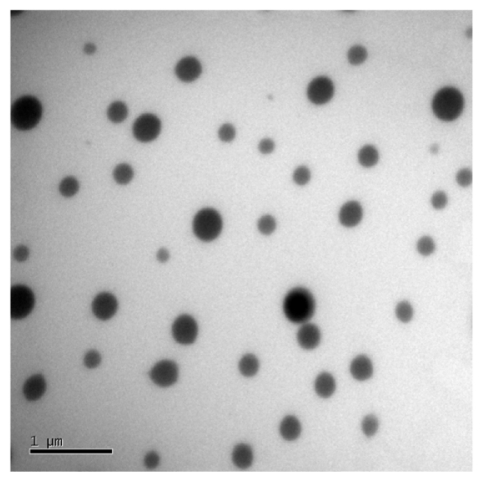
Nine representative ME formulations were selected for further screening (). According to the phase studies, all the selected formulations readily formed transparent MEs. Several surfactants and cosurfactants were used at varying ratios in ME preparations to fully evaluate their potential transdermal effects. The characteristics of the nine MEs (ME1 to ME9), such as mean droplet size, polydispersity, and viscosity, are listed in . The mean droplet sizes of the MEs were all below 50 nm, ranging from 10.7 nm in ME7 to 48.1 nm in ME1. Polydispersity indices were from 0.10 to 0.49. Increased viscosities of the systems were observed with increasing surfactant amounts in the ME formulations (). Droplets presented a spherical shape and remained separate when observed by transmission electron microscope (). An interesting change was observed in that the droplet size of the drug-loaded MEs was larger than those without Evo and Rut. A similar phenomenon was reported by Chen et alCitation17 that may be attributed to the embedding of Evo and Rut in the interfacial film.Citation18,Citation19 The pH values of all the MEs were in the appropriate range of 5.0–6.0.
Table 2 Microemulsion characteristics and skin permeation rates of evodiamine and rutaecarpine (mean ± standard deviation, n = 3)
Figure 3 Transmission electron microscopy of evodiamine and rutaecarpine-loaded microemulsion ME2.
Ex vivo skin permeation studies
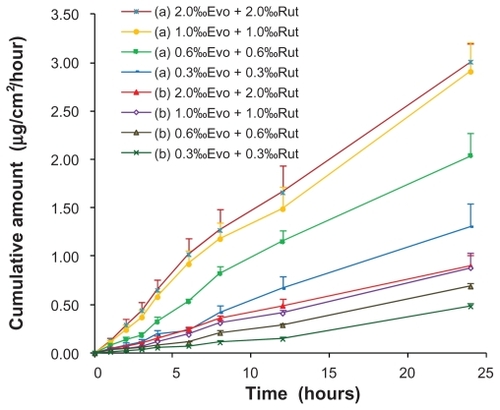
The external standard method was selected for detecting the drugs by HPLC, and a satisfactorily high precision was achieved, presumably because the samples were injected into HPLC through a high precise autosampler and without any complicated prior handling (eg, centrifugation or extraction with organic reagents). In general, the internal standard method is often adopted to increase assay precision;Citation20 however, the external standard method may be preferentially used for greater convenience and efficiency when eligible precision and recovery can be realized. The mean cumulative permeation rates (μg/cm2) for ME1 to ME9 vs time are summarized in and .
Figure 4 Ex vivo rat skin permeation profiles of evodiamine (A) and rutaecarpine (B) from microemulsions (n = 3).
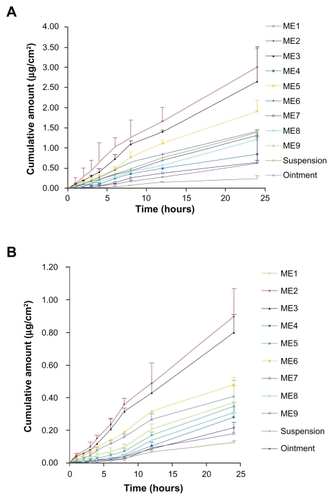
The permeation profiles of all the tested vehicles followed zero-order release kinetics. Statistical comparison of the flux in a 24-hour period showed that all nine MEs provided higher fluxes than the aqueous suspension and ointment (O/W) containing the same dosages of ingredients. The fluxes of Evo and Rut in MEs were 2.55-fold to 11.36-fold and 1.17-fold to 6.33-fold higher, respectively, than those of aqueous suspensions. The fluxes of Evo and Rut in the aqueous suspension were the lowest, which may be due to the fact that Evo and Rut dissolved better in the MEs and the ointment, leading to higher concentration gradients toward the skin.Citation21 MEs provided higher fluxes than the ointment, perhaps because of the larger viscosity and particle size of the ointment compared to that of the MEs, which would have delayed the diffusion of Evo and Rut from the ointment toward the skin surface. Another factor in the ME-mediated faster permeation may be related to the reduction in interfacial tension between the skin and vehicle, resulting from its close contact with skin lipids, as reported in the literature.Citation22 Among the nine MEs, ME2 provided the highest fluxes of Evo and Rut (0.125 ± 0.024 μg/cm2/hour and 0.038 ± 0.007 μg/cm2/hour, respectively), while the fluxes of ME7, with the highest viscosity, were the lowest (0.028 ± 0.005 μg/cm2/hour and 0.007 ± 0.001 μg/cm2/hour, respectively) (). Permeation of each compound was reduced with a higher proportion of surfactant, while the corresponding viscosity increased. Viscosity has been reported to play an important role in the release of drugs into the receptor compartment, because drug diffusion through the double layer of the ME may comprise a rate-determining step.Citation23 The ME2 droplet size was the smallest, along with ME5 and ME8, which had higher polydiversity and viscosity values than ME2. This may have led to the ingredients in ME2 easily permeating through the stratum corneum of the skin. Notably, as can be seen in and , the permeation amounts and flux rates of Evo and Rut both declined with an increase in the amount of surfactants. Similar results were reported previously.Citation24 An explanation for this is that the thermodynamic activities of the drugs in the ME decreases with higher concentration of surfactants.Citation25
ME2 was selected for further studies because it exhibited the highest permeation and solubility for Evo and Rut. To further optimize the formulation, the effects of drug loading, water weight fraction, and penetration enhancers on the skin permeation of Evo and Rut were investigated using ME2.
The effects of drug loading in the ME on the penetration rates of Evo and Rut are shown in . The skin permeation of each drug was proportional to drug loading until the solubility limit was reached. There was no significant increase in drug permeation when drug loading was increased from 1% to 2% (P > 0.05).
Figure 5 Ex vivo rat skin permeation profiles of evodiamine (a) and rutaecarpine (b) from microemulsions with different drug loadings (n = 3).
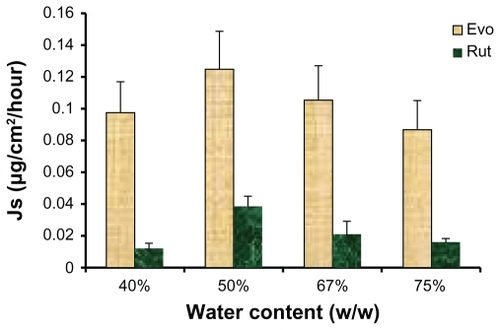
The influence of water weight fraction of the ME on skin permeation of each drug is illustrated in . The highest permeation rates for both drugs were obtained when the water content was 50% (w/w). A decreasing trend in the skin fluxes of Evo and Rut was observed when the water weight fraction in the ME was greater or less than 50%. These results suggest that drug skin flux may be improved by choosing the appropriate water content for MEs. With an increased water content, ME viscosity would decrease, which may facilitate the gathering of droplets on the skin surface to form a high concentration gradient, thus enhancing the permeation of Evo and Rut.Citation21 On the other hand, excess water content may lead to droplet concentration being too low to form an effective concentration gradient of the drugs toward the skin, thus reducing the flux of Evo and Rut.Citation26
Figure 6 Ex vivo rat skin permeation rates of evodiamine (Evo) and rutaecarpine (Rut) from microemulsions with different water content (n = 3).
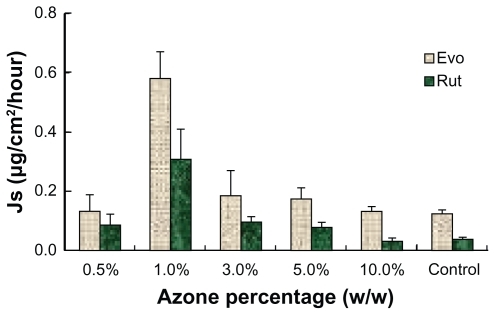
To maximize the permeation rate of the ME, transdermal enhancers were investigated. Azone and several volatile oils were added to the MEs at different proportions to evaluate their influence on permeation performance. All the MEs with volatile oils presented higher permeation rates for Evo and Rut. As shown in , the flux generally increased with rising proportions of volatile oils. However, when the volatile oil reached a certain point, the permeation rates showed a downward trend. A large amount of volatile oils may form a gel on the surface of the MEs and increase the viscosity, thus reducing the diffusion velocity and decreasing permeation rates. Among the tested volatile oils, pennyroyal showed perfect permeation enhancement. When 5% pennyroyal was incorporated into ME, the permeation rates of Evo and Rut increased from 0.125 ± 0.031 μg/cm2/hour and 0.038 ± 0.011 μg/cm2/hour to 0.572 ± 0.096 μg/cm2/hour and 0.274 ± 0.014 μg/cm2/hour, respectively. However, the volatility of pennyroyal may lead to unstable fluxes of the ingredients permeating through the skin, especially for external applications. The permeation enhancement effect of azone on Evo and Rut is illustrated in . With the addition of azone to the ME, the permeation rates of both drugs increased; the highest skin permeation for each drug was observed when azone was added at 1.0% (w/w). No significant difference between azone and pennyroyal was detected at the optimum level. Azone has been extensively used as a permeation enhancer because of its stable physical and chemical properties and its safety for human use.Citation27 Therefore, azone was suitable as a permeation enhancer for Evo and Rut-loaded MEs.
Figure 7 Ex vivo rat skin permeation rates of evodiamine (A) and rutaecarpine (B) from microemulsions in the presence of various volatile oils (n = 3).

Figure 8 Ex vivo rat skin permeation rates of evodiamine (Evo) and rutaecarpine (Rut) from microemulsions in the presence of azone (n = 3).
Stability studies
Centrifugation tests (13,000 rpm for 30 minutes) demonstrated no delamination of the ME formulations, indicating that the MEs had good physical stability. The Evo and Rut-loaded MEs, prepared according to the optimal formulation, were physicochemically stable after storage at 25°C for 6 months. Droplet sizes were measured monthly and changes within a range of 20.8 ± 0.9 nm to 22.4 ± 1.8 nm were observed during the test period. However, the data presented no significant differences (P > 0.05).
Ex vivo and in vivo recovery validation of microdialysis
Five types of perfusates were evaluated using ex vivo recovery experiments: phosphate buffer saline (pH 6.4), phosphate buffer saline (pH 7.4), normal saline, 10% ethanol– water solution, and 20% ethanol–water solution. The 10% and 20% ethanol–water solutions showed the best recoveries, while the presence of Evo and Rut was hard to detect in the others, perhaps due to the greater solubilities of Evo and Rut in 10% and 20% ethanol–water solutions. Besides having good solubility for the drug and providing good sink conditions, a suitable perfusate must cause little or no harm. In this respect, high ethanol content may change the properties of the extracellular fluids around the probe and further influence drug distribution. Therefore, the 10% ethanol–water solution was confirmed as the perfusate for ex vivo and in vivo studies. No obvious skin injury was observed during the in vivo experiments.
From the ex vivo recovery validation studies using STD1 to STD6 as perfusates, a linear correlation was found between the drug concentrations in the perfusate and the dialysate (Evo: Cd = 0.61, Cp = −0.06, r2 = 0.995; Rut: Cd = 0.67, Cp = −0.09, r2 = 0.989). This correlation implied that ex vivo recovery by retrodialysis was independent of perfusate concentrations, validating the feasibility of the microdialysis technique for detecting true unbound extracellular levels of Evo and Rut. The ex vivo recovery of both Evo and Rut were the highest at a flow rate of 3.33 μL/minute. In general, the higher the perfusion flow rate, the lower the RR.Citation11 Our discovery of a decline in RR with an increase in flow rates (from 3.33 L/minute to 8.33 μL/minute) is consistent with this. A lower perfusate flow allowed more time for the drugs to diffuse through the dialysis membrane, thus enhancing the equilibrium process. Nevertheless, a slight decrease in ex vivo recovery was observed at the lowest flow rate of 1.67 μL/minute compared to 3.33 μL/minute. A potential reason may be the adhesion of drug molecules to the dialysis membrane, resulting from an extended equilibration time. Therefore, a flow rate of 3.33 μL/minute, with the highest ex vivo recovery, was determined as the optimum.
The general recovery of microdialysis probes (positive dialysis) was 45.42% ± 0.96% for Evo and 43.75% ± 0.63% for Rut using STD3 as the medium. Since the in vivo recovery of positive dialysis cannot be directly determined, a general practice is to investigate using the retrodialysis method, but one must ensure consistent results from the two dialysis methods. In the ex vivo studies, no significant difference was observed between the recoveries from dialysis and retrodialysis (P > 0.05) with 10% ethanol solution as perfusate at a flow of 3.33 μL/minute.
In vivo recovery was lower than ex vivo recovery, as expected. Greater diffusional resistance in the living tissue led to a lower in vivo recovery, and volume distribution and clearance of the drugs may also contribute to the low in vivo recovery. As with ex vivo recovery by retrodialysis, a linear correlation was found between the drug concentrations in the perfusate and the dialysate for in vivo recovery by retrodialysis (Evo: Cd = 0.76, Cp = −0.09, r2 = 0.990; Rut: Cd = 0.81, Cp = −0.09, r2 = 0.994). This correlation confirmed that in vivo recovery by retrodialysis was independent of perfusate concentrations, and can be used to correct the data from in vivo microdialysis samplings (the maximum recovery values of 33.71% ± 0.23% for Evo and 30.19% ± 0.31% for Rut were used).
The recovery validation studies confirmed that both ex vivo and in vivo recoveries were independent of analyte concentrations. In vivo recovery was lower than ex vivo recovery; this may be due to different diffusion environments in the living tissue compared to simple solutions. Therefore, the living tissue, rather than the microdialysis probe, was found to be the rate-limiting factor for diffusion in the dialysis. Since no time-dependent changes in recovery were observed, the retrodialysis-by-drug method was reliable for correction.
In vivo microdialysis
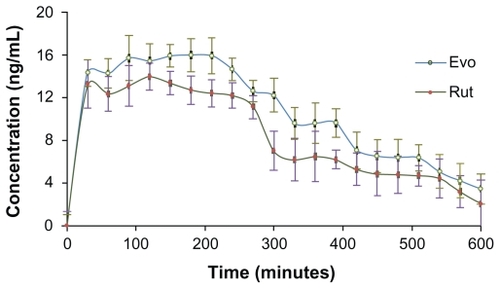
Time-concentration profiles of Evo and Rut after topical application of the formulations as ME, ointment, and tincture on abdominal skin in rats are depicted in . Relatively smooth curves were observed for ME and tincture applications, indicating steady and even drug absorption through the abdominal skin (). In contrast, the curve for ointment application was irregular with constant rise and falls, which implied unstable transdermal drug absorption (). Unlike the ME and tincture formulations which were fluids, the ointment formulation was semisolid. Therefore, the distribution of drug molecules within the ointment and their penetration through the skin were not as even for ME and tincture, potentially contributing to fluctuations in the transdermal behavior of Evo molecules. A few sudden increases in Evo concentrations were possibly caused by some ointment passing through the inlet puncture of the probe to be directly captured in the dialysate. Similar patterns were observed for Rut (), but the fluctuations were milder.
Figure 9 Time course of evodiamine (A) and rutaecarpine (B) concentrations sampled after the administration of drug-containing microemulsion, ointment, and tincture on the abdominal skin of Sprague-Dawley rats over 10 hours (n = 5).
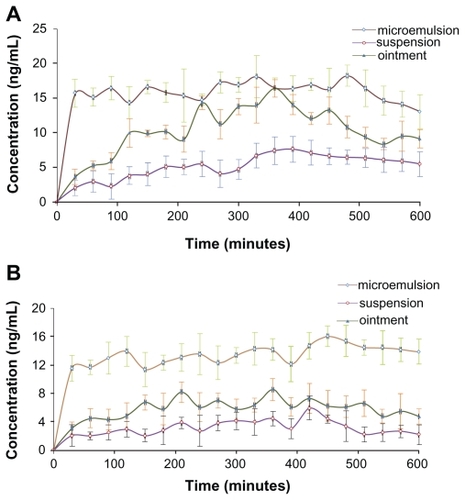
The maximum concentration (Cmax) of the drugs from ME were the highest (Evo: 18.23 ± 1.54 ng/mL; Rut: 16.04 ± 0.96 ng/mL), and the area under the curve (AUC0–t) of Evo and Rut was 1.52-fold and 2.27-fold higher than those of ointment, and 3.06-fold and 4.23-fold higher than those of tincture, respectively (). Evidently, the transdermal concentrations and cumulative amounts of Evo and Rut were the highest for ME, while the aqueous tincture presented the lowest concentrations and amounts. Additionally, the cutaneous penetration rates of drugs in ointment and tincture applications were relatively slow (the curves climbed gradually) compared to the ME application, where the drug concentrations rose steeply within 30 minutes ().
Table 3 Cutaneous pharmacokinetic parameters of evodiamine and rutaecarpine from various formulations in rats (mean ± standard deviation, n = 5)
Topically applied MEs have been shown to significantly increase the cutaneous absorption of drugs.Citation10 The increased absorption of drugs is attributed to skin penetration enhancement by the carrier, which has thermodynamic stability, low viscosity, high surface area (high solubilization capacity), and very small droplet size. The potential strategies to enhance drug penetration through the skin include altering the skin physiology and modifying the formulation to influence drug partition, diffusion, or solubility. The oil-soluble Evo and Rut were solubilized in ME droplets, which passed through the stratum corneum with ease to release the drugs in intercellular spaces. Furthermore, ethyl oleate as the oil phase acted as a penetration enhancer that increased skin permeability.Citation28 In the cases of ointment and tincture, the solubilities of Evo and Rut were rather low, and the fluidity of ointment was poor, while tincture had the problem of ethanol volatilization. Thus, transdermal concentrations of Evo and Rut molecules through the abdominal skin in rats were higher for the ME formulation than the conventional form of ointment or tincture.
Time-concentration profiles of Evo and Rut after topical application of the ME on abdomen, chest, and shoulder of rats are depicted in . Evo concentrations in the abdomen, shoulder, and chest regions increased during the initial 100 minutes before reaching a plateau, and the concentrations stayed relatively stable afterward (). However, Cmax was different in the three regions: 18.23 ± 1.54 ng/mL for abdominal application, 8.20 ± 0.91 ng/mL for chest, and 4.24 ± 0.49 ng/mL for shoulder (). The same patterns were observed for Rut concentrations ( and ), which were only slightly lower than those of Evo.
Table 4 Cutaneous pharmacokinetic parameters of evodiamine and rutaecarpine from various skin regions in rats (mean ± standard deviation, n = 5)
Figure 10 Time course of evodiamine (A) and rutaecarpine (B) concentrations sampled after microemulsion administration on the abdomen, shoulder, and chest regions of Sprague-Dawley rats over 10 hours (n = 5).

Evo and Rut transdermal concentrations climbed sharply during the initial 30 minutes and were significantly absorbed by abdominal skin, with the concentrations being more than double those of chest skin, and four times higher than those of shoulder skin. The reason may be that the stratum corneum is the thinnest in abdominal skin, followed by chest skin, and is relatively thick in shoulder skin.Citation29 As the stratum corneum serves as the main barrier for transdermal drug delivery, drug molecules most easily penetrate through the abdominal skin, resulting in the highest transdermal concentrations of Evo and Rut. This finding is in accordance with the results of ex vivo transdermal diffusion studies using excised rat skin from corresponding sites.
Time-concentration profiles of Evo and Rut after topical application of the ME on the abdominal skin of rats for a defined period of time (3 hours) exhibited analogous patterns (). The concentrations of Evo and Rut climbed sharply during the initial 30 minutes, reached maximum values around 120 minutes, and maintained a plateau until 180 minutes, after which the ME was withdrawn. Then, Evo and Rut concentrations declined as no formulation was applied. However, the decline in concentrations was gradual and not steep. A slow reduction was observed after 200 minutes, and a relatively big fall to nearly half of Cmax occurred between 240–340 minutes, followed by a mild decrease again.
Figure 11 Time course of evodiamine (Evo) and rutaecarpine (Rut) concentrations sampled after drug microemulsion administration (removed after 3 hours) on the abdominal skin of Sprague-Dawley rats over 10 hours (n = 5).
The variation in transdermal concentration trends of Evo and Rut indicated that there was some storage of drug molecules in the skin after the ME was withdrawn. The stocked drug molecules were released to maintain their transdermal concentrations in the absence of a formulation supply. This drug reservoir was able to last for a period of time, with the drug concentrations decreasing gradually before depletion. The stratum corneum is a strong candidate for the reservoir, particularly its intercellular lipid bilayers, because Evo and Rut can accumulate in lipophilic compartments. Furthermore, the unique structure of ME droplets may also potentially contribute to this retention phenomenon.
The ME formulation enhanced skin penetration and absorption of Evo and Rut molecules, relative to ointment and tincture. Furthermore, the cutaneous penetration rates of Evo and Rut were expectedly much higher for ME. The ME was more efficiently used when applied on abdominal skin in rats, resulting in greater permeation and absorption of Evo and Rut. Hence, the abdomen with a relatively thin skin layer (thin stratum corneum) was demonstrated to be an ideal location for transdermal drug delivery, far better than chest or shoulder. It was further discovered that ME application resulted in the formation of a drug reservoir in the skin, which released Evo and Rut for an extended period after the drug formulation was withdrawn. This resulted in a prolonged effect of the ME formulation.
In vivo experiments were carried out to investigate the relevance of ME as a transdermal route for administration of Evo and Rut. Being a superior technique to directly assess unbound extracellular drug levels in the skin, in vivo microdialysis proved to be a sensitive and less invasive technique for monitoring the real-time true transdermal concentrations of analytes and their cutaneous penetration rates. The HPLC turned out to be rather compatible with direct injection of aqueous microdialysis samples. The importance of performing recovery validation studies for data interpretation and accuracy of determinations was demonstrated.
Conclusion
An O/W ME containing Evo and Rut was formulated for transdermal delivery. Ex vivo skin permeation and in vivo microdialysis were used to evaluate the percutaneous penetration of drugs. The data indicate that the transdermal route is an effective way to deliver the two active alkaloids.
Acknowledgments
This work was financially supported by a grant (09JW10) from Shanghai Education Committee, Subject Chief Scientist Program (10XD14303900) from Science and Technology Commission of Shanghai Municipality, and Program (NCET08-0898) for New Century Excellent Talents in Universities from the State Education Ministry, China.
The authors would like to thank Professor Annie Bligh from London Metropolitan University (United Kingdom), Dr Ji-Yong Liu from Changhai Hospital (Shanghai, China) and Dr Yu Liu from Fudan University (Shanghai, China) for their advice and assistance throughout the thesis process.
Disclosure
The authors report no conflicts of interest in this work.
References
- Chinese Pharmacopoeia CommitteePharmacopoeia of the People’s Republic of ChinaIBeijing, ChinaChemical Industry Press2010
- MoonTCMurakamiMKudoIA new class of COX-2 inhibitor, rutaecarpine from Evodia rutaecarpaInflamm Res1999481262162510669112
- MatsudaHYoshikawaMIinumaMKuboMAntinociceptive and anti-inflammatory activities of limonin isolated from the fruits of Evodia rutaecarpa var. bodinieriPlanta Med19986443393429619117
- YaroshDBGalvinJWNaySLPenaAVCanningMTBrownDAAnti-inflammatory activity in skin by biomimetic of Evodia rutaecarpa extract from traditional Chinese medicineJ Dermatol Sci2006421132116423507
- KoHCWangYHLiouKTAnti-inflammatory effects and mechanisms of the ethanol extract of Evodia rutaecarpa and its bioactive components on neutrophils and microglial cellsEur J Pharmacol20075552–321121717109845
- KobayashiYThe nociceptive and anti-nociceptive effects of evodiamine from fruits of Evodia rutaecarpa in micePlanta Med200369542542812802723
- TenjarlaSMicroemulsions: an overview and pharmaceutical applicationsCrit Rev Ther Drug Carrier Syst199916546152110635455
- KreilgaardMInfluence of microemulsions on cutaneous drug deliveryAdv Drug Deliv Rev200254Suppl 1S77S9812460717
- PodlogarFBester RogacMGasperlinMThe effect of internal structure of selected water-Tween 40-Imwitor 308-IPM microemulsions on ketoprofene releaseInt J Pharm20053021–2687716099611
- KoganAGartiNMicroemulsions as transdermal drug delivery vehiclesAdv Colloid Interface Sci2006123–126369385
- ChaurasiaCSMüllerMBashawEDAAPS-FDA workshop white paper: microdialysis principles, application and regulatory perspectivesPharm Res20072451014102517458685
- CarrollJBrookshireBRMathewsTAMicrodialysis. Pharmaceutical sciences encyclopedia: drug discovery, development, and manufacturingHoboken, NJJohn Wiley & Sons2010
- KreilgaardMDermal pharmacokinetics of microemulsion formulations determined by in vivo microdialysisPharm Res200118336737311442278
- TsaiYHLeeKFHuangYBHuangCTWuPCIn vitro permeation and in vivo whitening effect of topical hesperetin microemulsion delivery systemInt J Pharm20103881–225726220060453
- ZhaoYLiZZhouXCaiZGongXZhouCQuality evaluation of Evodia rutaecarpa (Juss.) Benth by high performance liquid chromatography with photodiode-array detectionJ Pharm Biomed Anal20084841230123618930617
- KreilgaardMAssessment of cutaneous drug delivery using microdialysisAdv Drug Deliv Rev200254Suppl 1S99S12112460718
- ChenHChangXWengTA study of microemulsion systems for transdermal delivery of triptolideJ Control Release200498342743615312998
- SintovACShapiroLNew microemulsion vehicle facilitates percutaneous penetration in vitro and cutaneous drug bioavailability in vivoJ Control Release200495217318314980766
- PaolinoDVenturaCANisticòSPuglisiGFrestaMLecithin microemulsions for the topical administration of ketoprofen: percutaneous adsorption through human skin and in vivo human skin tolerabilityInt J Pharm20022441–2213112204562
- WuFZhangZDingHSimple high-performance liquid chromatographic method for the determination of tetramethylpyrazine phosphate in very small volumes of dog plasma: application to a pharmacokinetic studyJ Chromatogr Sci2006441131716599405
- Goldberg-CettinaMLiuPNightingaleJKurihara-BergstromTEnhanced transdermal delivery of estradiol in vitro using binary vehicles of isopropyl myristate and short-chain alkanolsInt J Pharm19951142237245
- SchmalfuszUNeubertRWohlrabWModification of drug penetration into human skin using microemulsionsJ Control Release1997463279285
- HoHOHsiaoCCSheuMTPreparation of microemulsions using polyglycerol fatty acid esters as surfactant for the delivery of protein drugsJ Pharm Sci19968521381438683437
- GannuRPalemCRYamsaniVVYamsaniSKYamsaniMREnhanced bioavailability of lacidipine via microemulsion based transdermal gels: formulation optimization, ex vivo and in vivo characterizationInt J Pharm20103881–223124120060457
- RheeYSChoiJGParkESChiSCTransdermal delivery of ketoprofen using microemulsionsInt J Pharm20012281–216117011576778
- ReifenrathWGRobinsonPBBoltonVDAliffREPercutaneous penetration of mosquito repellents in the hairless dog: effect of dose on percentage penetrationFood Cosmet Toxicol19811921951996116656
- StoughtonRMcClureWAzone: a new non-toxic enhancer of cutaneous penetrationDrug Dev Ind Pharm198394725744
- El MaghrabyGMAlanaziFKAlsarraIATransdermal delivery of tadalafil. I. Effect of vehicles on skin permeationDrug Dev Ind Pharm200935332933618821150
- LiangWQBiopharmaceutics and PharmacokineticsBeijing, ChinaPeople’s Medical Publishing House2003