 ?Mathematical formulae have been encoded as MathML and are displayed in this HTML version using MathJax in order to improve their display. Uncheck the box to turn MathJax off. This feature requires Javascript. Click on a formula to zoom.
Abstract
p28 is a 28-amino acid peptide fragment of the cupredoxin azurin derived from Pseudomonas aeruginosa that preferentially penetrates cancerous cells and arrests their proliferation in vitro and in vivo. Its antitumor activity reportedly arises from post-translational stabilization of the tumor suppressor p53 normally downregulated by the binding of several ubiquitin ligases. This would require p28 to specifically bind to p53 to inhibit specific ligases from initiating proteosome-mediated degradation. In this study, atomic force spectroscopy, a nanotechnological approach, was used to investigate the interaction of p28 with full-length p53 and its isolated domains at the single molecule level. Analysis of the unbinding forces and the dissociation rate constant suggest that p28 forms a stable complex with the DNA-binding domain of p53, inhibiting the binding of ubiquitin ligases other than Mdm2 to reduce proteasomal degradation of p53.
Keywords:
Introduction
The p53 protein is a transcription factor that acts as a tumor suppressor by playing an essential role in preventing inappropriate cell proliferation and in maintaining genome integrity. It is stabilized by post-translational modifications in response to different stress signals, increasing its intracellular levels and activating the transcription of downstream target genes that regulate cell-cycle arrest, DNA repair, and apoptosis.Citation1,Citation2 p53 is a 393-residue protein with three functional domains: an N-terminal domain (NTD, aa 1–93), a core DNA-binding domain (DBD, aa 102–292), and a C-terminal domain (CTD, aa 293–393) that are responsible for its transcriptional activation, DNA-binding, and tetramerization functions, respectively.Citation3,Citation4 The activity of p53 is tightly regulated through post-translational modification, localization, and degradation.Citation5 Its major negative regulator is the Mdm2 oncoprotein that inhibits its transcriptional activity,Citation6 favors its nuclear export,Citation7 and acts as an E3 ubiquitin ligase, targeting p53 for proteasomal degradation.Citation8 The regulatory function of Mdm2 is exerted through formation of a complex with p53.Citation6,Citation9
The central role of p53 in safeguarding the genome integrity provides an attractive target for anticancer drugs that can stabilize it, interfere with its downregulatory pathway,Citation10,Citation11 and enhance its tumor-suppressor function in cancer cells. One such agent, azurin, a copper-containing, electron-transfer protein secreted by the opportunistic pathogen Pseudomonas aeruginosa, has significant anticancer activity in vitroCitation12–Citation15 and in vivo.Citation12,Citation14 The antiproliferative activity of azurin is based on the stabilization and subsequent increase in intracellular concentration of p53.Citation12–Citation15 A single-molecule atomic force spectroscopy (AFS) experiment has shown that a stable complex is formed between full-length p53 and azurin.Citation16 However, biological as well as computational studies have reported that azurin binds to either the NTD of p53Citation14,Citation17,Citation18 or its DBD.Citation14,Citation19,Citation20 Site-direct mutagenesisCitation12,Citation13,Citation15 and computational investigationsCitation20 have revealed that the two methionines, located at positions 44 and 64 within a hydrophobic patch of azurin are crucial for the interaction with p53.
Although azurin preferentially enters cancer relative to normal cells,Citation21 a 128-amino acid protein could display some immunogenicity, a potentially significant side effect, that compromises its pharmaceutical efficacy.Citation12 Since peptide fragments of azurin could provide therapeutic molecules with the same cytotoxicity, delivery, and target specificity of the whole protein, but with potentially fewer side effects, truncated versions of azurin have been investigated for anticancer activity. Amino acids 50–77 of azurin form a 2.9 kDa peptide fragment that encompasses the azurin α-helix and retains the preferential penetration of the whole protein, but also its antitumor activity in vitro and in vivo.Citation21–Citation24 The antiproliferative activity appears to result from aa residues 11–18 of p28 (61–69 of azurin) binding to p53 in a region that does not inhibit the binding of Mdm2 or subsequent ubiquitination.Citation23 Since the molecular details and the kinetics of its interaction with p53 and, more importantly, with what domain(s) have not yet been clarified, a detailed study of the p28–p53 interaction could provide significant information on p28 action at the molecular level.
In the present work, the kinetic properties of the interaction of p28 with the full-length p53 and its DBD and NTD at a single-molecule level were investigated by AFS, while the interaction with the CTD has been excluded on the basis of competition assays results.Citation23 AFS is an innovative nanotechnology, suitable for measuring intermolecular forces down to the piconewton range, at single-molecule resolution, in near-physiological conditions without any labeling and using an extremely low amount of substances. As such, it provided detailed information on the interaction strength and kinetics of these biomolecular partners, complementing traditional biochemical and molecular approaches.Citation25 The kinetic parameters determined from force spectroscopy experiments suggest a bio-recognition process occurs between p28 and the DBD of p53, while almost no interaction is registered with the NTD. This strongly suggests that p28 undergoes a specific interaction only with the DBD of p53 and provides a first look at the kinetics of the reaction that underlies the anticancer activity of p28.
Methods
Protein expression and purification
The human p53 gene encoding aa 1–93 was amplified by polymerase chain reaction (PCR) with pUC18p53, kindly provided by Professor Nobuo Tsuchida, Department of Molecular Cellular Oncology and Microbiology, Tokyo, Medical and Dental University. Primer set used was 5′-AAA GGG GGA TCC ATG GAG GAG CCG CAT CAG ATC CT-3′ and 5′-AAA AGG GAA TTC TCA CAG GGG CCA GGA GGA GGG-3′ (Genenco, Firenze, Italy). 10 pmol of each primer was added to 20 ng of template DNA and 12.5 mL of 23 PCR HotStartTaq™ mix (Qiagen, Hilden, Germany) in a final volume of 25 mL. The amplified fragment was digested by Bam HI and Eco RI (Invitrogen, Carlsbad, CA) and ligated into pGEX-2T vector in frame with the glutathione S-transferase (GST) gene sequence. The fusion protein, expressed in Escherichia coli BL21 cells transformed with the pGEX-2T (1–93) plasmid, was purified as previously described.Citation26
Also, purification of full-length p53 (aa 1–393) and its DBD (aa 94–288) followed a standard GST method. Briefly, E. coli BL21 DE3 having pGEX-4T-wtp53 or pGEX-4T- DBD-p53 plasmid DNA were grown at 37°C to optical density measured at a wavelength of 600 nm of 0.4. Bacteria were incubated for an additional 3 hours with 0.5 mM isopropyl-1-thio-β-galactopyranoside under vigorous shaking. Cells were lysed in phosphate-buffered saline (PBS) containing 0.1% Triton® X-100, 1 mM dithiothreitol (DTT), and protease inhibitors. After centrifugation, supernatant fractions were incubated with glutathione- Sepharose™ beads (G4510; Sigma, St Louis, MO). GST-fusion proteins were eluted with 50 mM Tris-HCl pH 8.0 containing 10 mM glutathione (G4251; Sigma) and 1 mM DTT, and incubated with either thrombin or Factor Xa protease (Amersham Biosciences, Piscataway, NJ). After incubation at room temperature for 16 hours, thrombin or Factor Xa protease was removed by P-aminobenzamidineagarose or anti-factor Xa-agarose beads (Sigma). GST-free p53 and its derivatives were dialyzed against storage buffer (50 mM Tris-HCl pH 7.5, 1 mM MgCl2, 0.5 mM DTT). The quality, correct folding, and purity of recombinant proteins were subsequently verified.Citation27
Tip functionalization
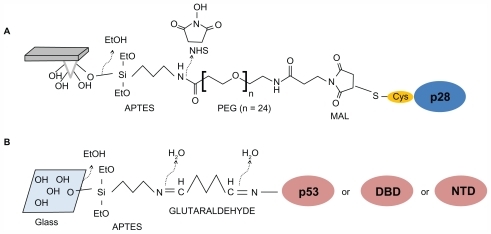
The 28-amino acid (LeuCitation50-Asp77, 2.9 kDa) fragment of azurin was anchored to the AFS silicon nitride cantilever (Veeco Instruments, Santa Barbara, CA) by means of a cysteine residue conjugated to the NH2-terminus to create p29 (Cys-p28, 3.0 kDa). The tips were cleaned in acetone for 10 minutes, dried with a stream of nitrogen, and ultraviolet (UV) irradiated for 30 minutes to expose hydroxyl groups. Tips were then immersed in a solution of 2% (v/v) 3-aminopropyl-triethoxysilane (APTES) (Acros Organics, Geel, Belgium) in chloroform, incubated for 2 hours at room temperature, rinsed in three changes of chloroform, and dried with nitrogen. Silanized tips were immersed in 1 mM N-hydroxysuccinimide-polyethylene glycolmaleimide (NHS-PEG-MAL), molecular weight 1395 Da, 9.5 nm in length (Thermo Scientific Inc, Waltham, MA) and dissolved in dimethylsulfoxide (DMSO) for 3 hours at room temperature. The PEG spacer contains an NHS-ester group at one end, which reacts with amino-silane molecule to form an amide bond and a maleimide group at the other end, which reacts with the sulfhydryl group of cysteine residue linked to the NH2-terminus of p28. Tips were then washed in three changes of DMSO to remove the unbound linker, rinsed with Milli-Q® (Millipore, Bellerica, MA) water, dried with nitrogen, then incubated with 50 μL of a 10 μM solution of p28 in 50 mM PBS pH 7.5 overnight at 4°C. The tips were then gently rinsed and stored in buffer at 4°C. A schematic representation of tip functionalization is shown in .
Figure 1 Immobilization strategies of peptide and proteins to the tip or substrate. (A) p28 is bound to the amino-silanized tip via a PEG crosslinker. (B) p53, or alternatively its DBD or NTD, is immobilized on glass slides via a chemical platform involving sequentially linked amino-silane and glutaraldehyde, thus targeting aminic groups of lysine residues exposed on the protein surfaces (see Materials and methods section for details).
Abbreviations: APTES, 3-aminopropyl-triethoxysilane; DBD, DNA-binding domain; MAL, maleimide; NTD, N-terminal domain; PEG, polyethylene glycol.
Preparation of the protein substrates
The full-length p53, its DBD, and its NTD, were individually immobilized on glass slides previously cleaned for 5 minutes in acetone, dried under a stream of nitrogen and then UV irradiated for 30 minutes. After immersion in 0.3 M APTES in chloroform and incubation for 3 minutes at room temperature, they were rinsed in three changes of chloroform and dried with nitrogen. The glass slides were subsequently incubated with a solution of 1% glutaraldehyde (Sigma-Aldrich, St Louis, MI) in Milli-Q water for 10 minutes at room temperature, rinsed carefully with Milli-Q water, and dried with nitrogen. Fifty μL of a 0.8 μM p53, p53 DBD or p53 NTD in 50 mM PBS pH 7.5 were poured onto this amine-reactive surface, incubated overnight at 4°C, gently washed with PBS, and stored in buffer at 4°C. A schematic representation of the substrate functionalization is shown in .
Atomic force microscopy (AFM) imaging and force spectroscopy
A Nanoscope IIIa/Multimode atomic force microscope (Digital Instruments, Santa Barbara, CA) was used to perform force spectroscopy. Imaging of full-length p53, p53 DBD, and p53 NTD substrates were imaged by tapping mode AFM, with an amplitude set point corresponding to the 95% of the free amplitude value. The cantilever nominal spring constant, knom, was 0.5 N/m. The substrate was scratched to get a qualitative indication about the protein monolayer height as described by Funari et al.Citation27
Force measurements were carried out in PBS buffer (50 mM K3PO4, 150 mM NaCl, pH 7.5) using force calibration mode AFM. The cantilevers used to perform force spectroscopy studies had a nominal spring constant, knom, of 0.01 N/m. The effective spring constant, keff, was determined by the procedure reported by Hutter and Bechhoefer. Citation28 A relative trigger of 50 nm was applied to limit the maximum contact force applied by the tip on the protein monolayer to 0.5 nN. A ramp size of 150 nm was set, and an encounter time of 100 ms established. The approach velocity was set at a value of 50 nm/s, with the retraction velocity increased from 50 to 4190 nm/s. Loading rate, defined as r = dF/dt, was determined according to the relationship r = dF/dt = kv, where k is the cantilever spring constant. Correspondingly, the nominal loading rate, obtained by using the nominal spring constant, knom, was found in the range 0.5–42 nN/s. The effective loading rate was determined by replacing the nominal cantilever constant with the effective one, ksys, to take into account that molecules (ie, proteins and/or linkers) tied to an AFM tip make the cantilever spring constant change. The ksyst values were obtained from the slope of each retraction curve immediately prior to the unbinding event.Citation29–Citation31 All blocking experiments were conducted at the nominal loading rate of 7 nN/s.
Results
Interaction of p28 with full-length p53
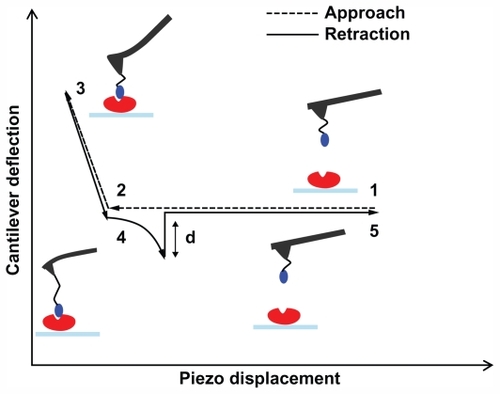
All experiments were performed using AFS, a single-molecule technique that complements traditional proteomic and molecular biology approaches for the functional analysis of biorecognition events.Citation25,Citation32 In a typical AFS experiment, a ligand is anchored to the AFS tip while the receptor is immobilized onto a substrate. Force–distance curves are thus performed cyclically on the tethered system, as sketched in and described in the legend. Briefly, the tip is approached to the substrate until the ligand and the receptor are brought into close proximity and can interact to form a complex. The cantilever then retracts from the surface, and when the force that it exerts overcomes the stability of the complex bonds, a sudden jump in the deflection occurs as a consequence of the complex dissociation.
Figure 2 Schematic representation of a force–distance cycle carried out in the atomic force spectroscopy experiment. A ligand-functionalized tip is approached to a surface covered by immobilized receptor (point 1); the cantilever begins to deflect upward due to the ligand–receptor intermolecular repulsive forces (point 2); the two partners can interact, and when the cantilever applies the maximum contact force upon the substrate, the approaching phase is stopped (point 3); the cantilever begins to retract, reaches the baseline deflection and begins to bend downward due to the attractive interaction force displayed by the ligand–receptor complex (point 4); when the force exerted by the cantilever overcomes the stability of the complex bonds, the cantilever jumps off, returning to its initial position (point 5). See Funari et alCitation27 for a detailed description.
Hence, one key requisite to investigate ligand–receptor interaction by AFS is a robust attachment of ligand and receptor on their respective AFM supports, preferably through covalent bonds, which are generally stronger than those characterizing protein–protein interaction.Citation25,Citation33 Strong immobilization of the two partners ensures the stability of the tethered system over time allowing repeated approach/retraction cycles. In this respect, the NH2-terminal of p28 is conjugated to a cysteine residue whose SH group reacts with the MAL group of a flexible 9.5 nm-long PEG polymer covalently linking the p28 peptide to the AFS tip (). The linker increases the flexibility and the re-orientation freedom of the peptide when the AFM tip approaches the protein monolayer. This favors the bio-recognition process.Citation34 Moreover, during the tip-retraction, the linker undergoes a stretching process whose unique features assist in discriminating specific and nonspecific unbinding events.Citation25,Citation33
Full-length p53 molecules are immobilized on a glass slide by targeting the amine groups of the lysine residues exposed on the protein surface (). The presence of several lysine residues available for the reaction is susceptible to generate statistically random orientations of the proteins on the substrate. This immobilization strategy could generate some configurations that might result unfavorably for the bio-recognition event (see below).
Before proceeding with AFS measurements, the morphology of p53 proteins immobilized on the glass slides were analyzed by imaging AFM using a bare tip. The presence of a homogenous layer of p53 with discernible single proteins was observed. To verify the presence of a monolayer and define its height, a bare tip was thus used to scratch the substrate, working in contact mode as described in Funari et alCitation27 (results not shown).
With a functionalized tip thousands of force curves were thus recorded on such a substrate with an intermediate degree of coverage (condition also suggested by Gilbert et al),Citation35 at several distinct points in which a corresponding percentage of specific events were observed. The approach speed was kept constant while the retraction one, v, was varied from 50 to 4190 nm/s.
As collected force curves can significantly differ in AFS unbinding experiments in the single molecule regime,Citation25,Citation32 force curves were accepted whose retraction portion, before the jump-off, exhibited a nonlinear trend starting and ending at the zero-deflection line where the nonlinear trend is attributed to the viscoelastic properties of the PEG linker under stretching.Citation36,Citation37 When multiple jumps were observed, which could be due to subsequent rupture of the complex bonds, the curves were accepted if the last jump started and ended at zero deflection, with the last jump taken as representative of the unbinding process.
The unbinding frequency, defined as the ratio between the number of accepted unbinding events and total number of the collected force curves, was found to be about 20% at a loading rate of 7 nN/s. This frequency could potentially be affected by the presence of unfavorable binding geometries and by steric hindrance.Citation16,Citation27,Citation38 However, studying the frequency of unbinding as a function of the surface coverage, no significant change was found. The relatively low unbinding frequency, detected even when specific interaction occurs, was thus to be ascribed to the random orientation resulting from the immobilization strategy. Interestingly, the unbinding frequency, observed to be consistent with values previously reported for other biological interactions,Citation27,Citation39,Citation40 was dependent on the loading rate, initially increasing, reaching a maximum, and decreasing as previously described.Citation27
As the unbinding force for each curve is the product of cantilever deflection (d, ) and its effective spring constant (keff), force histograms correspond to the different loading rates at which force spectroscopy measurements were conducted. Working on the chosen intermediate substrate coverages, the histograms of the unbinding forces, ie, at a loading rate of 7 nN/s (), exhibit essentially a single mode distribution, slightly skewed toward high force values. The asymmetric shape, similar to that observed in other systems, could be due to some factors such as the heterogeneity in chemical bonds or spacer length, or a residual occurrence of a few multiple binding events.Citation39,Citation41,Citation42 On this basis, in this present study, the most probable unbinding force was determined from the maximum of the main peak of each histogram. At a loading rate of 7 nN/s, an unbinding force value of 82 pN was found (), which falls within the range reported for other specific biological interactions at similar loading rates.Citation43 Also found was that the unbinding force values and the widths of their corresponding distributions increased with an increase in loading rate, as reported previously.Citation16,Citation27,Citation44
Figure 3 (A) Histograms of the unbinding forces for the p28/p53 complex before and after blocking. The most probable unbinding force value was determined from the maximum of the main peak of the histogram before blocking. All measurements were performed at a loading rate of 7 nN/s. (B) Histogram of the unbinding lengths for the p28/p53 complex, evaluated for the same collection of force curves as in (A). The continuous line is the fit by a Gaussian centered at 12 nm and with a standard deviation of 5.6 nm.
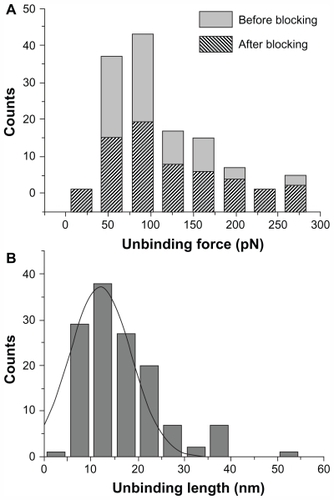
Blocking experiments on the p28/p53 complex demonstrated that the observed unbinding events arise from a specific recognition process. Indeed, after incubation of the p53-functionalized substrate with 30 μM free p28, the unbinding frequency was reduced about 55%, indicating formation of a p28/p53 complex was specific. Upon increasing the concentration of the blocking agent, a higher attenuation was not registered. The persistence of residual unbinding activity after blocking has also been reported for other force spectroscopy experiments and could be related to the forced interaction between the two partners, induced by the experimental design.Citation45 Importantly, the similarity in force histograms before and after blocking (see ) indicates the corresponding interactions may be similar. The specificity of the p28/p53 interaction was further verified by distribution analysis of the linker extension from zero distance to the position of the complex rupture in a force-distance curve. The unbinding length distribution exhibited a single-mode distribution centered at 12.0 nm with a standard deviation of 5.6 nm (), which is in good agreement with the extension expected from the stretching of the 9.5 nm long PEG during the unbinding process.Citation45 The unbinding process which the p28/p53 complex undergoes under the influence of an external loading force can be treated within the theoretical context of the Bell- Evans model.Citation46,Citation47 According to this model, the application of an external force (F) modifies the energy profile of the unbinding process, lowering the activation energy barrier, resulting in an exponential increase of the dissociation rate constant koff(F) with the applied force
where koff(F) and koff are the dissociation rate constant in the presence of and without any applied force, respectively, xβ is the width of the potential barrier along the direction of the applied force, kB is Boltzmann’s constant, and T is the absolute temperature.
Assuming that the applied force F increases linearly with a constant loading rate r, the most probable unbinding force, F*, at a fixed value of loading rate is given by:
This expression predicts a linear relationship between the most probable unbinding force, F*, and the natural logarithm of the effective loading rate r. F* has been determined from the maximum of the main peak of each unbinding force histogram, and r is given by the product between the retraction velocity and the spring constant of the entire system, ksyst, determined from the slope of the force versus distance for each retraction curve, as described in the Methods section.
Therefore, by plotting F* versus the natural logarithm of the effective loading rate r, the kinetic parameters koff and xβ can be obtained from the slope and intercept of a linear fit. shows the dynamic force spectrum obtained by fitting the plot of F* versus log (r) with EquationEquation 2(2) . The spectrum shows, in the range of loading rates under consideration, a single regime indicative of a single energy barrier and unique transition state of the reaction and provided values of 0.47 ± 0.02 nm for xβ and 0.13 ± 0.03 s−1 for koff. The association rate constant (kon) for the p53/p28 complex has been estimated from the expression kon = NAVeff/t0.5, where NA is the Avogadro’s number, Veff is the effective volume of a half-sphere with radius reff around the tip, and t0.5 is the time for the half-maximal binding probability, given by t0.5 = 2 reff/v, where v is the approach speed of the cantilever.Citation16,Citation45 To estimate t0.5, the interaction time between the proteins was varied during the force distance cycles, and an exponential increase was observed in the unbinding frequency with contact time, until a plateau was reached. A t0.5 of 0.05 seconds was found, and then, by assuming a reff of 4 nm, a kon = 1.8 × 10⁴ M−1 s−1 was obtained. The dissociation constant (KD = koff/kon) for the complex between p53 and p28 was about 7 × 10⁻⁶ M. Interestingly, KD is located in an “affinity region” between the transient azurin/cytochrome c551 complex (KD in the range of 10−4–10−6 M) and that reported for antigen/antibody pairs (KD in the order of 10−7–10−11 M).Citation38
Figure 4 Plot of the unbinding forces versus the logarithm of the loading rates for the p28/p53 interaction. Statistical errors are given by standard deviation. The line is obtained by fitting the experimental data by the Bell-Evans model (EquationEquation 2(2) ).
Abbreviations: koff, dissociation rate constant; F*, the most probable unbinding force; xβ, width of the potential barrier along the direction of the applied force.
 ).Abbreviations: koff, dissociation rate constant; F*, the most probable unbinding force; xβ, width of the potential barrier along the direction of the applied force.](/cms/asset/4d5c9b04-b830-4d68-8ac1-c922baccb4f3/dijn_a_26155_f0004_b.jpg)
Interaction of p28 with the p53 DBD and NTD
The single-molecule interaction of the p28 peptide fragment of azurin with the DBD and NTD of p53 was studied. The experiments (substrate coverage, immobilization strategies, and sampling procedures) were conceived in order that the AFS results could be comparable for the different proteins immobilized on the substrate on a statistical basis. As already mentioned, the interaction with the p53 CTD has not been investigated, since competition assays with p53 site-specific antibodies demonstrate that p28 has no contact with p53 CTD aa residues.Citation23
Concerning the p28/DBD interaction, at a loading rate of 7 nN/s, an unbinding frequency of about 25% was obtained. The most probable unbinding force, extracted from the maximum of the main peak of the unbinding forces histogram (), was 95 pN. The unbinding frequency and unbinding force values are slightly higher than those corresponding to the p28/p53 interaction. Blocking by incubation of the DBD-functionalized substrate with 30 μM free p28 produced a 60% reduction in the unbinding frequency (), indicative of the specificity of the p28/DBD complex. The force histograms, before and after blocking, also show a similar distribution. The specificity of the p28/DBD interaction is also observed in the unbinding lengths, which show a single-mode distribution centered at 12.1 nm and with a standard deviation of 3.7 nm (). Measurement of highly probable unbinding forces over the range of five loading rates investigated (from 0.5 to 42.0 nN/s) and application of EquationEquation 2(2) led to the linear plot shown in from which an xβ of 0.46 ± 0.05 nm and a koff of 0.012 ± 0.006 s−1 were extracted. While the xβ value is essentially comparable to that calculated for the p28/p53 complex, the koff value is, remarkably, one order of magnitude lower and displays a much higher spread. On the other hand, the association rate constant, kon, for the p28/DBD complex, measured as previously described, is 1.9 × 10⁴ M−1 s−1, close to that of the p28/p53 interaction. The kon and koff values yielded for the p28/DBD complex a KD of 6.3 × 10⁻⁷ M.
Figure 5 (A) Histograms of the unbinding forces for the p28/DBD complex before and after blocking. The most probable unbinding force value was determined from the maximum of the main peak of the histogram before blocking. All measurements were performed at a loading rate of 7 nN/s. (B) Histogram of the unbinding lengths for the p28/DBD interaction, evaluated for same collection of force curves as in (A). The continuous line is the fit by a Gaussian centered at 12.1 nm and with a standard deviation of 3.7 nm.
Figure 6 Plot of the unbinding forces versus the logarithm of the loading rates for the p28/DBD complex. Statistical errors are given by standard deviation. The line is obtained by fitting the experimental data by the Bell-Evans model (EquationEquation 2(2) ).
Abbreviations: DBD, DNA-binding domain; koff, dissociation rate constant; F*, the most probable unbinding force; xβ, width of the potential barrier along the direction of the applied force.
 ).Abbreviations: DBD, DNA-binding domain; koff, dissociation rate constant; F*, the most probable unbinding force; xβ, width of the potential barrier along the direction of the applied force.](/cms/asset/bbe27a54-d8a0-452c-88b9-51b07e7fcb78/dijn_a_26155_f0006_b.jpg)
Abbreviation: DBD, DNA-binding domain.
 ).Abbreviations: DBD, DNA-binding domain; koff, dissociation rate constant; F*, the most probable unbinding force; xβ, width of the potential barrier along the direction of the applied force.Display full sizeAbbreviation: DBD, DNA-binding domain.](/cms/asset/ce8cbb39-3e25-49fe-af73-44d4452634b8/dijn_a_26155_f0005_b.jpg)
The same experimental approach used to study the p28/p53 and p28/DBD interaction, was used to investigate the possible interaction of p28 with the NTD of p53. p28 was anchored to the AFS silicon nitride tip, while the NTD was immobilized on a glass slide (). The corresponding force curves were recorded maintaining a constant forward velocity and varying the retraction speed from 50 to 4190 nm/s. At a loading rate of 7 nN/s, there was minimal number of unbinding events which yielded a negligible unbinding frequency. Since the observed events were not statistically significant, it is reasonable to assert that there is no specific interaction between p28 and the NTD.
Discussion
The specific interaction of the azurin-derived peptide, p28, with full-length p53, its DBD, and its NTD was investigated for the first time at a single-molecule level by means of AFS. The technique enabled the strength and kinetics of complexes to be probed under the application of an external force, under nearly native conditions, and without any labeling. The AFS approach revealed that a specific interaction occurs between p28 and p53, leading to the formation of a stable complex. Interestingly, the unbinding force, dissociation constant, and kinetic parameters of the complex are comparable to those measured by AFS for the p53 interaction with azurin, to which p28 belongs.Citation16
The interaction of p28 with full-length p53 appears confined to the DBD core domain through formation of a stable complex. Interestingly, it was found that the lifetime τ (τ = 1/koff) of the DBD/p28 complex is ten times longer than that of the p28–p53 association, probably as a consequence of the DBD tendency to form aggregatesCitation48 that could wrap p28 and exert a steric hindrance to its exit from the complex. The possible DBD aggregation, however, seems not to affect the association phase of the interaction as the similar kon calculated for the DBD-p28 and p53-p28 complexes suggest.
The finding of a specific and stable p28–DBD interaction points out more precisely which region of full-length p53 is involved in the interaction with p28, with respect to what has been previously reported in in-vitro studies.Citation23 In addition, the results are in line with those of a computational docking study predicting that p28 and the DBD of p53 undergo a molecular association characterized by low, negative binding free energy,Citation49 high shape complementarity, and several hydrogen bonds at the interface. Indeed, in that study the best predicted complex between DBD and p28 has been shown to involve the DBD aa residues 96–103, just close to its S1 strand and, at least in part, its L2 loop (aa 164–170).
The occurrence of a stable complex between the DBD and p28 suggests that the p28 anticancer activity may be related to its ability to inhibit the binding of E3 ligases, other than Mdm2, ie COP1, Pirh2, and perhaps TOPORS and ARF-BP1Citation50–Citation52 to the DBD, and reduce the proteasomal degradation of p53. In this respect, competitive assays of the DBD–p28 interaction by using these ligases, would provide significant insight into the p28 mechanism of action.
The DBD is not only involved in the control of the p53 downregulation, but it is above all, the domain necessary for the binding of the tumor suppressor to DNA. Since mutations within the DBD are often connected with p53 loss of function and subsequent tumor proliferation, it could be interesting to investigate the possibility that p28 could interact with mutated forms of DBD and enhance apoptosis. Here, p28 could potentially produce a conformational reversion of mutant p53, reactivating its wild-type function.
Acknowledgment
This work was partly supported by a grant from the Italian Association for Cancer Research (AIRC No IG 10412).
Disclosure
The authors report no conflicts of interest in this work.
References
- LavinMFGuevenNThe complexity of p53 stabilization and activationCell Death Differ20061394195016601750
- OrenMDecision making by p53: life, death and cancerCell Death Diff200310431442
- KoLJPrivesCp53: puzzle and paradigmGenes Develop199610105410728654922
- LevineAJp53, the cellular gatekeeper for growth and divisionCell1997883233319039259
- BrooksCLGuWUbiquitination, phosphorylation and acetylation: the molecular basis for p53 regulationCurr Opin Cell Biol20031516417112648672
- MomandJZanbettiGPOlsonDCGeorgeDLevineAJThe Mdm2 oncogene product forms a complex with the p53 protein and inhibits p53-mediated transactivationCell199269123712451535557
- RothJDobbelsteinMFreedmanDAShenkTNucleo-cytoplasmic shuttling of the hdm2 oncoprotein regulates the levels of the p53 protein via a pathway used by the human immunodeficiency virus rev proteinEMBO J199825545649430646
- HondaRTanakaHYasudaHOncoprotein Mdm2 is an ubiquitin ligase E3 for tumor suppressor p53FEBS Lett199742025279450543
- MollUMPetrenkoOThe MDM2-p53 interactionMol Cancer Res200311001100814707283
- KleinCVassilevLTTargeting the p53-MDM2 interaction to treat cancerBr J Cancer2004911415141915452548
- BossiGSacchiARestoration of wild-type p53 function in human cancer: relevance for tumour therapyHead & Neck20072927228417230559
- YamadaTGotoMPunjVZaborinaOThe bacterial redox protein azurin induces apoptosis in J774 macrophages through complex formation and stabilization of the tumor suppressor protein p53Infect Immun2002707054706212438386
- GotoMYamadaTKimbaraKInduction of apoptosis in macrophages by Pseudomonans Aeruginosa azurin: tumour-suppressor protein p53 and reactive oxygen species, but not redox activity, as critical elements in cytotoxicityMol Microbiol20034754955912519204
- PunjVBhattacharyyaSSaint-DicDBacterial cupredoxin azurin as an inducer of apoptosis and regression in human breast cancerOncogene2004232367237814981543
- YamadaTHiraokaYIkehataMApoptosis or growth arrest: modulation of tumor suppressor p53’s specificity by bacterial redox protein azurinProc Natl Acad Sci U S A20041014770477515044691
- TarantaMBizzarriARCannistraroSProbing the interaction between p53 and the bacterial protein azurin by single molecule force spectroscopyJ Mol Recognit200821637018247358
- ApiyoDWittung-StafshedePUnique complex between bacterial azurin and tumor-suppressor protein p53Biochem Biophys Res Commun200533296596815913547
- TarantaMBizzarriARCannistraroSModelling the interaction between the N-terminal domain of the tumor suppressor p53 and azurinJ Mol Recognit20092221522219140135
- BizzarriARDi AgostinoSAndolfiLCannistraroSA combined atomic force microscopy imaging and docking study to investigate the complex between p53 DNA binding domain and azurinJ Mol Recognit20092250651519642109
- De GrandisVBizzarriARCannistraroSDocking study and free energy simulation of the complex between p53 DNA-binding domain and AzurinJ Mol Recognit20072021522617703463
- YamadaTFialhoAMPunjVBratescuLDas GuptaTKChakrabartyAMInternalization of bacterial redox protein azurin in mammalian cells: entry domain and specificityCell Microbiol200571418143116153242
- TaylorBNMehtaRYamadaTNoncationic peptides obtained from azurin preferentially enter cancer cellsCancer Res20096953754619147567
- YamadaTMehtaRLekmineFA peptide fragment of azurin induces a p53-mediated cell cycle arrest in human breast cancer cellsMol Cancer Ther200982947295819808975
- MehtaRRHawthorneMPengXA 28-amino-acid peptide fragment of the cupredoxin azurin prevents carcinogen-induced mouse mammary lesionsCancer Prev Res2010313511360
- BizzarriARCannistraroSThe application of atomic force spectroscopy to the study of biological complexes undergoing a biorecognition processChem Soc Rev20103973474920111790
- RigacciSBucciantiniMReliniAThe (1–63) region of the p53 transactivation domain aggregates in vitro into cytotoxic amyloid assembliesBiophys J2008943635364618199664
- FunariGDomeniciFNardinocchiLInteraction of p53 with Mdm2 and azurin as studied by atomic force spectroscopyJ Mol Recogn201023343351
- HutterJLBechhoeferJCalibration of atomic-force microscope tipsRev Sci Instrum19936418681873
- FriedsamCWehleAKKuhnerFGaubHEDynamic single molecule force spectroscopy: bond rupture analysis with variable spacer lengthJ Phys Cond Matt200315S17091723
- RayCBrownJRAkhremitchevBBCorrection of systematic errors in single-molecule force spectroscopy with polymeric tethers by atomic force microscopyJ Phys Chem B20071111963197417284065
- De ParisRStrunzTOroszlanKGuntheroldHJHegnerMForce spectroscopy and dynamics of the biotin-avidin bond studied by scanning force microscopySingle Mol20001–4285290
- BizzarriARCannistraroSAtomic force spectroscopy in biological complex formation: strategies and perspectivesJ Phys Chem B2009113164491646419904973
- HinterdorferPDufrêneYFDetection and localization of single molecular recognition events using atomic force microscopyNature Meth20063347355
- FriddleRWSulchekTAAlbrechtHDe NardoSJNoyACounting and breaking individual biological bonds: force spectroscopy of tethered ligand-receptor pairsCurr Nanosci200734148
- GilbertYDeghorainMWangLSingle-molecule force spectroscopy and imaging of the Vancomycin/D-Ala-D-Ala interactionNano Lett2007779680117316058
- KienbergerFPastushenkoVPKadaGStatic and dynamical properties of single poly (ethylene glycol) molecules investigated by force spectroscopySingle Mol20001123128
- ThormannEHansenPLSimonsenACMouritsenOGDynamic force spectroscopy on soft molecular systems: improved analysis of unbinding spectra with varying the linker complianceColl Surf B:Bioint200653149156
- BonanniBKamruzzahanSMBizzarriARSingle molecule recognition between cytochrome c 551 and gold-immobilized azurin by force spectroscopyBiophys J2005892783279116192283
- SulchekTAFriddleRWLangryKDynamic force spectroscopy of parallel individual Mucin-1-antibody bondsProc Natl Acad Sci U S A2005102166381664316269547
- FuhrmannAAnselmettiDRosRGetfertSReimannPRefined procedure of evaluating experimental single-molecule force spectroscopy dataPhys Rev E Stat Nonlin Soft Matter Phys2008773 Pt 103191218517427
- BaumgartnerWHinterdorferPNessWCadherin interaction probed by atomic force microscopyProc Natl Acad Sci U S A2000974005401010759550
- RattoTVLangryKCRuddREBalhornRLAllenMJMcElfreshMWForce spectroscopy of the double-tethered concanavalin A mannose bondBiophys J2004862430243715041680
- MorfillJBlankKZahndCAffinity-matured recombinant antibody fragments analyzed by single-molecule force spectroscopyBiophys J2007933583359017675348
- JanshoffASteinemCEnergy landscapes of ligand-receptor couples probed by dynamic force spectroscopyChem Phys Chem20012577579
- HinterdorferPBaumgartnerWGruberHJSchilcherKSchindlerHDetection and localization of individual antibody-antigen recognition events by atomic force microscopyProc Natl Acad Sci U S A199693347734818622961
- BellGIModels for the specific adhesion of cells to cellsScience1978200618627347575
- EvansERitchieKDynamic strength of molecular adhesion bondsBiophys J199772154115559083660
- BullockANHenckelJDeDeckerBSThermodynamic stability of wild-type and mutant p53 core domainProc Natl Acad Sci U S A19979414338143429405613
- SantiniSBizzarriARCannistraroSModelling the interaction between the p53 DNA-binding domain and the p28 peptide fragment of azurinJ Mol Recognit2011241043105722038811
- ChenDKonNLiMZhangWQinJGuWARF-BP1/Mule is a critical mediator of the ARF tumor suppressorCell20051211071108315989956
- RajendraRMalegaonkarDPungaliyaPTopors functions as an E3 ubiquitin ligase with specific E2 enzymes and ubiquitinates p53J Biol Chem2004279364403644415247280
- CorcoranCHuangYSheikhMThe p53 paddy wagon: COP1, Pirh2 and MDM2 are found resisting apoptosis and growth arrestCancer Biol Ther2004372172515280670