 ?Mathematical formulae have been encoded as MathML and are displayed in this HTML version using MathJax in order to improve their display. Uncheck the box to turn MathJax off. This feature requires Javascript. Click on a formula to zoom.
Abstract
Background
Advances in biomedical nanotechnology raise hopes in patient populations but may also raise questions regarding biodistribution and biocompatibility, especially during pregnancy. Special consideration must be given to the placenta as a biological barrier because a pregnant woman’s exposure to nanoparticles could have significant effects on the fetus developing in the womb. Therefore, the purpose of this study is to optimize an in vitro model for characterizing the transport of nanoparticles across human placental trophoblast cells.
Methods
The growth of BeWo (clone b30) human placental choriocarcinoma cells for nanoparticle transport studies was characterized in terms of optimized Transwell® insert type and pore size, the investigation of barrier properties by transmission electron microscopy, tight junction staining, transepithelial electrical resistance, and fluorescein sodium transport. Following the determination of nontoxic concentrations of fluorescent polystyrene nanoparticles, the cellular uptake and transport of 50 nm and 100 nm diameter particles was measured using the in vitro BeWo cell model.
Results
Particle size measurements, fluorescence readings, and confocal microscopy indicated both cellular uptake of the fluorescent polystyrene nanoparticles and the transcellular transport of these particles from the apical (maternal) to the basolateral (fetal) compartment. Over the course of 24 hours, the apparent permeability across BeWo cells grown on polycarbonate membranes (3.0 μm pore size) was four times higher for the 50 nm particles compared with the 100 nm particles.
Conclusion
The BeWo cell line has been optimized and shown to be a valid in vitro model for studying the transplacental transport of nanoparticles. Fluorescent polystyrene nanoparticle transport was size-dependent, as smaller particles reached the basal (fetal) compartment at a higher rate.
Introduction
Advances in nanotechnology are starting to have an impact in the biomedical and industrial fields. These advances raise hopes in patient populations regarding improved specificity and lower doses, but may raise concerns in environmental and occupational fields due to a lack of toxicity studies and other unwanted side effects. Particles with dimensions ranging from tens to hundreds of nanometers have unique characteristics that may be distinct from bulk material properties. The increased relative surface area of nanoparticles (NPs) compared to fine and ultrafine particle bulk material can lead to changes in physical, chemical, mechanical, thermal, electrical, magnetic, and luminescent properties.Citation1 To appropriately estimate risks and to provide the public with confidence in safety assessment for new technologies, the implementation of uniform protocols and integrated testing standards is imperative.Citation2 These assessments should answer questions regarding both the biodistribution and the biocompatibility of NPs as well as potential adverse effects such as genotoxicity, oxidative stress induction, and inflammation.
Amongst the various biological barriers in the human body, special consideration must be given to the placenta, because a pregnant woman’s exposure to NPs could have significant effects on the fetus developing in the womb.Citation3 While there is still much to be learned in this field, the first studies indicate that the physical and chemical nature of the particle is an important determinant. Myllynen et al recently demonstrated that polyethylene glycol (PEG)ylated gold NPs between 10 nm and 30 nm diameter did not pass into the fetal perfusate in perfused human placenta experiments;Citation4 however, using a similar experimental model, Wick et al showed that the transport of fluorescently labeled polystyrene beads of 50 nm and 240 nm diameter is size dependent.Citation5
The placenta serves as the interface regulating the transfer of oxygen, nutrients, and waste products between the maternal and fetal circulations. When exogenous substances are present in the maternal bloodstream, whether from environmental contact, occupational exposure, medication, or drug abuse, the extent to which this exposure affects the fetus is determined by transport processes in the placental barrier. Inside the placenta, fetal blood vessels from the umbilical cord branch out in the formation of villous trees within cotyledons, or placental lobes. A placenta usually has between 20 and 30 cotyledons at full-term. Maternal blood moves through the intervillous space and three layers separate the maternal and fetal blood flows: syncytiotrophoblast cells, connective tissue, and fetal vascular endothelium.Citation6
Several experimental models have been implemented to study the disposition of substances across the human placenta, including cell lines, primary cultured cells, villous explants, isolated membrane vesicles, and the dually perfused placental cotyledon.Citation7–Citation9 The trophoblast cell layer is the rate-limiting barrier for drug and nutrient exchange between mother and fetus, and the human choriocarcinoma trophoblastic BeWo cell line is an established in vitro model for placental transport studies of soluble material.Citation10 Although this model does not constitute a complete physiological system and the entire tissue microenvironment found in humans in vivo, it does represent the rate-limiting barrier of maternal-fetal exchange, irrespective of the transport mechanism through the cell layers. Due to interspecies differences in placental structure, it cannot be assumed that observations in animal placentae are directly translatable to humans;Citation11 therefore, this work has focused on a model of human origin. The transplacental transport of caffeine, benzoic acid, glyphosate, and antipyrine was recently compared in in vitro BeWo cells and in ex vivo human placental perfusion experiments, and excellent correlation between the results was observed.Citation11 A similar correlation has also been observed for two polychlorinated biphenyls, PCB-52 and PCB-180.Citation12 Additional examples of agreement between in vitro results from the BeWo cell model and clinical effects in vivo have been reported previously.Citation13,Citation14 It should be noted that in contrast to the original American Type Culture Collection (Manassas, VA) BeWo cell line, the b30 BeWo clone forms confluent monolayers suitable for transport studies.Citation15
Fluorescent polystyrene NPs have been employed in a number of scientific studies due to their similarities in size and zeta potential properties when compared to biocompatible polymeric particles proposed for biomedical diagnostic and drug delivery applications.Citation16 For example, fluorescent polystyrene NPs have been investigated in relation to aspiration into the airways of rats,Citation17 mucociliary clearance,Citation16 transport across rat and human pulmonary epithelial cells,Citation18 intravenous injection in rats,Citation17 distribution in the skin,Citation18,Citation19 uptake in rat and human hepatocytes,Citation20 uptake in HeLa cells,Citation21 disposition in periocular and ocular rat tissue following sub-conjunctival injection,Citation22 and injection into extraembryonic mouse tissue.Citation23
In this work, we investigate the uptake and transport of fluorescent polystyrene NPs in BeWo b30 cells following model optimization specific to the application of NPs. The BeWo cell model has long been utilized for placental transport,Citation24 uptake,Citation13 efflux,Citation25 and expression studies;Citation10 however, we present a series of optimization procedures enabling the application of BeWo cells to transplacental NP transport experiments, thereby developing the use of this model beyond its conventional use with only soluble materials. The uptake of gold NPs was previously studied using the original (American Type Culture Collection) BeWo clone,Citation4 and the BeWo b30 clone has been utilized within an elaborate model to show indirect effects of cobalt-chromium NPs on fibroblast cells cultured behind a BeWo cell layer even though these particles did not traverse the BeWo cell barrier.Citation26
Materials and methods
Materials
Transwell® (Sigma-Aldrich, St Louis, MO) 12-well plates, 12 mm diameter, polyester and polycarbonate 3 μm and 0.4 μm pore size (Appleton Woods Ltd, Birmingham, UK); Fluoresbrite® polystyrene latex NPs, 37 nm and 200 nm (Polysciences Inc, Northampton, UK) and 50 nm and 100 nm particles (Polysciences Inc, Warrington, PA); Dulbecco’s modified Eagle medium/nutrient F-12 Ham (DMEM-F12) with phenol red, supplemented with 1% (v/v) L-glutamine-penicillin- streptomycin (PSLG), 1% (v/v) amphotericin B solution (AmpB); and 10% (v/v) fetal bovine serum (FBS) (Sigma-Aldrich, Dorset, UK). For transport studies using Fluoresbrite particles, DMEM-F12 without phenol red (Sigma-Aldrich, Irvine, Ayrshire, UK) supplemented with 10% (v/v) FBS (In Vitro, Fredensborg, Denmark), 1% (v/v) penicillin/streptomycin (Panum Institute, University of Copenhagen, Denmark) and 4 mM glutamine (In Vitro) was used, to avoid interference with optical absorbance; Hank’s balanced salt solution (HBSS), 4% (v/v) formaldehyde, dimethyl sulfoxide and 3-(4,5-Dimethylthiazol-2-yl)-2,5-diphenyltetrazolium bromide (MTT) assay (Sigma-Aldrich, Irvine, Ayrshire, UK); fluorescein sodium salt (Na-Flu), paraformaldehyde (PFA), Triton X-100 (Sigma-Aldrich, Dorset, UK), trypsin-ethylenediaminetetraacetic acid (EDTA; US Food and Drug Administration, Silver Spring, MD) and horse and goat sera (Sigma-Aldrich, Dorset, UK); primary polyclonal rabbit anti-human ZO-1 antibody (Zymed, South San Francisco, CA); Alexa Fluor® 488 donkey antirabbit secondary antibody (Invitrogen, Paisley, UK); phalloidin (Sigma-Aldrich, Dorset, UK); VECTASHIELD mounting medium with 4′,6-diamidino-2-phenylindole (DAPI) (Vector Laboratories Ltd, Peterborough, UK) for monolayer confirmation or VECTASHIELD mounting medium (Vector Laboratories Ltd, Burlingame, CA) for NP transport and uptake study; lysis solution (0.5% Triton X-100 in 0.2 M NaOH) (VWR, Herlev, DK).
Cell culture
The choriocarcinoma cell line BeWo b30 was obtained from Professor Harry McArdle (Rowett Research Institute, Aberdeen, UK) with permission from Dr Alan Schwartz (Washington University, St Louis, MO). Cells were cultured at 37°C with 5% CO2 in a humidified atmosphere in supplemented DMEM-F12 with phenol red. Experiments were conducted using this media, unless otherwise stated. At confluence the cells were subcultured using trypsin-EDTA solution.
Model optimization
Nanoparticle adherence to Transwell membranes
To determine adsorption of the NPs to polycarbonate (PC) or polyester (PE) Transwell membranes with 0.4 μm or 3 μm diameter pores, membranes were exposed (in the absence of cells) to Fluoresbrite latex NPs for up to 6 hours to mimic experimental transport conditions. Fluoresbrite NPs of 37 nm and 200 nm diameter were used at nominal concentrations of 9.3 × 10¹³ particles/mL and 6.2 × 10¹¹ particles/mL, respectively. Dispersion in DMEM-F12 medium without phenol red was achieved by vortexing for 1 minute and subsequent incubation for 10 minutes in a sonicating water bath (MXB6, Grant Scientific, Shepreth, Cambridgeshire, UK), followed by vortexing for 1 minute. Initial particle characterization studies had demonstrated that 100 nm Fluoresbrite nanosuspensions at a nominal concentration of 1 mg/mL (1.8 × 10¹² particles/mL) in DMEM containing 10% FBS were stable, showing no agglomeration or precipitation. Fluoresbrite particles dispersed in 0.5 mL of medium were added to the apical chamber of the Transwell and 1.5 mL phenol red-free medium was added to the basal chamber. Plates were incubated at 37°C and 5% CO2 to mimic experimental conditions. Samples of 50 μL were taken in triplicate from the basal chamber into a black 96-well plate (Corning, New York, NY) at 5- and 30-minute, and 1-, 2-, 4-, and 6-hour intervals and read at excitation 485 nm and emission 520 nm on a FluoSTAR OPTIMA fluorescence microplate reader (BMG Labtech, Aylesbury, UK). After 6 hours, membranes were removed and mounted for imaging. The degree of fluorescent particle adherence to the membrane was observed using a Leica™ SP5 confocal (Wetzlar, Germany) attached to a Leica DMI 6000 inverted microscope and a 63× (1.4NA) oil-immersion objective. Imaging parameters were selected to optimize resolution and images were acquired with Leica confocal software.
Monolayer characterization
BeWo cells were seeded on PC Transwell membranes (3 μm pore size) at 1 × 10⁵ cells/cm2 and incubated at 37°C and 5% CO2. Medium was changed on days 3, 4, and 5 postseeding (PS). Development of the monolayer was monitored on these days using transepithelial electrical resistance (TEER) measurements followed by Na-Flu transport, transmission electron microscopy (TEM) and tight junction staining.
TEER measurements
Monolayer integrity was measured with an Endohm 12 chamber and EVOM voltohmeter (World Precision Instruments Ltd, Stevenage, UK) containing 3 mL of medium at 23°C. TEER values for the cell layer were obtained by subtracting the intrinsic resistance (blank insert membrane) from the total resistance (insert membrane with cells). TEER values were corrected for surface area and expressed as Ω · cm2.
Na-Flu transport
Cell confluence was determined by retardation of Na-Flu transport across the monolayer. A 0.5 mL aliquot of 5 μM Na-Flu was added to the apical chamber and 1.5 mL of DMEM-F12 medium (without phenol red) to the basal chamber of each Transwell. Plates were incubated for 3 hours, after which time 50 μL samples were removed in triplicate from the basal chamber into a black 96-well plate and read as described previously.
Transmission electron microscopy
BeWo cells grown on insert membranes were fixed and processed according to Lahtinen et al.Citation27 After ultrathin sectioning, the samples were analyzed using an FEI Tecnai 12 Biotwin transmission electron microscope (TEM) equipped with a bottom-mount 4 × 4k FEI Eagle™ 4k CCD camera (FEI Company, Hillsboro, OR).
Tight junction staining
To quantify the integrity of the confluent cell monolayer, antibody staining of the tight junctions was performed on day 3 PS. BeWo cells grown on PC Transwell membranes (3 μm pores) were fixed in 2% (v/v) PFA at 4°C for 1 hour, washed in phosphate-buffered saline (PBS) and permeabilized with 0.3% Triton-X-100 for 15 minutes at room temperature. Cells were incubated with a blocking agent (5% horse serum: 5% goat serum in PBS) for 1 hour at room temperature. Primary rabbit anti-ZO-1 was diluted (1:200) in blocking agent (3% horse serum: 3% goat serum in PBS) and incubated with the cells overnight at 4°C. Secondary antibody (1:200 dilution in PBS) was incubated with the cells for 1 hour at room temperature in the dark. Membranes were mounted on glass slides using VECTASHIELD mounting media (Vector Laboratories, Burlingame, CA) with DAPI. Staining was observed using a Leica™ SP5 confocal attached to a Leica DMI6000 (Wetzlar, Germany) inverted microscope and a 63X (1.4NA) oil-immersion objective. Imaging parameters were selected to optimize resolution and images were acquired with Leica confocal software.
Transport and uptake of Fluoresbrite particles
Particle characterization
Mean NP diameter was determined before and after transport experiments by dynamic light scattering using photon correlation spectroscopy. Measurements were performed on undiluted pooled samples at 25°C using a Malvern NanoZS (Malvern Instruments Ltd, Worcestershire, UK) equipped with a 633 nm laser and 173° detection optics.
MTT cytotoxicity assay
BeWo b30 cells were seeded at 1 × 10⁴ cells/well in 96-well plates and incubated at 37°C and 5% CO2 for 24 hours, followed by exposure to a range of Fluoresbrite concentrations from 0 mg/mL to 1 mg/mL with 0 mg/mL acting as the negative control. Cells were exposed to Triton X-100 at 0.1% (v/v) as the positive control. After 24 hours, NPs were removed and the cells were washed three times in PBS before incubation with 0.5 mg/mL MTT (3-(4,5-dimethyl-thiazol-2-yl)-2,5-diphenyl-tetrazolium bromide). After 2 hours’ incubation, the MTT was removed and 100 μL/well dimethyl sulfoxide was added to dissolve the crystals. The plates were rotated at 900 rpm for 1 minute and absorbance was measured at 550 nm using a Multiscan ascent plate reader (Thermo Labsystems, Helsinki, Finland). Any interference of particle fluorescence on the absorbance readings was monitored and accounted for.
Transport of Fluoresbrite nanoparticles
BeWo cells were seeded at 1 × 10⁵ cells/cm2 on PC membrane Transwells (pore size 3 μm) and grown to confluence as described above, using the optimized protocol for Fluoresbrite NPs. Experiments were conducted in supplemented DMEM-F12 without phenol red. Fluoresbrite 50 nm and 100 nm NPs at a concentration of 0.5 mg/mL were dispersed using a Branson Sonifier S-450D (Branson Ultrasonic Corporation, Danbury, CT) equipped with a disruptor horn (model 101-147-037) with amplitude setting 10% (21 μm peak-to-peak movement) in an ice-water bath for 20 minutes, with alternating 5 second pulse/5 second pause.
Transport of Fluoresbrite NPs across the BeWo cell monolayer was carried out under standard cell culture conditions with constant horizontal shaking (10 rpm). At t0, 0.5 mL of 0.5 mg/mL NP dispersion (0.22 mg/cm2) was added to the apical chamber. At successive time points (2 hours, 4 hours, 6 hours, 12 hours and 24 hours), a 100 μL sample was removed from the basal chamber and replaced with 100 μL of fresh medium. A 10 μL sample was removed from the apical chamber to allow correlation of the changing particle concentrations in each chamber. Fresh medium (40 μL) was added to samples from the apical chamber to ensure sufficient sample volume for analysis, with appropriate concentration corrections based on this dilution. Each sample was placed in a 96-well plate and immediately analyzed for fluorescence. After the final time point, cells on the Transwell were prepared for quantitative uptake analysis: Inserts with cells were washed three times in ice cold HBSS and membranes were removed and submerged in 1 mL of lysis solution. Cell lysates were placed on a stir plate for 2 hours at 37°C. Each 100 μL sample was placed in a 96-well plate and analyzed for fluorescence to determine the amount of particles in association with the cells. Statistical analysis of size dependent transport and uptake was performed using a two-tailed paired Student’s t-test in Microsoft Excel 2007 (Redmond, WA).
Uptake of Fluoresbrite particles
For imaging analysis, cells were exposed to Fluoresbrite NPs and treated as for transport. After 2 hours and 24 hours exposure, cells were stained with wheat germ agglutinine (WGA) Alexa 594 (Invitrogen, DK) at 5 μg/mL for 10 minutes at room temperature and fixed in 4% formaldehyde for 15 minutes at room temperature. Membranes were mounted on glass slides using VECTASHIELD mounting medium. Staining was observed using a Zeiss LSM 780 confocal system on an inverted stand with a 63X oil DIC Plan-Apochromat objective (Carl Zeiss Microscopy, LLC, New York, NY). Imaging parameters were selected to optimize resolution and images were acquired with Imaris Bitplane scientific software (Bitplane AG, Zurich, Switzerland).
Sample analysis and data processing
Fluoresbrite concentrations in the samples were analyzed at excitation 440 nm and emission 485 nm on a Fluorescan ascent FL (Thermo Electron Corporation, Vantaa, Finland).
For samples at each time point t = tn, the mass transported (ΔQn) was determined and corrected for the mass removed during the previous sampling periods using the following equation:
where Cn is the concentration of the sample measured at time tn, Vw is the volume of the well sampled (usually either 0.5 mL or 1.5 mL in 12-well Transwells®), Vs is the sampling volume (in our case, 100 μL and 10 μL), and the term
represents the correction for the cumulative mass removed by sampling during all the sampling periods prior to tn (from t = t1 until t = tn−1).Citation11
The data were converted to permeability values (P), using the following equation:
where ΔQ/Δt is the rate of the substance flux across a layer (mass/second), A is the surface area of the layer (in cm2), and C0 is the initial concentration of the substance on the donor side (in mass/cm2).Citation11 Permeability (P) of the substance is expressed as cm/second.
To calculate the permeability across the cell monolayer alone (and to correct for the influence of the membrane on permeability), transport of the substance across blank membranes (Transwell membranes alone without cells) was measured. Permeability in these experiments with blank membranes (Pm) and permeability in the experiments with cells on membranes (Pt) were then applied to the following equationCitation11 to calculate the apparent permeability across the cell monolayer alone (Pe):
Results
Model optimization
Nanoparticle adherence to Transwell membranes
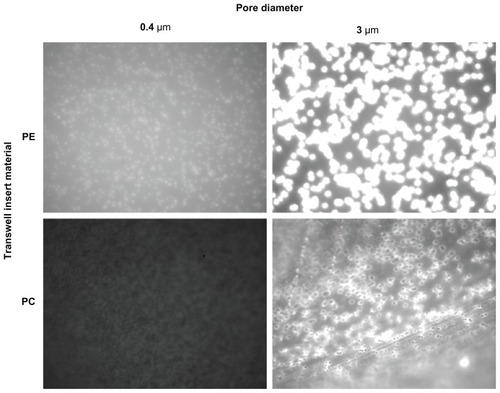
Fluoresbrite adherence to PE and PC 0.4 μm and 3 μm Transwell membranes was assessed over a 6-hour time course using both 37 nm and 200 nm particles (9.3 × 10¹³ and 6.2 × 10¹¹ particles/mL, respectively). Results showed greater particle adherence to the PE membranes (), hence these were eliminated from the study and further model development proceeded on PC membranes.
Figure 1 Fluoresbrite® adherence to PE and PC 0.4 μm and 3 μm Transwell membranes was assessed over a 6-hour time course using both 37 nm and 200 nm particles (9.3 × 10¹³ and 6.2 × 10¹¹ particles/mL, respectively, 200 nm data not shown). Photographs are comparable in the vertical direction only, due to necessary differences in gain settings. PE membranes show a greater adherence of Fluoresbrite particles and therefore were eliminated from the study.
Abbreviations: PC, polycarbonate; PE, polyester.
Nanoparticle transport across blank Transwell membranes
Fluoresbrite transport across PC 0.4 μm and 3 μm Transwell membranes was assessed over a 6-hour time course using both 37 nm () and 200 nm (data not shown) particles. The smaller pore size extensively restricted the transfer of particles across the membrane from apical to basal chambers, with transfer leveling off over 6 hours. Therefore, 3 μm PC membrane inserts were chosen for further model development.
Figure 2 Transport of 37 nm Fluoresbrite® particles across 0.4 μm and 3 μm pore size PC membranes. Fluoresbrite particles at a concentration of 9.3 × 10¹³ particles/mL were added to the apical chamber at time zero and samples were collected from the basal chamber at time intervals up to 6 hours.
Note: Results are expressed as the mean concentration ± SD (n = 3).
Abbreviations: PC, polycarbonate; SD, standard deviation.

Monolayer confirmation
As a result of preliminary NP adherence and transport experiments, PC Transwell membranes with 3 μm pore size were chosen for model optimization. BeWo cells were seeded on membranes at 1 × 10⁵ cells/cm2. Development of the monolayer was monitored on days 3, 4 and 5 PS using TEER measurements followed by Na-Flu transport, TEM and confocal microscopy, allowing a direct comparison between these parameters for each day.
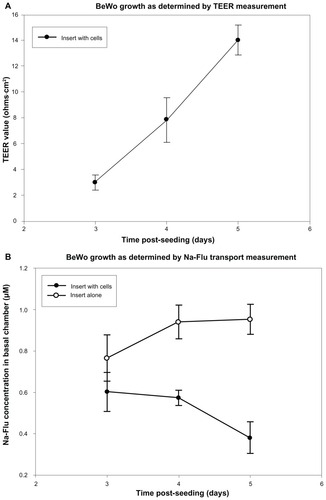
TEER and Na-Flu data confirmed the development of a BeWo monolayer over 5 days PS, with a steady increase in TEER and Na-Flu retardation rising to a maximum on day 5 PS (, respectively).
Figure 3 Formation of monolayers on PC Transwells® with 3 μm pores was measured using TEER and Na-Flu transport. Monolayers (insert plus cells) were compared with blank inserts (insert alone) on days 3, 4 and 5 PS and TEER values were blank-corrected. (A) Mean TEER values ± SD (n = 3). (B) Concentration of Na-Flu detected in basal chamber 3 hours after apical application. Values are corrected for background fluorescence and expressed as mean ± SD (n = 3).
Abbreviations: PC, polycarbonate; PS, post-seeding; SD, standard deviation; TEER, transepithelial electrical resistance.
TEM images on days 3, 4, and 5 PS show that a confluent monolayer with visible tight junctions is formed on day 3 PS (). Antibody staining for tight junction protein ZO-1 was performed on day 3 PS to examine barrier integrity in the confluent cell monolayer. DAPI counter-stain was used to visualise the nuclei. The presence of tight junction protein ZO-1 was observed (), which lends support to the progression of confluent monolayer formation indicated in the TEM images.
Figure 4 TEM imaging of BeWo cells grown on PC membranes with 3 μm pore size. (A and B) day 3 PS; (C and D) day 4 PS; (E and F) day 5 PS.
Notes: Arrows indicate tight junctions. There is evidence of monolayer formation at day 3 PS and overgrowth by day 5 PS.
Abbreviations: PS, post-seeding; TEM, transmission electron microscopy.
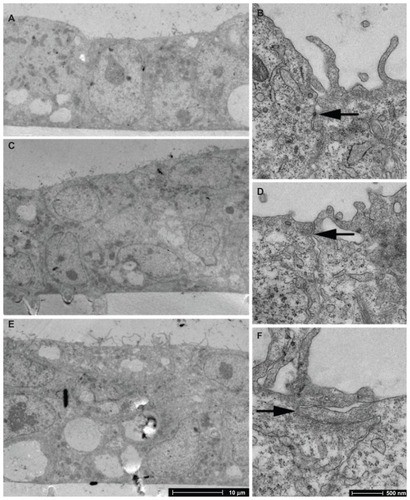
Figure 5 BeWo monolayer (day 3 PS) grown on PC membranes with 3 μm pore size, showing ZO-1 tight junction protein staining.
Notes: Blue, DAPI; Green, ZO-1 tight junction protein. Field of view 179 × 153 μm.
Abbreviations: DAPI, 4′,6-diamidino-2-phenylindole; PS, postseeding.

Transport and uptake of Fluoresbrite nanoparticles
Particle characterization
The size of the Fluoresbrite NPs can be considered stable during the 24-hour transport experiment, since the Z-average size of the particles in samples from both chambers changed only slightly compared to the initial size ().
Table 1 Fluoresbrite® nanoparticle sizes before and after transport across a BeWo cell monolayer
Photon correlation spectroscopy measurements demonstrated that the 50 nm particles had a single size intensity peak at 52 nm when added to the apical chamber at t0. At the end of the experiment, they were shown to have a 53 nm peak in apical samples and 46 nm peak in basal samples, with a small percentage of larger aggregates which had a peak at 346 nm. The 100 nm particles were shown to have one peak at 104 nm at t0 and 96 nm in apical samples at the end of the experiment. In the basal samples, the peak was at 94 nm.
MTT cytotoxicity assay
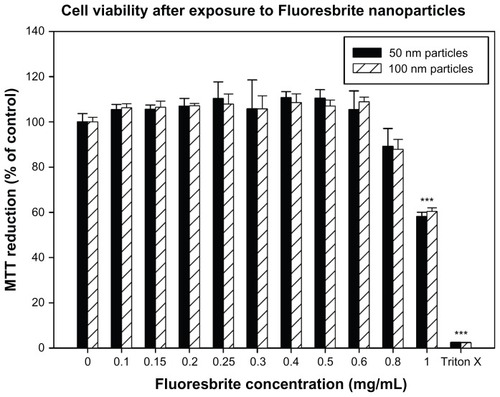
The results of the MTT assay demonstrated that exposure to 50 nm or 100 nm Fluoresbrite particles at up to and including 0.8 mg/mL demonstrated no significant toxicity compared to the unexposed negative control (). However, concentrations of particles at 1 mg/mL exhibited toxicity as determined by the MTT assay. A concentration of 0.5 mg/mL was therefore selected for use in transport studies as it showed no toxicity.
Figure 6 Viability of BeWo cells exposed to different concentrations of Fluoresbrite® nanoparticles as assessed by MTT assay. Cells were incubated for 24 hours with media containing Fluoresbrite nanoparticles of 50 nm (filled bars) or 100 nm (hatched bars) diameter ranging in concentration from 0 mg/mL (negative control) to 1.0 mg/mL. Triton X-100 was used at 0.1% (v/v) as a positive control. At the end of the incubation period, mitochondrial function was determined by the MTT reduction assay as described in the text. The absorbance value for the negative control was set to 100% and the percentage change in absorbance was calculated for the exposed groups and the positive control.
Notes: The data are expressed as mean ± SD of four replicates. A one-way analysis of variance with Games-Howell post-hoc test was used to determine a significant decrease in cell viability. ***P < 0.05 compared to control.
Abbreviations: MTT, 3-(4,5-dimethylthiazol-2-yl)-2,5-diphenyltetrazolium bromide; SD, standard deviation.
Transport of Fluoresbrite nanoparticles
After 24 hours, approximately 0.6% of the initial amount of 100 nm particles added to the apical chamber of a cell monolayer was found in the basal chamber. The 50 nm particles were transported approximately six times faster, as 3.5% of the initial amount added to the apical chamber was found in the basal chamber ().
Figure 7 Total mass (delta Q) of Fluoresbrite® NP transported across BeWo monolayers in the apical to basal direction, corrected for concentration changes in the chambers.
Notes: Size 50 nm particles were transported across monolayers at a rate six-fold higher than 100 nm particles. Mean values shown ± SD (n = 6).
Abbreviation: SD, standard deviation.
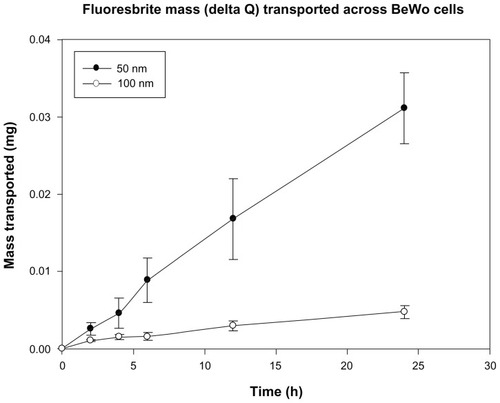
This size-dependent difference in particle transport after 24 hours is statistically significant (P value 0.002). For the 50 nm particles, the apparent permeability across the cell monolayer alone after 2 hours (3.8 ± 1.1 × 10⁻⁵ cm/s) was more than twice as high as the Pe for the 100 nm particles (1.8 ± 0.7 × 10⁻⁵ cm/s, P value 0.003, see ).
Table 2 Apparent permeability (Pe) of Fluoresbrite® particles (50 nm and 100 nm particle diameters) across a monolayer of human placental choriocarcinoma (BeWo) cells. Pe was calculated as described in the text, and the P values compare six replicates of each experiment
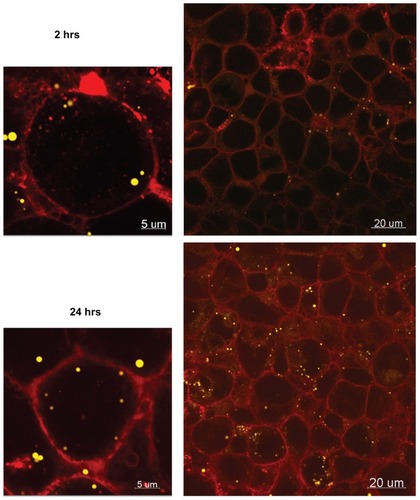
The average mass of 50 nm and 100 nm particles associated with the cells after 24 hours was 25 ± 30 μg and 2 ± 2 μg, respectively (10% and 0.8% of the initial amount of NPs), suggesting size-dependent cellular uptake. Although the difference in uptake between the two particles sizes is not statistically significant (P value 0.096), perhaps a larger sample size would further highlight this difference. Confocal microscopy confirmed cellular accumulation of the 50 nm particles over time, indicating that particle transport may be transcellular ().
Figure 8 Confocal images of 50 nm Fluoresbrite® NP uptake into BeWo cells after 2 hours and 24 hours.
Notes: Red, WGA membrane stain; yellow, Fluoresbrite NPs.
Abbreviations: NP, nanoparticles; WGA, wheat germ agglutinine.
Mass balance calculations after 24 hours indicate greater adhesion of the 100 nm particles to the PC membrane compared to the 50 nm particles, but this is not unexpected, as some degree of particle adhesion to PC membranes had been observed during the methods optimization experiments (see ).
Discussion
The novelties of nanoparticle technology give rise to the need for adapting our current testing models and methods to accommodate the challenges specific to this area of biological risk assessment. The aim of this work was to develop an optimized in vitro model of the placental barrier, suitable for use in measuring the transport of NPs. Each NP has unique properties, and a study encompassing every particle type is unrealistic; therefore, we have used Fluoresbrite as a model NP, allowing us the advantage of experience to extrapolate the primary issues and concerns that researchers should bear in mind when undertaking similar studies.
The BeWo model is a well-recognized in vitro model of the placental trophoblast layer;Citation15 therefore, its use in NP transport and toxicity testing is justified. However, there are many discrepancies in the literature regarding the precise details of the Transwell matrix used, details such as membrane type, collagen coating, culture media and TEER values, all of which affect the length of time taken for formation of a complete monolayer. This picture becomes more complicated when particles are involved. In contrast to liquids or traditional small molecules, a matrix is required which does not bind the particles. The Transwell matrix is commonly used for transport studies across cellular barriers,Citation12,Citation15 and different Transwell membrane types are available, primarily PE or PC. Particle adherence to the membrane would effectively remove the particles from the experimental system, thereby altering the particle concentration in the donor and receiver chambers and biasing the results. We found that Fluoresbrite NPs had a greater adherence to PE than to PC Transwell membranes. Factors such as the surface charge of these materials may play a part in this observation. Our findings have implications for model optimization when NP transport across a barrier is studied. Care should be taken to first examine the adherence of the particles to the test system in the absence of cells, to ensure a robust experimental design. Besides particle adherence to the membranes, particle agglomeration within the transport medium should also be considered. Although particle agglomeration may pose a significant influence on the transport of nanoparticles across a biological barrier, the particle size data presented in indicate that this was not an overriding factor in these studies. Toxicity studies were also performed to ensure that at the particle concentration employed in the transport studies (0.5 mg/mL) was not toxic. The reduced cell viability observed at higher concentrations () is most likely due to proinflammatory effects, as reported previously for this particle type.Citation28
In the present study, we have outlined the optimization of the BeWo model on PC membranes in detail. The inclusion of TEM and confocal images provided visual confirmation to validate this model. Tight junctions could be seen 3 days PS, and the increased TEER values, together with the decreased Na-Flu transport data, indicated the extent to which these tight junctions strengthened over the subsequent 48 hours. As BeWo cells are not contact inhibited, care must be taken to ensure that they do not form multiple layers over time, which could result in a loss of the desired monolayer characteristics. In fact, previous work with this cell line has demonstrated that after 7 days, the TEER declines and Na-Flu transport increases.Citation11 In a separate study, although some degree of multilayer growth of b30 BeWo cells was observed, the cells still formed tight junctions and were adequately polarized to show assymetric iron transport.Citation29 Since TEER values may vary, depending on the membrane type the cells are grown on, the pore size used, and the type of TEER apparatus used (chopstick or chamber electrodes), comparisons of absolute TEER values within the literature can be difficult. Nevertheless, visual confirmation of a monolayer added confidence to the robustness of the present study, and these images assisted in the development of standard operating procedures and optimal cell culturing conditions appropriate to study the transfer of nanoparticles across a monolayer model of human placental trophoblast cells.
Collagen-coating Transwell membranes is often used to improve cell adherence. However, we have seen that the presence of collagen in a transport model can increase NP adherence (data not shown), and thus any model that includes collagen-coating the membranes should be tested for particle binding properties prior to transport studies. We found that monolayer formation occurred more rapidly and with a more even distribution on uncoated membranes, therefore we did not use collagen-coating.
The transport of 50 nm NPs showed a six-fold higher rate across the BeWo monolayer and a two-fold higher transport rate across blank membranes when compared to 100 nm NPs. The permeability data in further corroborate these findings, as the calculation of apparent permeability accounts for transport across the blank membranes and any differences in particle binding to the Transwell inserts. The Pe values for transport across the cell monolayer were significantly higher at all time points for the 50 nm particles, compared to the 100 nm particles. Besides the differences in the transport rates, the slight decrease in Pe over time for the 100 nm particles also suggests size-dependent differences in the transport mechanisms, and additional studies are necessary to further investigate this possibility.
This size-dependent transport of particles across the placental barrier is in agreement with the ex vivo studies recently reported by Wick et al.Citation5 This further supports the validity of this model for nanoparticle transport studies, just as we have shown previously for the transplacental transport of small molecules.Citation11,Citation12 The confocal images of NP localization within the monolayer () suggest that the particles take a transcellular route through the monolayer. Future transcytosis studies will enable the determination of more details regarding the transport mechanisms.
Conclusion
We have demonstrated that the study of the transplacental kinetics of NPs can be performed using the placental BeWo model. This model provides a high throughput screening alternative to in vivo and ex vivo experimental methods, and is an effective tool in reducing, replacing and refining the use of animals in nanotechnology research. We have highlighted several points that must be taken into account for an effective, robust experimental model. In vitro cell barrier models used in the study of NP transport should undergo careful optimization for suitability of use for each NP exposed to them. Binding of NPs to the system’s matrix should be minimized as much as feasibly possible to ensure accurate transport results. Model optimization using visual techniques is essential to ensure monolayer formation, which may be influenced by matrix type, as TEER measurement alone may not be sufficient.
We found that 50 nm and 100 nm Fluoresbrite NPs are transported across the BeWo monolayer, with the former happening at a faster rate than the latter, indicating a size-dependant relationship. There is some evidence to suggest that the particles are transported transcellularly, and further research will provide more details regarding the transport mechanisms.
Acknowledgments
The authors are grateful for funding provided through the NanoTEST Consortium, supported by the European Commission FP7 (Health-2007-2001.3-4, contract number 201335), and express thanks for the support of Maria Dusinska, Lucienne Juillerat, and Antonio Marcomini in their leadership roles within the NanoTEST Consortium. LC and MS acknowledge technical support from Sara Correia Carreira and also acknowledge that some of this work was carried out with the support of the Bristol Centre for Nanoscience and Quantum Information and the Wolfson Bioimaging Facility, University of Bristol. ER is supported by a research career development award (K12HD052023: Building Interdisciplinary Research Careers in Women’s Health Program, BIRCWH) from the National Institute of Allergy and Infectious Diseases (NIAID), the Eunice Kennedy Shriver National Institute of Child Health and Human Development (NICHD), and the Office of the Director (OD), National Institutes of Health. The content is solely the responsibility of the authors and does not necessarily represent the official views of the NIAID, NICHD, OD, or the National Institutes of Health.
Disclosure
The authors report no conflicts of interest in this work.
References
- MoghimiSMKisselTParticulate nanomedicinesAdv Drug Deliv Rev200658141451145517081650
- DusinskaMFjellsboLMagdolenovaZTesting strategies for the safety of nanoparticles used in medical applicationsNanomedicine (Lond)20094660560719663587
- SaundersMTransplacental transport of nanomaterials WileyInterdiscip Rev Nanomed Nanobiotechnol200916671684
- MyllynenPKLoughranMJHowardCVKinetics of gold nanoparticles in the human placentaReprod Toxicol200826213013718638543
- WickPMalekAManserPBarrier capacity of human placenta for nanosized materialsEnviron Health Perspect2010118343243620064770
- SastryBVTechniques to study human placental transportAdv Drug Deliv Rev1999381173910837744
- MoeAJPlacental amino acid transportAm J Physiol19952686 Pt 1C132113317611349
- BechiNIettaFRomagnoliREstrogen-like response to p-nonylphenol in human first trimester placenta and BeWo choriocarcinoma cellsToxicol Sci2006931758116790488
- MathiesenLMoseTMørckTJQuality assessment of a placental perfusion protocolReprod Toxicol201030113814620096346
- RyttingEBryanJSouthardMAudusKLLow-affinity uptake of the fluorescent organic cation 4-(4-(dimethylamino)styryl)-N-methylpyridinium iodide (4-Di-1-ASP) in BeWo cellsBiochem Pharmacol200773689190017174940
- PoulsenMSRyttingEMoseTKnudsenLEModeling placental transport: correlation of in vitro BeWo cell permeability and ex vivo human placental perfusionToxicol In Vitro20092371380138619647068
- CorreiaCSCartwrightLMathiesenLKnudsenLESaundersMStudying placental transfer of highly purified non-dioxin-like PCBs in two models of the placental barrierPlacenta201132328329121236486
- RyttingEAudusKLNovel organic cation transporter 2-mediated carnitine uptake in placental choriocarcinoma (BeWo) cellsJ Pharmacol Exp Ther2005312119219815316089
- RyttingEAudusKLEffects of low oxygen levels on the expression and function of transporter OCTN2 in BeWo cellsJ Pharm Pharmacol20075981095110217725851
- BodeCJJinHRyttingESilversteinPSYoungAMAudusKLIn vitro models for studying trophoblast transcellular transportMethods Mol Med200612222523916511984
- HenningASchneiderMNafeeNInfluence of particle size and material properties on mucociliary clearance from the airwaysJ Aerosol Med Pulm Drug Deliv201023423324120500091
- SarloKBlackburnKLClarkEDTissue distribution of 20 nm, 100 nm and 1000 nm fluorescent polystyrene latex nanospheres following acute systemic or acute and repeat airway exposure in the ratToxicology20092632–311712619615422
- GeysJCoenegrachtsLVercammenJIn vitro study of the pulmonary translocation of nanoparticles: a preliminary studyToxicol Lett2006160321822616137845
- Alvarez-RománRNaikAKaliaYNGuyRHFessiHSkin penetration and distribution of polymeric nanoparticlesJ Control Release2004991536215342180
- JohnstonHJSemmler-BehnkeMBrownDMKreylingWTranLStoneVEvaluating the uptake and intracellular fate of polystyrene nanoparticles by primary and hepatocyte cell lines in vitroToxicol Appl Pharmacol20102421667819799923
- DausendJMusyanovychADassMUptake mechanism of oppositely charged fluorescent nanoparticles in HeLa cellsMacromol Biosci20088121135114318698581
- AmriteACKompellaUBSize-dependent disposition of nanoparticles and microparticles following subconjunctival administrationJ Pharm Pharmacol200557121555156316354399
- TianFRazanskyDEstradaGGSurface modification and size dependence in particle translocation during early embryonic developmentInhal. Toxicol.200921Suppl 1929619558239
- LiuFSoaresMJAudusKLPermeability properties of monolayers of the human trophoblast cell line BeWoAm J Physiol.19972735 Pt 1C159616049374645
- NanovskayaTNekhayevaIKarunaratneNAudusKHankinsGDAhmedMSRole of P-glycoprotein in transplacental transfer of methadoneBiochem Pharmacol200569121869187815876424
- BhabraGSoodAFisherBNanoparticles can cause DNA damage across a cellular barrierNat Nanotechnol200941287688319893513
- LahtinenUHonshoMPartonRGSimonsKVerkadePInvolvement of caveolin-2 in caveolar biogenesis in MDCK cellsFEBS Lett20035381–3858812633858
- BrownDMWilsonMRMacNeeWStoneVDonaldsonKSize-dependent proinflammatory effects of ultrafine polystyrene particles: a role for surface area and oxidative stress in the enhanced activity of ultrafinesToxicol Appl Pharmacol2001175319119911559017
- HeatonSJEadyJJParkerMLThe use of BeWo cells as an in vitro model for placental iron transportAm J Physiol Cell Physiol20082955C1445145318815225