 ?Mathematical formulae have been encoded as MathML and are displayed in this HTML version using MathJax in order to improve their display. Uncheck the box to turn MathJax off. This feature requires Javascript. Click on a formula to zoom.
Abstract
Bond-rupture scanning for biomedical diagnostics is examined using quartz crystal microbalance (QCM) experiments and microparticle mechanics modeling calculations. Specific and nonspecific interactions between a microparticle and its binding QCM surface can be distinguished by gradually increasing the amplitude of driving voltage applied to QCM and monitoring its frequency changes. This research proposes a mechanical model of interactions between biological molecules and a QCM substrate surface. The mechanical force required to break a biotin–streptavidin bond was calculated through a one-pivot-point bottom-up vibration model. The bond-rupture force increases with an increase of the microparticle radius, the QCM resonant frequency, and the amplitude of driving voltage applied to the QCM. The significance of the research on biological molecular bond rupture is extremely important in characterizing microbial (such as cells and virus) specificity, due to the force magnitude needed to break bonds using a transducer.
Introduction
Molecular bond-rupture scanning is an effective method for the measurement of the energy level necessary to break a bond and distinguishing specific and nonspecific binding of biological molecules. Because of differences in energy levels, nonspecific binding can be eliminated by introducing energy mechanically through displacement of a resonant quartz crystal with quartz crystal microbalance (QCM).Citation1 By increasing the voltage applied to QCM, the nonspecific binding breaks first with lower energy, followed by the specific binding. Due to the many advantages that a bond-rupture biosensor possesses, such as high efficiency, real-time, economy, and high sensitivity, it is applicable for a specific recognition immunoassay test, especially for the study of the interaction of biological molecules, detection of biological molecules, and real-time, online trace analysis of biological substances.
Based on the intention to explore biomolecular binding, there have been a number of reported successful bond-rupture tests with varied results. Yuan et alCitation1 applied both static scanning and dynamic scanning methods to monitor the interaction of streptavidin-coated polystyrene microspheres and a biotinylated QCM surface. They simultaneously measured the frequency change and noise signals from the rupture of biotin–streptavidin bonds. Dultsev et alCitation2 and Cooper et alCitation3 reported successful bond-rupture tests and successful noise capture with microspheres. The specific binding that Dultsev et alCitation2 used was also biotin–streptavidin, whereas Cooper et alCitation3 used a herpes simplex virus-glycoprotein D binding system. Edvardsson et alCitation4 attempted bond rupture using a modified QCM-D instrument but failed to rupture the bonds.
To obtain the relationship between driving voltage applied to a resonator and the mechanical force of bond rupture, this paper presents a mechanical model – one-pivot-point bottom- up vibration – of the principle of molecular bond rupture, theoretical analysis, and solution of the mechanical force generated by QCM. Based on the results obtained, comprehensive conclusions are discussed. More importantly, a pivot vibration model will be used not only to evaluate the bond-rupture force but also to characterize the surface bonding mechanism of biotin and streptavidin. The movement of a microsphere on a QCM surface can be described as translation,Citation5 rotation,Citation6 and pivot vibration.Citation7 Based on the classification of pivot structures, there are three major types in pivot vibration models, such as one point,Citation8 two points,Citation9 and a bulk.Citation7 shows the relationship of all vibration modes and a brief summary of concepts in the pivot vibration mode.
Figure 1 The schematic diagram of vibration modes.
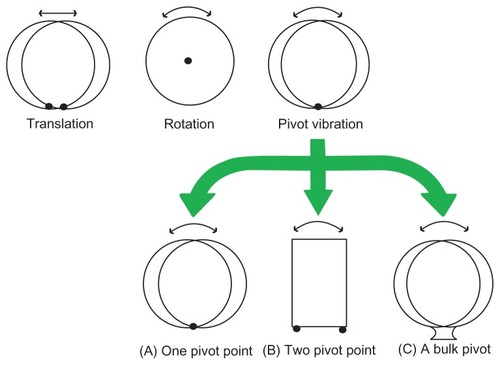
One-pivot-point vibration was discussedCitation8 in the study of frequency of a beetle-style scanning probe microscope’s scanhead. Voltages applied to electrodes induced transverse bending and axial compression or elongation via the inverse piezoelectric effect, controlling the motion of the scanning probe microscopy (SPM) scanhead. Brukman and CarpickCitation8 identified a new vibration mode of the head: pivot vibration, shown in . In addition, they proposed the pivot vibration frequency with the equation as follows:
where R is the radial distance from the legs to the center of the disk, M is the true mass of the disk and probe equipment, and J is the mass polar moment of inertia of the disk and probe equipment about the disk’s central axis. Mleg = AxsLρ, where Axs is the cross-sectional area of a leg.
Two-pivot-point vibration was discussed in the n-stories building model in an earthquake. The common analytical method is seismic isolation,Citation9 as shown in . The base in the isolation system was simplified into a two-point pivot. The equation of motion for the structure is expressed in the matrix form as:
where [Ms], [Cs], and [Ks] are the mass, damping, and stiffness matrices of the structure, respectively; {xs} − {x1, x2, … xN}T, {ẋs}, and {ẍs}are the unknown relative floor displacement, velocity, and acceleration vectors, respectively; ẍb and ẍg are the relative acceleration of base mass and earthquake ground acceleration, respectively; and {r} is the vector of influence coefficients.
Murthy Peri and CetinkayaCitation7 did an experiment on noncontact adhesion measurement and compared the rolling motion with the axial displacement of the bond. A chemical bond was treated as a bulk pivot, which is shown in . They calculated the natural frequency of this oscillator, which is shown in the following equation:
where WA is the work of adhesion, ρ is the mass density of the particle material, and r is the particle radius. Pivot vibration is the combination of vibration and rotation. The number of pivot points should be chosen based on experimental conditions.
Methodology and simulation mode
A piezoelectric model of thickness shear mode
One-pivot-point bottom-up vibration was proposed to analyze the interaction between a microsphere and a substrate in bond-rupture experiments. QCM converts the mass changes of the quartz crystal electrode surface into an output signal’s frequency changesCitation10 by a crystal oscillator circuitCitation11 and then produces highly precise data from a computer and other auxiliary equipment. The commonly used AT-cut quartz crystal oscillates almost in a thickness shear mode (TSM).Citation12 When the crystal vibrates, one of the two diagonals on the side of the crystal stretches while the other shortens, and the wave nodal plane goes through the central chip, paralleling with the main plane. This shear vibration mode, which is relevant to the thickness, is shown in . The oscillating frequency of this mode is very high, and the chip can be ground to be very thin.
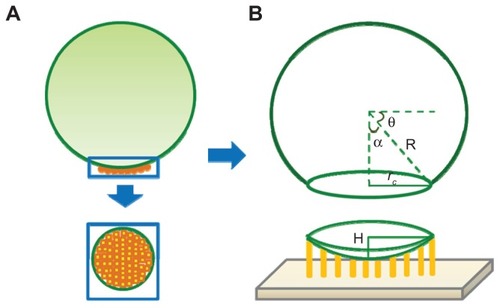
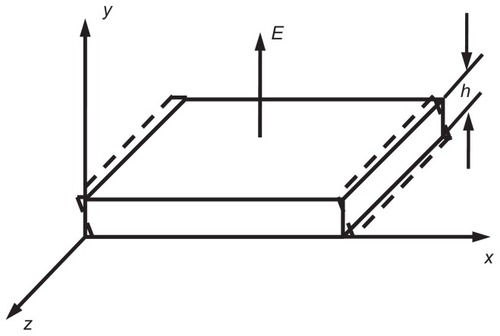
Figure 2 The mechanical model of the interaction of the sphere and with quartz crystal microbalance platform. (A) The thickness shear oscillation of a piezoelectric quartz crystal. E is the electric field direction of the piezoelectric effect. h is the thickness of the quartz. (B) Diagram of the flexible connection. (C) The mechanical model of the sphere rotating around the vertex.
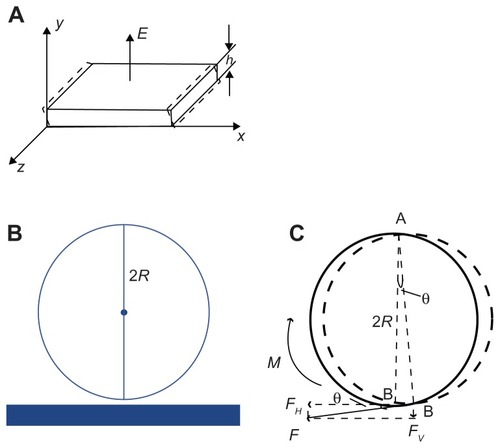
In order for a mechanical force to break a bond, surface displacement of the AT-cut TSM quartz crystal was first taken into account. Most AT-cut TSM piezoelectric quartz crystals are excited with a vertical field. Under electric field E and along the y direction, thickness shear vibration was generated on the z surface, where the piezoelectric constant is e26 and elastic stiffness constant is c66D. The density of the quartz is ρ. The displacement of the quartz along the x axis, u, is described by the one-dimensional wave equation:
Here, c is the wave velocity
. The general solution for the wave equation is:
Here, k = ω/c. The fourth-class piezoelectric equation of the AT-cut TSM quartz is defined as follows:Citation13 E2 = −h26S6 + D2/ɛ22 and T6 = c66DS6 − h26D2. Here, E2 is the electric field along the y direction, and T6 is the shear stress in the xy plane. h26 is the piezoelectric constant matrix, and ɛ22 is the dielectric constant matrix. Shear strain in the xy plane is S6 = ∂u/∂y, and D2 is the electric displacement along the y direction. If the electric field E2 is given as E2 = E = E0 exp(jωt), then the electric displacement D2 is:
and the shear stress
At the free surface, the boundary condition is T6 · y = 0 = T6 · y = 1 = 0. A and B in EquationEquation (5)(5) can be substituted. The solution for the AT-cut TSM crystal wave equation is:
The x-axial displacement u of the chip surface when y = h is u = A exp(jωt)). A=h26D0/c66Dk [1 − cos kh/sin kh] is the maximum displacement of a TSM chip.
A mechanical model of the interaction of microspheres and QCM surface
If a streptavidin-coated microsphere was bound on the QCM surface by biotin–streptavidin interaction,Citation1,Citation14 a uniform microsphere was approximately attached to the QCM surface through a flexible bond, as shown in . The sphere’s vibration can be considered as a mechanical mode, as shown in . The surface displacement of QCM is a few nanometers or several tens of nanometers, as reported by Edvardsson et al.Citation15 With regard to the microsphere radius at a micron level, it can be assumed that the bottom of the microsphere vibrated with the quartz crystal. In order to take pivot vibration into account, it is necessary to postulate the fixed top point of a microsphere. The microsphere vibrated around the vertex A, as shown in . The displacement of the bottom B is determined by the horizontal displacement of the piezoelectric plate’s surface, as discussed previously as u. Then, the line speed of point B is given as follows: v(t)=du(t)/dt=jAωexp(jωt). The angular acceleration of point B is β(t)=1/R dv(t)/dt=−A/Rω2 exp(jωt). The rotational moment around point A is M(t)=Iβ(t)=− I A/Rω2 exp(jω t). Here, I is the moment of inertia rotating around point A. The calculation of the moment of inertia rotating around vertex A is given as follows:
. Then, the rotational torque is M(t) = − I A/Rω2exp(jωt)= −6/5mRAω2exp(jωt). Moment M = Fl = F · 2R, so the force F that the TSM chip drives the microsphere to vibrate at (as is shown in ) is F(t) = M(t)/2R = −3/5 mAω2 exp(jωt). The angle between F and horizontal direction is tan θ = μ/2R = A/2R exp(jωt) and
. Therefore, the vertical component of F is:
when exp(j2ωt) = 1, the vertical component Fv reaches the maximum (ie, t = nπ/ω, n = 0, 1, 2, 3……):
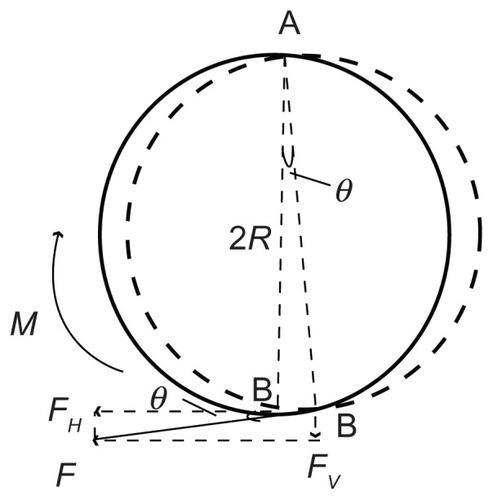
As is shown in , bond-rupture events happened between the microspheres and QCM. The forces exerted on the molecular bond include F′ by the microsphere, the horizontal force Fqh, and the vertical force Fqv by QCM surface and gravity G2 (negligible). Given that the molecular bond was approximately rigid, the maximum vertical force FBR exerted on the molecular bond by the microsphere will be equal to the vertical component of F in value.
Figure 3 Stress analysis of a molecular bond.
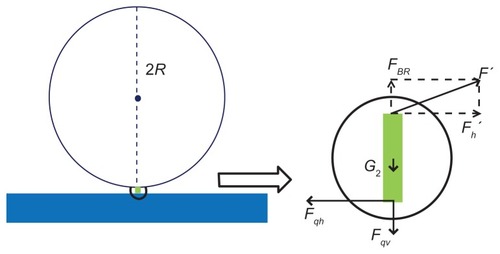
EquationEquation (9)(9) is a generally applicable formula and is suitable for most macromolecular models, such as biotin-coated polystyrene with streptavidin and streptavidin-coated polystyrene with biotin. For further discussion, select streptavidin- coated polystyrene microsphere binding biotin as the interaction system. The microsphere’s mass is m= 4/3πρR3. Here, polystyrene’s density ρ is 1050 kg/m3.Citation16 Borovsky et alCitation17 measured the relationship between the amplitude of the QCM and the voltage by experiments: A = CQVd, where C = 1.4 × 10⁻¹² is a constant determined experimentally, Q the QCM merit factor (Q factor), and Vd the driving voltage. Therefore, we can find the relationship between bond-rupture force and particle radius, the applied voltage, and frequency at the QCM electrode center.
It is worth mentioning that the mass of streptavidin-coated polystyrene microsphere contains two parts: the mass of polystyrene microsphere mPS and surface-coating streptavidin nSA · mSA. But the mass of surface-coating streptavidin is too small to be considered compared with polystyrene microsphere. So the bond rupture force we get in EquationEquation (10)(10) will be almost the same, without any significant difference.
Results and discussion
Effect on bond-rupture force FBR
If QCM resonance frequency (f0) was 10 MHz, Q factor (Q) 2500, and drive voltage (Vd) 10 V, the amplitude (A) would be 35 nm, according to A = CQVd. Under this scenario, the bond-rupture force FBR (EquationEquation (10)(10) ) can be simplified as
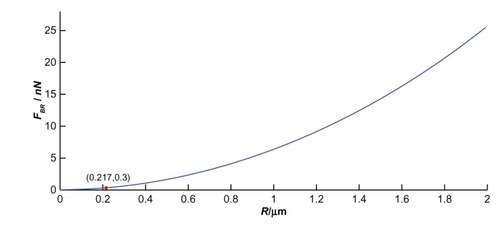
. The supporting document of Appendix 1 shows the relationship between FBR and the radius R at the QCM electrode center.
If the driving voltage and the resonant frequency are constants, the bond-rupture force provided by QCM will increase with the microsphere radius. The force to break a single biotin– streptavidin molecular bond, as measured by Grubmuller et al,Citation18 was 0.3 nN. If the microsphere radius is less than a critical value R, the mechanical force that QCM provides will not break the bond. If the QCM resonance frequency is 10 MHz, Q factor 2500, and driving voltage 10 V, then the critical value is 0.217 μm. So the mechanical force by QCM vibration will be not enough to break such a bond, due to there being a microsphere of less than 0.217 μm radius. The bond-rupture experiment will be successful only if the microsphere radius is larger than the critical value. This is a reason why upon increasing the driving amplitude after adsorption of a significant amount of 200 nm streptavidin-coated polystyrene spheres no desorption was observed.Citation4 Comprehensive analysis of bond-rupture events should be carried out to determine the essential critical values and experimental parameters needed. Therefore, an appropriate microsphere radius is one of the most important selection criteria in bond-rupture experiments.Citation14 The others, such as QCM resonant frequency and driving voltage, will be discussed here.
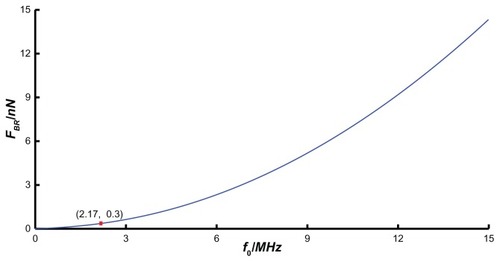
If the microsphere radius (R), QCM Q factor (Q), and driving voltage (Vd) are chosen as 1 μm, 2500 V, and 10 V, respectively, the bond rupture force FBR (EquationEquation (10)(10) ) can be simplified as FBR=6 370×10−23f02. The supporting document of Appendix 2 shows the relationship between FBR at the QCM electrode center and its resonant frequency f0. In this situation, the bond-rupture force provided by QCM increases with the resonant frequency dramatically, due to being proportional to f02. If the resonant frequency is less than a critical value f0, the mechanical force that QCM provides will not break the bond.
When the particle radius is fixed to 1 μm, the Q factor 2500, and the driving voltage 10 V, then the critical value is 2.17 MHz. That is, when the resonance frequency is less than 2.17 MHz, the mechanical force that QCM provides will not break the biotin–streptavidin molecular bond. So under the conditions that the voltage amplitude and particle radius are fixed, only when the resonance frequency is larger than a certain value will the bond-rupture experiment succeed. Therefore, an appropriate resonance frequency should be selected in bond-rupture experiments.
If the microsphere radius (R), QCM Q factor (Q), and resonant frequency (f0) were chosen as 1 μm, 2500 MHz, and 10 MHz, respectively, then the bond-rupture force FBR (EquationEquation (10)(10) ) can be simplified as
. The supporting document of Appendix 3 shows the relationship between FBR at the QCM electrode center and its driving voltage Vd. Under this circumstance, the bond-rupture force provided by QCM increases with driving voltage. If driving voltage is less than a critical value Vd, the mechanical force due to QCM vibration will not break the bond.
If the microsphere radius, Q factor, and resonant frequency are constants, such as 1 μm, 2500 MHz, and 10 MHz, respectively, then the critical value of QCM driving voltage is 2.17 V. The vibrating QCM should be driven at least 2.17 V, and then a streptavidin-coated microsphere can fly off the QCM surface. Therefore, an appropriate QCM driving voltage is one of the most important selection criteria in bond-rupture experiments.
Minimum bond-rupture force
Comparison of QCM resonant frequency, driving voltage, and microsphere radius used for bond-rupture experiments by three research groups is summarized in . The Q factors of QCM were, respectively, 2500, 4000, and 5000, according to Edvardsson et al,Citation4 Yuan et al,Citation1 and Dultsev et al.Citation2 According to EquationEquation (10)(10) , the magnitude of the bond-rupture force of the respective groups was also calculated, as shown in .
Table 1 Comparison of bond-rupture force FBR with regard to quartz crystal microbalance resonant frequency f0, applied potential Vd, and microsphere radius R
The same biotin–streptavidin interaction was carried out by three groups, but the calculated bond-rupture force of the first group was less than 0.3 nN, a minimum threshold of breaking a biotin–streptavidin molecular bond by QCM. This explains why Edvardsson et al failed to break the specific binding. The other two groups’ bond-rupture forces were much greater than 0.3 nN. Here, the proposed one-pivot-point bottom-up vibration model is successfully demonstrated for bond-rupture events.
illustrates a schematic interaction between streptavidin coated on a polystyrene microsphere and biotin immobilized on a QCM surface, according to a resonance frequency profile of bond-rupture scanning measured by Yuan et al.Citation1 The characteristics of QCM were Q factor of 4000 and resonant frequency of 10 MHz, and microspheres of 3 μm radius were tested.
Figure 4 A model of interaction between streptavidin and biotin.
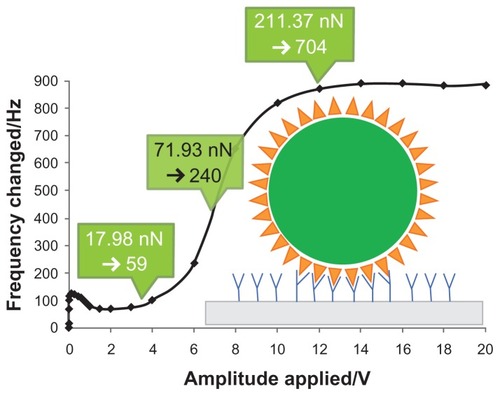
As shown in , driving voltage increased from 3.5 V to 12 V. Specific binding broke gradually, which was caused by energy levels of specific bindings. If different energy levels were attributed to biotin being immobilized on a QCM gold surface and interacting with one streptavidin biomolecule on a polystyrene microsphere’s surface, the one-pivot-point bottom-up vibration model can be further developed to determine how a microsphere is attached to a QCM surface through multiple streptavidin–biotin bonds. The microsphere will not disengage from the QCM surface until all biotin–streptavidin bonds rupture.
According to EquationEquation (10)(10) , the bond-rupture force of our group experimentCitation1 was 17.98 nN at 3.5 V. Single biotin–streptavidin molecular bond strength was reported as 0.3 nN,Citation18 so the number of streptavidin–biotin bonds ruptured is approximately 17.98/0.3 = 59 at 3.5 V. As indicated in , the calculated number of streptavidin–biotin bonds ruptured is, respectively, 240 and 704 at 7 V and 12 V, due to the respective bond rupture of energy levels of 71.93 nN and 211.37 nN. It showed a wide range of possible numbers of streptavidin–biotin bonds from 59 to 704. There was a dramatic increase of resonant frequency at 7 V, which is evidence that a majority of streptavidin–biotin bonds were ruptured by the QCM bond rupture of mechanical energy level of 71.93 nN, corresponding to 240 streptavidin–biotin bonds.
Biotin–streptavidin binding mechanism
A streptavidin molecule has four biotin binding sites, and the number of streptavidin molecules involved in binding is ns = nb/n̄. Here, nb is the total number of bindings (ie, the number of biotin molecules) and n̄ is the average number of binding sites of streptavidin (0< n̄ ≤4). When comparing the size of a streptavidin molecule with a polystyrene microsphere, streptavidin is supposed to be evenly distributed on the polystyrene surface. As shown in , the contact area S between the microsphere and substrate can be alternated by nsab, nsac, or nsbc, where [a b c] are dimensions of a streptavidin molecule [a b c] = [5.62 8.50 5.17] nm.Citation19
Figure 5 The binding sites calculation model. (A) Streptavidin molecules on the polystyrene microsphere surface. (B) The schematic diagram of the microsphere’s spherical crown.
So the minimum contact area is Smin= nbac/n̄ and the maximum contact area is Smax= nbab/n̄. According to the spherical crown area formula S = 2πRH, H=S/2πR, R is the microsphere radius, H is the height of a spherical crown, which must meet H = l, as illustrated in , and l is the biotin–streptavidin bond length 0.4 nm.Citation18 Therefore, the average number of streptavidin binding sites must satisfy:
According to our previous resultCitation1 of static-mode bond- rupture of biotin and streptavidin, the average streptavidin binding sites can be predicted by a number of biotin–streptavidin bonds at three different voltages, as shown in . This leads to streptavidin being immobilized by three types of orientation, resulting in minimum, median, and maximum contact areas. The detailed results are listed in .
Table 2 Calculation of number of streptavidin binding sites at different voltages
The average binding sites of the specific binding that broke at 3.5 V should satisfy the inequality 0.2 < n̄ < 0.4, which meets the condition 0 < n̄ ≤ 4. At 7 V of the turning point of the mass changed profile, as shown in , the majority of specific bindings (biotin–streptavidin) were ruptured at this point. It indicates an average binding site of 0.9~1.5. The data at 12 V showed an average binding site number at least larger than 2.7, and even larger than 4. This is clearly evidence that the interaction of biotin and streptavidin is supposed to be a one-binding-site model.
Conclusion
Molecular bond-rupture scanning is an advanced high- sensitivity immunoassay biosensing technology, the development of which provides a new and efficient detection method for biomedical diagnostics and environmental monitoring. The analysis of mechanical force is instructive. In this research, emphasis is placed on the theoretical analysis of the relationship between the mechanical force provided by QCM and the several influencing factors at a nanoscale level. The selection of microparticle radius, QCM resonance frequency, and voltage amplitude in the biosensor should be considered carefully. The results have given great significance to theoretical research and practical applications of a bond-rupture biosensor, paving the way for extensively spreading to related areas.
Acknowledgments
This work was funded by the National Natural Science Foundation of China to YJY under General Program Fund No 30870664. Thanks are given to all members of the Southwest Jiaotong University Laboratory of Biosensing and MicroMechatronics for invaluable discussions.
Disclosure
The authors report no conflicts of interest in this work.
References
- YuanYJvan der WerffMJChenHHirstERXuWLBronlundJEBond rupture of biomolecular interactions by resonant quartz crystalAnal Chem200779239039904417960910
- DultsevFNOstaninVPKlenermanD“Hearing” bond breakage. measurement of bond rupture forces using a quartz crystal microbalanceLangmuir2000161150365040
- CooperMADultsevFNMinsonTOstaninVPAbellCKlenermanDDirect and sensitive detection of a human virus by rupture event scanningNat Biotechnol20011983383711533641
- EdvardssonMRodahlMKasemoBHöökFA dual-frequency QCM-D setup operating at elevated oscillation amplitudesAnal Chem200577154918492616053305
- BillyMDOn the low vibration modes observed in a sphere submitted to a tangential contact forceUltrasonics2006451–412713217045320
- ChatterjeeACusumanoJPZolockJDOn contact-induced standing waves in rotating tires: experiment and theoryJ Sound Vib1999227510491081
- Murthy PeriMDCetinkayaCNon-contact microsphere-surface adhesion measurement via acoustic base excitationsJ Colloid Interface Sci2005288243244315927610
- BrukmanMJCarpickRWVibrations of the “beetle” scanning probe microscope: identification of a new mode, generalized analysis, and characterization methodologyRev Sci Instrum2006773033706033712
- MatsagarVAJangidRSInfluence of isolator characteristics on the response of base-isolated structuresEng Struct2004261217351749
- SauerbreyGThe use of quartz oscillators for weighing thin layers and for microweighingZ Phys1959155206222
- van der WerffMJYuanYJHirstERXuWLChenHBronlundJEQuartz crystal microbalance induced bond rupture sensing for medical diagnosticsIEEE Sensors J20077562769
- RaymerMGThe silicon web: physics for the Internet ageNew YorkTaylor & Francis Group2009
- AlmasrivAMCharacterization of double walled carbon nanotubes polyvinylidene fluoride nanocompositesDissertationOffice of Graduate Studies of Texas A&M University20061011
- YuanYJZhaoYXuWLCharacterization of molecular interactions of an immobilized biotinylated monolayer and streptavidin-coated microspheres by bond-rupture scanningAnal Chim Acta20106801–2596420969992
- EdvardssonMRodahlMHöökFInvestigation of binding event perturbations caused by elevated QCM-D oscillation amplitudeAnalyst2006131782282816802028
- SchmidAFujiiSArmesSPPolystyrene-silica nanocomposite particles via alcoholic dispersion polymerization using a cationic azo initiatorLangmuir200622114923492716700576
- BorovskyBMasonBLKrimJScanning tunneling microscope measurements of the amplitude of vibration of a quartz crystal oscillatorJ Appl Phys200088740174021
- GrubmullerHHeymannBTavanPLigand binding: molecular mechanics calculation of the streptavidin-biotin rupture forceScience199627152519979998584939
- FreitagSTrongILChilkotiAKlumbLAStaytonPSStenkampREStructural studies of binding site tryptophan mutants in the high-affinity streptavidin-biotin complexJ Mol Biol19982792112219636711
References
- AlmasrivAMCharacterization of double walled carbon nanotubes polyvinylidene fluoride nanocomposites [dissertation]College Station TXOffice of Graduate Studies of Texas A&M University20061011
- YuanYJZhaoYXuWLCharacterization of molecular interactions of an immobilized biotinylated monolayer and streptavidin-coated microspheres by bond-rupture scanningAnal Chim Acta20106801–2596420969992
- EdvardssonMRodahlMHöökFInvestigation of binding event perturbations caused by elevated QCM-D oscillation amplitudeAnalyst2006131782282816802028
- SchmidAFujiiSArmesSPPolystyrene–silica nanocomposite particles via alcoholic dispersion polymerization using a cationic azo initiatorLangmuir200622114923492716700576
- BorovskyBMasonBLKrimJScanning tunneling microscope measurements of the amplitude of vibration of a quartz crystal oscillatorJ Appl Phys20008840174021
Appendices
Appendix 1: A piezoelectric model of thickness shear mode
Most AT-cut TSM piezoelectric quartz crystals are excited with a vertical field as follows:
Under electric field E along the y-direction, thickness shear vibration generated on the z surface, where piezoelectric constant is e26, and elastic stiffness constant is c66D. The density of the quartz is ρ. The displacement of the quartz along the x-axis, u, can be described by the one-dimensional wave equation:
Here c is the wave velocity
. The general solution for the wave equation is:
Here k= ω/c.
The fourth class piezoelectric equation of the AT-cut TSM quartz is defined as follows:Citation1
Here E2 is the electric field along the y-direction, and T6 is the shear stress in the xy plane. h26 is the piezoelectric constant matrix, and ɛ22 is the dielectric constant matrix. Shear strain in the xy plane is S6 = ∂u/∂y, and D2 is the electric displacement along the y-direction. If the electric field E2 is given as:
Then, according to EquationEq. 3(3) , the electric displacement D2 is:
According to EquationEq. 4(4) , the shear stress T6 is:
At the free surface, the boundary condition is:
Substitute EquationEq. 6(6) into EquationEq. 7
(7) , then obtain A and B. Substituting A and B into EquationEq. 2
(2) , the solution for AT-cut TSM crystal wave equation is:
The x-axial displacement u of the chip surface, ie, when y = h, is:
Here A=h26 D0/c66D k [1 − cos kh/sin kh], is the maximum displacement of a TSM chip.
Appendix 2:
A mechanical model of the interaction of microspheres and QCM surface
If a streptavidin-coated microsphere is bound on the QCM surface vis biotin–streptavidin interaction,Citation2 a uniform microsphere is approximately attached to the QCM surface through a flexible bond. The sphere’s vibration can be considered a mechanical mode of the sphere rotating around the vertex as shown:
The surface displacement of QCM is at a few nanometers or several tens of nanometers, as reported by Edvardsson et al.Citation3 With regard to the microsphere radius at the micron level, it can be assumed that the bottom of the microsphere vibrates with the quartz crystal. In order to take pivot vibration into account, it is necessary to postulate the fixed top point of a microsphere. The microsphere vibrates around the vertex A. The displacement of the bottom B is determined by the horizontal displacement of the piezoelectric plate’s surface, shown in EquationEq. 9(9) :
Then the line speed of point B is given as follows:
The angular acceleration of point B is:
The rotational moment around point A is:
Here I is the moment of inertia rotating around point A. The model of calculation of the moment of inertia is illustrated as follows:

Therefore, the moment of inertia rotating around vertex A is given as follows:
Then the rotational torque is:
Moment M = F · l = F · 2R, so the force F that the TSM chip drives the microsphere to vibrate is:
The angle between F and horizontal direction is:
The vertical component of F is:
When exp(j2ωt) =1, the vertical component Fv reaches the maximum. That is, t=nπ/ω, n = 0, 1, 2, 3……,
As is shown in , bond-rupture events happened between the microspheres and QCM. The forces exerted on the molecular bond include F′ by the microsphere, the horizontal force Fqh, and the vertical force Fqv by QCM’s surface, and gravity G2 (negligible). The maximum vertical force FBR exerted on the molecular bond by the microsphere is:
If the streptavidin-coated microsphere was a uniform polystyrene microsphere, its mass is:
Here polystyrene’s density ρ is 1050 kg/m3.Citation4
Borovsky et alCitation5 measured the relationship between the amplitude of the QCM and the voltage by experiments:
where C = 1.4 × 10⁻¹² is a constant determined experimentally, Q the QCM merit factor (Q factor), and Vd is the driving voltage.
By substituting EquationEq. 21(21) and Equation22
(22) into EquationEq. 20
(20) , we can find the relationship between bond rupture force and particle radius, the applied voltage and frequency at the QCM electrode center.
Appendix 3:
The relationship between bond rupture force FBR and the particle radius R
If QCM resonance frequency (f0) was 10 MHz; Q factor (Q) 2500; drive voltage (Vd) 10 V, the amplitude (A) would be 35 nm according to EquationEq. 22(22) . Under this scenario, the bond rupture force FBR is:
The relationship between the bond-rupture force and particle radius is shown in Appendix 1.
Appendix 4:
The relationship between bond-rupture force FBR and QCM resonant frequency f0
If the microsphere radius (R), QCM Q factor (Q), and driving voltage (Vd) were chosen as 1 μm, 2500 V, and 10 V, respectively; according to EquationEq. 23(23) , the bond rupture force FBR is:
The relationship between the bond-rupture force and the resonant frequency is shown in Appendix 2.
Appendix 5:
The relationship between bond-rupture force FBR and driving voltage Vd
If the microsphere radius (R), QCM Q factor (Q), and resonant frequency (f0) were chosen as 1 μm, 2500 MHz, and 10 MHz, respectively; then the bond rupture force FBR is:
The relationship between the bond-rupture force and the driving voltage is shown in Appendix 3.
