Abstract
Graphene has attracted much attention from researchers due to its interesting mechanical, electrochemical, and electronic properties. It has many potential applications such as polymer filler, sensor, energy conversion, and energy storage devices. Graphene-based nanocomposites are under an intense spotlight amongst researchers. A large amount of graphene is required for preparation of such samples. Lately, graphene-based materials have been the target for fundamental life science investigations. Despite graphene being a much sought-after raw material, the drawbacks in the preparation of graphene are that it is a challenge amongst researchers to produce this material in a scalable quantity and that there is a concern about its safety. Thus, a simple and efficient method for the preparation of graphene oxide (GO) is greatly desired to address these problems. In this work, one-pot chemical oxidation of graphite was carried out at room temperature for the preparation of large-area GO with ~100% conversion. This high-conversion preparation of large-area GO was achieved using a simplified Hummer’s method from large graphite flakes (an average flake size of 500 μm). It was found that a high degree of oxidation of graphite could be realized by stirring graphite in a mixture of acids and potassium permanganate, resulting in GO with large lateral dimension and area, which could reach up to 120 μm and ~8000 μm2, respectively. The simplified Hummer’s method provides a facile approach for the preparation of large-area GO.
Introduction
Graphene is a versatile two-dimensional material with applications not confined only to electronic devices. Biologists show keen interest in graphene, and various studies have been carried out to investigate its biocompatibility with cells (eg, A549 mammalian cell line on graphene and graphene oxide [GO] paper, NIH-3T3 mouse fibroblast cells on graphene–carbon nanotube, L929 mouse fibroblast cells on graphene- and GO-polyaniline and graphene-reinforced chitosan, ARPE-19 retinal pigment epithelium cells on GO-glucose oxidase, A549 human lung carcinoma epithelial cells on GO, nano-reduced GO functionalized noncovalently by amphiphilic PEGylated polymer chains, and nano-GO covalently PEGylated on U87MG human glioblastoma and MCF-7 human breast cancer cell lines).Citation1 Our recent work has indicated that graphene, in the form of a three-dimensional structure, may be a promising scaffold for cell growth.Citation1 In addition to biocompatibility investigations, the use of graphene has been extended to bacterial eradication, including Escherichia coli, Staphylococus aureus, Pseudomonas aeruginosa, and Bacillus cereus.Citation2–Citation6
The most popular method employed for the synthesis of graphene is chemical oxidation of graphite.Citation7 This method involves oxidation of graphite to GO using highly oxidizing reagents and subsequently reducing GO to graphene using various reductants. The advantage of this method is the formation of a large quantity of graphene in powder form (scalability), which is dispersible in both polar and nonpolar solvents by functionalizing the surface of graphene. Citation8 Chemical oxidation of graphite is an established method using concentrated acids (sulfuric acid, nitric acid, and phosphoric acid) and highly oxidizing agents (potassium permanganate and potassium perchlorate). However, the oxidation method usually requires several steps and temperature controls for the preparation of GO. A simpler method for oxidation is required for efficient synthesis of GO.
Most of the GO and reduced GO reported previously possessed small area and lateral dimension, which is approximately 100 μm2 and a few hundred nanometers to a few microns, respectively.Citation9–Citation13 It is difficult to produce large-area GO due to the unavoidable tearing of GO sheets during the extreme oxidation condition and exfoliation process using ultrasonication. Large-area GO has been reported since 2009 by Tung et alCitation14 with area <2000 μm2 and lateral dimension of 20 μm × 40 μm. Later, two groups reported the synthesis of ultralarge GO sheets by modifying the oxidation/exfoliation of Hummer’s method.Citation15,Citation16 Recently, Zhao et alCitation17 reported an efficient method to produce large-area GO with an area of 7000 μm2 and a lateral dimension of up to 100 μm. However, the yield of the GO obtained was about 10%, which is very low. Prior to that, Luo et alCitation18 reported the formation of GO with high yield, reaching almost 100%, but the size of the GO produced was merely about 2000 um2. Furthermore, the method involved a long and tedious oxidation process.
Marcano et alCitation19 recently reported the synthesis of GO using an improved Hummer’s method. This method introduced a relatively simple oxidation process, with temperature controlled at 50°C, which was rather low compared with the previously reported temperature of 95°C. However, the washing process was time-consuming and tedious. Moreover, the emphasis of the method was not on producing large-area GO but more on controlling the level of oxidation and degree of ordering in GO. The conversion rate of graphite to GO was not 100%.
In order to achieve commercial value, the synthesis process of GO needs to be simplistic and cost effective. Current methods of producing GO using chemical oxidation like Hummer’s method,Citation20 Staudeumaier’s method,Citation21 and Brodie’s methodCitation22 involved tedious and long experimental time. Here, the experimental time does not refer to the time required to oxidize the graphite flakes but rather the time spent by a researcher working on the experiment during the oxidation process. The long hours of mixing the reactants and cooling or heating the reactants have been reduced from 3–5 hours to less than 5 minutes in this work. Graphite oxidation was achieved simply by adding graphite and potassium permanganate (KMnO4) into concentrated acids (containing sulfuric acid, with or without phosphoric acid) under constant stirring. The whole process was carried out without any temperature control, neither increasing nor decreasing the temperature. The mixture was stirred at room temperature for up to 3 days to achieve a high degree of oxidation.
Experimental details
Materials
Graphite flakes (code no 3061) were purchased from Asbury Graphite Mills, Inc (Asbury, NJ). Sulfuric acid (H2SO4, 98%), phosphoric acid (H3PO4, 85%), potassium permanganate (KMnO4, 99.9%), and hydrogen peroxide (H2O2, 30%), were purchased from Merck (Darmstadt, Germany). Hydrogen chloride (HCl, 37%) was purchased from Sigma-Aldrich (St Louis, MO).
Graphene oxide synthesis
Oxidation of graphite was carried out by mixing H2SO4:H3PO4 (320:80 mL), graphite flakes, and KMnO4 (18 g) using a magnetic stirrer. After adding all the materials slowly, the one-pot mixture was left for stirring for 3 days to allow the oxidation of graphite. The color of the mixture changed from dark purplish green to dark brown. Later, H2O2 solution was added to stop the oxidation process, and the color of the mixture changed to bright yellow, indicating a high oxidation level of graphite. The graphite oxide formed was washed three times with 1 M of HCl aqueous solution and repeatedly with deionized water until a pH of 4–5 was achieved. The washing process was carried out using simple decantation of supernatant via a centrifugation technique with a centrifugation force of 10,000 g. During the washing process with deionized water, the graphite oxide experienced exfoliation, which resulted in the thickening of the graphene solution, forming a GO gel.
Characterization
The area, size, and morphology of the prepared GO were characterized using an FEI Nova NanoSEM 400 field emission scanning electron microscope (FESEM; FEI, Hillsboro, OR). The lateral dimension and area of the graphene sheets were measured using I-Solution image analysis software. Atomic force microscopy (AFM) was performed on Agilent 5500 (Agilent Technologies, Inc, Santa Clara, CA), and a tapping mode was employed to determine the thickness of GO. GO was spin-coated at 1500 rpm for 1 minute on a freshly cleaved mica substrate. The X-ray diffraction (XRD) pattern was recorded using a Phillip X-ray diffractometer (Philips, Amsterdam, the Netherlands), employing a scanning rate of 0.033°s−1 in a 2θ range from 5° to 80° with Cu Kα radiation (λ = 1.5418 Ǻ). Samples for XRD analysis were prepared by spin-coating GO gel on quartz glasses. Ultraviolet-visible spectra were recorded on a Thermo Scientific Evolution 300 spectrophotometer. Chemical bonding was analyzed using a Kratos AXIS Ultra DLD X-ray photoelectron spectrometer.
Results and discussion
We carried out the preparation of large-area GO using our simplified Hummer’s method. This simplified method does not involve controlling temperature during the chemical oxidation of graphite. Unlike the commonly practiced processes where an ice bath is required during the initial addition of KMnO4 and heating during the oxidation stage, our simplified approach is hassle-free. The slight exothermic process, which increases the temperature to 40°C–50°C after the addition of H2O2 solution to terminate the oxidation process, will cool down naturally in a short time. This experiment is relatively safe, and the danger of explosion is reduced significantly, in contrast to the normal route of chemical oxidation of graphite. Furthermore, the mixing and washing steps are simple and straightforward, yielding an almost 100% conversion of large-area GO.
To study the effect of oxidation level we used KMnO4:acid (H2SO4:H3PO4) at the weight ratios of 1:80, 1:40, and 1:20 (hereon denoted as KS-80, KS-40, and KS-20, respectively, where the weight ratio of H2SO4:H3PO4 was fixed at 9:1) and the weight ratio of graphite:sulfuric acid was maintained at 1:100 for all the samples. Oxidation time was fixed at 6 hours, 1 day, 2 days, and 3 days, respectively, to evaluate the oxidation level effects on GO. The samples were gently sonicated for 5 minutes prior to FESEM viewing.
shows the average lateral dimension of the GO produced with different ratios of KMnO4:acids and oxidation time (6 hours to 3 days). After 6 hours of oxidation, GO with an average lateral dimension of 18.7 μm was formed in KS-20, which was larger than that of KS-40 and KS-80. The conversion was very low, as observed from the large amount of precipitate after centrifugation for 5 minutes at 4000 rpm, indicating un exfoliated or unoxidized graphite. The amount of precipitate observed in KS-80 and KS-40 was even greater than KS-20. After 1 day of oxidation, a similar result was observed as compared with an oxidation time of 6 hours. However, the average size of GO had increased for the three ratios. When the oxidation time increased to 2 days, GO in KS-20, KS-40, and KS-80 increased in size as compared with after 1 day of oxidation. The lack of precipitate after centrifugation suggests that KS-20 had the highest yield of GO, even though the oxidation process was not yet optimized. At day 3, KS-20 achieved a 100% conversion of graphite to GO, as precipitate was not found after centrifugation. The size of the GO produced is large, with an average lateral dimension of 58.3 μm.
Table 1 Average lateral dimension of graphene oxide for different reaction parameters.
show the FESEM micrographs of graphene prepared using three different ratios of KMnO4:acids (KS-80, KS-40, and KS-20) after 3 days of oxidation. The GO samples were gently sonicated for 5 minutes using 80 W power of sonication before being spin-coated on SiO2/Si wafer and viewed under FESEM. From the micrographs, it was found that the average lateral dimension of GO increased as the ratio of KMnO4:acid increased. KS-20 with the highest concentration of KMnO4 produced the largest GO (). However, due to the sonication effect, the average lateral dimension of graphene becomes 58.3 μm. On the contrary, nansonicated GO in KS-20 presents uniform sheets of GO with an average lateral dimension of 95.1 μm (up to 120 um) and an area of ~8000 μm2 ().
Figure 1 Field emission scanning electron microscopy micrographs of graphene oxide prepared in (A) KS-80, (B) KS-40, and (C) KS-20 after 3 days of oxidation and (D) nonsonicated KS-20. All the micrographs were taken at the same magnification.
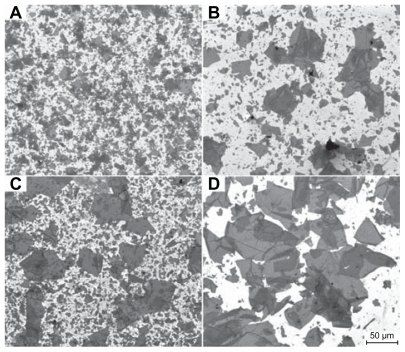
These observations are different from the reported investigations on the effects of oxidation on the size of GO. It was previously reported that the size of GO reduced with a higher degree of oxidation.Citation17,Citation23 However, by using our proposed simplified Hummer’s method, GO with a large lateral dimension is produced with a higher degree of oxidation. This can be explained by the fact that the initial graphite used for previous works is smaller in size as compared with that of ours, and the graphite may have overoxidized under elevated temperature (95°C). As for our sample, the optimum oxidation time was 3 days (for KS-20) with the GO produced possessing the largest dimension. However, after 4 days of oxidation, the GO produced showed small lateral dimension in the range of <20 μm (FESEM micrograph not shown).
Based on the FESEM images, a plausible mechanism for the formation of large-area GO is a complete oxidation of graphite but not overly oxidized, as it could lead to tearing of the GO. The complete oxidation condition resulted in graphite oxide to be exfoliated easily in large pieces. Another contributing factor that leads to the formation of large GO is that the reactions were carried out at room temperature. It has been reported that high temperature during the oxidation process reduces the size of the GO produced.Citation17
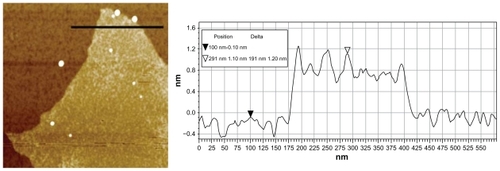
The large-area graphene for sample KS-20 after 3 days of oxidation was measured using atomic force microscopy to determine the thickness of the GO produced. A typical tapping mode AFM image and the corresponding height cross-section profile of the GO sheets deposited on a mica substrate are shown in . Based on the AFM height profile analysis, the thickness of the KS-20 GO sample is around 1.2 nm. The result is consistent with the thickness of the characteristic single-layer GO reported.Citation17,Citation24
Figure 2 Atomic force microscopy measurement of graphene oxide (scan area: 1 μm × 1 μm). Tapping mode atomic force microscopy image of single-layer graphene oxide (KS-20) with corresponding height cross-sectional profile with an average thickness of 1.2 nm. The sample was spin-coated on a freshly cleaved mica substrate.
Ultraviolet-visible spectroscopy measurement was carried out to monitor the degree of oxidation for the graphene samples. The spectra for KS-80, KS-40, and KS-20 were recorded after 3 days of oxidation, as shown in , with absorption peaks at 233 nm, 232 nm, and 229 nm, respectively. These peaks are due to the π → π* transition for the C=C bonding, which is similar to the reported value in the literature.Citation25 The peak position for KS-20 sample exhibits the lowest wavelength, indicating that the sample has a lower amount of remaining conjugation (thus requires higher energy for the electronic transition) as compared with the other two samples (KS-40 and KS-80), which is due to the higher degree of oxidation with more functional groups on the GO basal plane. Also, there is a similar shoulder around 300 nm observed for all the three samples, which is attributed to n → π* transition of the carbonyl groups. Another observation on the ratio of the intensity of C=C bonding peak (~230 nm) to the intensity of 300 nm peak finds that the higher the degree of oxidation, the greater the ratio. This is because a more oxidized graphene basal plane yields a greater amount of isolated aromatic rings that increase the intensity of C=C bonding peak. In contrast, a less oxidized graphene basal plane gives rise to a lesser amount of isolated aromatic rings and remained in the extended conjugated aromatic rings form, and therefore the intensity of C=C bonding peak is relatively low.Citation19 In this scenario, the peak intensity ratio for KS-20 is 3.2, and 2.1 for both KS-80 and KS-40, respectively. To the best of our knowledge, the reported ultraviolet-visible spectra for GO in the literature have ratios that fall within the range of <2, in which the lateral dimension of the GO produced is significantly smaller.
Figure 3 (A) Ultraviolet-visible absorbance spectra of graphene oxide after 3 days of oxidation time, and (B) X-ray diffraction patterns of graphite flakes and graphene oxide.
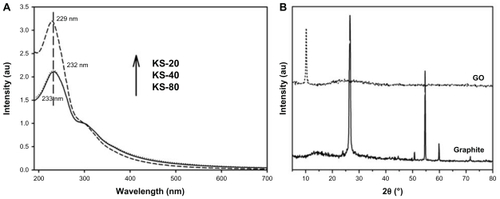
XRD patterns in show a distinct diffraction peak at 10.24° for GO and 26.56° for graphite flakes. The interlayer spacing values for graphite flakes and GO are 0.34 nm and 0.87 nm, respectively. The distance between consecutive carbon layers was increased for GO due to the introduction of oxide functional groups to the carbon basal plane via chemical oxidation reaction. This increased interlayer spacing for GO is in line with the results measured from AFM.
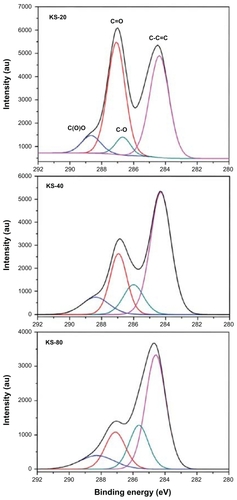
In , the C1 s band of the GO samples (KS-20, KS-40, and KS-80 after 3 days of oxidation) can be fitted to four deconvulated components, located at 284.3 eV, 286.6 eV, 287 eV, and 288.6 eV. These components can be assigned to the nonoxygenated ring carbon, C in C–O, C in C=O, and C in C(O)O, respectively, which are separated by ~2.0 eV, 1.0 eV, 1.0 eV, and 1.0 eV.Citation26 All the oxygenated features increased in intensity as the concentration of KMnO4 increased from KS-80 to KS-20. The components that experienced the highest degree of oxidation is the C in C=O for KS-20, as can be seen from the high-intensity peak at around 287 eV. The components are in agreement with the results in the literature for similar C1 s band shapes.Citation13,Citation27,Citation28 These X-ray photoelectron spectrometry results are in accordance with the ultraviolet-visible analysis, revealing that the concentration of KMnO4 directly influenced the degree of oxidation.
Figure 4 X-ray photoelectron spectrometry analysis of graphene oxide with different degrees of oxidation illustrating the deconvoluted X-ray photoelectron spectra in the C1s peak region for the KS-20, KS-40, and KS-80 samples.
Conclusion
We report a highly facile method for the preparation of scalable large-area GO. The method was carried out at room temperature with the highest conversion possible (100% conversion of graphite flakes to GO) to produce large-area GO without ultrasonication. Here, we have identified key factors contributing to the large area of GO formed, which are complete oxidation of graphite through a high degree of oxidation and the need to carry out the reaction at room temperature. Our method of synthesizing GO will infinitely increase the rate of GO production for numerous investigations, which might appeal to biologists, chemists, physicists, and materials scientists.
Disclosure
The authors report no conflicts of interest in this work.
Acknowledgment
This work was supported by the High Impact Research Grant of the University of Malaya (UM.C/625/1/HIR/030) and the High Impact Research Grant under the Ministry of Higher Education of Malaysia (UM.C/625/1/HIR/MOHE/05).
References
- LimHNHuangNMLimSSHarrisonIChiaCHFabrication and characterization of graphene hydrogel via hydrothermal approach as a scaffold for preliminary study of cell growthInt J Nanomed2011618171823
- HuWPengCLuoWGraphene-based antibacterial paperACS Nano201044317432320593851
- AkhavanOGhaderiEToxicity of graphene and graphene oxide nano-walls against bacteriaACS Nano201045731573620925398
- DasMRSarmaRKSaikiaRKaleVSShelkeMVSenguptaPSynthesis of silver nanoparticles in an aqueous suspension of graphene oxide sheets and its antimicrobial activityColloid Surf B2011831622
- ParkSMohantyNSukJWBiocompatible, robust free-standing paper composed of a TWEEN/graphene compositeAdv Mater2010221736174020496406
- AkhavanOGhaderiEPhotocatalytic reduction of graphene oxide nanosheets on TiO2 thin film for photoinactivation of bacteria in solar light irradiationJ Phys Chem C20091132021420220
- DreyerDRParkSBielawskiCWRuoffRSThe chemistry of graphene oxideChem Soc Rev201039228224020023850
- GaoJLiuFLiuYMaNWangZZhangXEnvironment-friendly method to produce graphene that employs vitamin C and amino acidChem Mater20102222132218
- JuH-MHuhSHChoiS-HLeeHLStructures of thermally and chemically reduced grapheneMater Lett201064357360
- ZhangTZhangDShenMA low-cost method for preliminary separation of reduced graphene oxide nanosheetsMater Lett20096320512054
- ChenLXuZLiJReduction and disorder in graphene oxide induced by electron-beam irradiationMater Lett20116512291230
- YangS-TChenSChangYCaoALiuYWangHRemoval of methylene blue from aqueous solution by graphene oxideJ Colloid Interface Sci2011359242921482424
- StankovichSDikinDAPinerRDSynthesis of graphene-based nanosheets via chemical reduction of exfoliated graphite oxideCarbon20074515581565
- TungVCAllenMJYangYKanerRBHigh-throughput solution processing of large-scale grapheneNat Nano200942529
- SuC-YXuYZhangWElectrical and spectroscopic characterizations of ultra-large reduced graphene oxide monolayersChem Mater20092156745680
- ZhouXLiuZA scalable, solution-phase processing route to graphene oxide and graphene ultralarge sheetsChem Commun20104626112613
- ZhaoJPeiSRenWGaoLChengHMEfficient preparation of large-area graphene oxide sheets for transparent conductive filmsACS Nano201045245525220815368
- LuoZLuYSomersLAJohnsonATCHigh yield preparation of macroscopic graphene oxide membranesJ Am Chem Soc200913189889919128004
- MarcanoDCKosynkinDVBerlinJMImproved synthesis of graphene oxideACS Nano201044806481420731455
- HummersWSOffemanREPreparation of graphitic oxideJ Am Chem Soc1958801339
- StaudenmaierLMethod of preparation of graphite-acidBerichte der Deutschen Chemischen Gesellschaft18983114811499 German
- BrodieBCOn the atomic weight of graphitePhilos Trans R Soc Lond1859149249259
- ZhangLLiangJHuangYMaYWangYChenYSize-controlled synthesis of graphene oxide sheets on a large scale using chemical exfoliationCarbon20094733653368
- DikinDAStankovichSZimneyEJPreparation and characterization of graphene oxide paperNature200744845746017653188
- MeiQZhangKGuanGLiuBWangSZhangZHighly efficient photoluminescent graphene oxide with tunable surface propertiesChem Commun20104673197321
- ZhangWCCarravettaVLiZLuoYYangJOxidation states of graphene: insights from computational spectroscopyJ Chem Phys200913124450524451120059077
- FanZJKaiWYanJFacile synthesis of graphene nanosheets via Fe reduction of exfoliated graphite oxideACS Journal20105191198
- GengYWangSJKimJKPreparation of graphite nanoplatelets and graphene sheetsJ Colloid Interface Sci200933659259819414181