 ?Mathematical formulae have been encoded as MathML and are displayed in this HTML version using MathJax in order to improve their display. Uncheck the box to turn MathJax off. This feature requires Javascript. Click on a formula to zoom.
Abstract
Oligomycin-A (Oli-A), an anticancer drug, was loaded to the folate (FA)-conjugated chitosan as a tumor-targeted drug delivery system for the purpose of overcoming the nonspecific targeting characteristics and the hydrophobicity of the compound. The two-level factorial design (2-LFD) was applied to modeling the preparation process, which was composed of five independent variables, namely FA-conjugated chitosan (FA-CS) concentration, Oli-A concentration, sodium tripolyphosphate (TPP) concentration, the mass ratio of FA-CS to TPP, and crosslinking time. The mean particle size (MPS) and the drug loading rate (DLR) of the resulting Oli-loaded FA-CS nanoparticles (FA-Oli-CSNPs) were used as response variables. The interactive effects of the five independent variables on the response variables were studied. The characteristics of the nanoparticles, such as amount of FA conjugation, drug entrapment rate (DER), DLR, surface morphology, and release kinetics properties in vitro were investigated. The FA-Oli-CSNPs with MPS of 182.6 nm, DER of 17.3%, DLR of 58.5%, and zeta potential (ZP) of 24.6 mV were obtained under optimum conditions. The amount of FA conjugation was 45.9 mg/g chitosan. The FA-Oli-CSNPs showed sustained-release characteristics for 576 hours in vitro. The results indicated that FA-Oli-CSNPs obtained as a targeted drug delivery system could be effective in the therapy of leukemia in the future.
Introduction
Oligomycins are macrolides created by Streptomyces diastatochromogenes that can be poisonous to other organisms. They are found in four isomers, namely A, B, C, and D, and are highly specific for the disruption of mitochondrial metabolism, observed both in vitro and in vivo.Citation1–Citation4 Oligomycin A (Oli-A) (C45H74O11), a dominant analog of the isomers, is an inhibitor of mitochondrial F1F0-ATPase. It could induce apoptosis in a variety of cell types, make cells more susceptible to cell death and also lead to a switch in the death mode from apoptosis to necrosis. Oli-A exhibits a broad biological profile including antifungal, antitumor, and nematocidal activities. Scientists discovered that Oli-A could lead the chronic myelogenous leukemia (CML) cell to apoptosis.Citation5 Unfortunately, Oli-A has poor solubility in water and other biocompatible solvents, which limits its clinical application. Moreover, Oli-A has no active targeting to the CML cell with lower treatment efficiency. Therefore, development of new drug delivery system for Oli-A has more prospects.
The use of chemotherapy to treat cancers is often limited by unwanted toxic effects on normal tissues. This is because most anticancer drugs are not distributed in the target tumor-bearing tissues specifically, which results in reduced therapeutic efficacy. Therefore, it is evident that targeted delivery of anticancer drugs into the tumor tissue is the focus of intensive research to improve chemotherapy.Citation6 For this reason, various drug delivery systems have been investigated to reduce toxicity and increase the therapeutic efficacy of anticancer drugs.Citation7 Targeting drug delivery system is a dosage system which promises to expand the therapeutic windows of drugs by increasing delivery to the target tissue as well as the target-non-target tissue ratio. This will in turn lead to a reduction in the minimum effective dose of the drug and the accompanying drug toxicity, and an improvement in therapeutic efficacy at equivalent plasma concentrations. Among targeting agents directed to membrane-bound tumor-associated receptors, folate (FA) has been widely utilized as a ligand for FA receptor-mediated selective targeting and delivery of drugs into tumor cells.Citation8 FA is potentially superior to antibodies as a targeting ligand because of its small size, lack of immunogenicity, ready availability, and simple and defined conjugation chemistry.Citation9 The FA receptor is a tumor marker over expressed in more than 90% of ovarian carcinomas and large percentages of other human tumors, including acute myelogenous leukemia.Citation10 Meanwhile, normal tissue distribution of the FA receptor is highly restricted, making it a useful marker for targeted drug delivery to tumors.Citation11 Recently, it has been reported that FA-mediated delivery of drug-loaded nanoparticles can enable binding, promote uptake, and have increased cytoxicity to cancer cells in vitro and in vivo.Citation12–Citation14 For example, the nanoparticles of FA-conjugated water insoluble paclitaxel-loaded bovine serum albumin have shown natural property, high stability, desired surface properties in favor of cellular uptake, and can be targeted specifically to cancer cells compared to nanoparticles without FA conjugation.Citation15 Therefore, beneficial effects of nanoparticles targeting are likely found at the cellular and subcellular levels.
Chitosan (CS) is a biodegradable polysaccharide derived by partial deacetylation of chitin, which is a copolymer of glucosamine and N-acetyl-d-glucosamine linked together by β (1, 4) glycosidic bonds mainly from renewable crustacean shells, such as crab, shrimp, and squid pen. CS has been widely used as a drug carrier in pharmaceutical and medical areas, due to its favorable biopharmaceutical properties such as biocompatibility, biodegradability, and low toxicity properties.Citation16–Citation21 Thus, CS has been investigated as a carrier for gene therapy as well.Citation22,Citation23 In the theory of the pharmacy, the CS molecule is positive in acidic conditions due to containing amidocyanogen, it can be agglomerated by using ionic gelation with abundant negative charge, such as sodium tripolyphosphate (TPP), and form nanoparticles. In recent years, hollow nanospheres of CS have attracted considerable attention, because of their wide applications, such as optical, magnetic, and controlled drug-delivery carriers.Citation24,Citation25
In this study, we used CS as a carrier and FA as a target to produce active targeting preparations (oligomycin-loaded FA-conjugated-CS nanoparticles (FA-Oli-CSNPs)) with the purpose of developing a suitable targeted drug delivery system for CML chemotherapy. Moreover, the obtained FAOli-CSNPs were characterized by particle size, zeta potential (ZP), amount of FA conjugation, drug entrapment rate (DER), drug loading rate (DLR), and surface morphology. The release kinetics properties in vitro were also tested.
Materials and methods
Materials
Oli-A (purity = 98.5%) was kindly provided by Hisun (Hisun Pharmaceutical Co, Ltd, Zhejiang, China). CS with 98.27% deacetylation degree and 67000 D viscosity average molecular weight was purchased from Haidebei (Haidebei Marine Bioengineering Co, Ltd, Jinan, China), and needed a further purification process before using. FA (purity >98%) was obtained from Sigma (Sigma Aldrich, St Louis, MO). TPP (purity >99.5%) was purchased from Xi Long (Xi Long Chemical Factory, Shantou, Guangdong, China). N-hydroxysuccinimide (NHS, purity >99.0%), 1,3-dicyclohexyl-carbodiimide (DCC, purity >95.0%), triethylamine (TEA, purity >99.5%), dimethyl sulfoxide (DMSO, purity >99.5%), phosphate-buffered solution (PBS, 0.15 M, pH = 7.2–7.6), ethanol, and ether were analytical grade. Methanol and acetonitrile were HPLC grade.
Methods
Preparation of FA-Oli-CSNPs
Preparation of the N-hydroxysuccinimide ester of FA (NHS-FA)
The preparation procedure of NHS-FA was optimized after consulting the literature.Citation26 In short, 3 g of FA was dissolved in 60 mL DMSO containing 1.5 mL TEA; this was followed by the addition of 2.82 g DCC and 1.56 g NHS. The mixture was stirred for 12 hours at room temperature; the insoluble side product dicyclohexylurea was removed by filtration, the filtrate was then poured into an ice-cold anhydrous ether solution containing 30% acetone, centrifuged, and washed twice. Finally, NHS-FA, a delicate light yellow solid powder, was obtained by drying at room temperature. The structure of NHS-FA was proved by FTIR spectroscopy detection.
Preparation of FA-conjugated CS (FA-CS) and the UV absorption spectroscopy of FA-CS
Before the preparation of FA-CS, the purification of CS was carried out. CS is a cationic polysaccharide. It is soluble at pH <7 and insouluble at pH >7. The purification process is referred to in the literature.Citation27 NHS-FA (1.50 g) was dissolved in DMSO (150 mL). The adequate dissolution process was performed in an ultrasonication bath TI-H-5 (Elma, Singen, Germany). Thereafter, CS (1.00 g) was added into the DMSO-containing NHS-FA, and stirred for 4 hours at 60°C. The reactant was deposited after centrifugating (12,000 rpm, 5 min) at room temperature, and free NHS-FA was washed off by DMSO. Finally, the product was washed with deionized water to remove residual DMSO and FA-CS was gained by freeze-drying.
The amount of NHS-FA conjugated with CS was evaluated using the UV absorption spectroscopy technology. FA-CS (50 mg) was dissolved in 1% glacial acetic acid (50 mL). Then, the solution was scanned in the range of 200 to 500 nm by UV-spectrophotometer (SHIMADZU, Tokyo, Japan), using the 1% acetic acid solution dissolving CS as a blank control. The amount of NHS-FA conjugated with CS was the mean of triplicate experiments.
Preparation and optimization of FA-Oli-CSNPs by two-level factorial design (2-LFD)
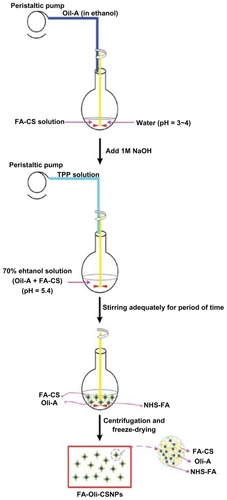
FA-Oli-CSNPs were prepared by the ion crosslink method. The FA-CSNPs loading Oli-A were obtained from the supramolecular self-organizing interaction between the negatively charged TPP and the positively charged polysaccharide CS, without preliminary vesicle formation.Citation28 As illustrated in , briefly, after FA-CS was first dissolved in 1% acetic acid solution, ethanol dissolving Oli-A was added. The pH of the reaction system was adjusted to 5.4 with sodium hydroxide (1 mol/L). Thereafter, the TPP solution was added with a peristaltic pump TI/62/20 (Medorex, Norten-Hardenberg, Germany) (4 mL/min) at room temperature. The reaction process was performed under magnetic stirring for a predetermined time period.
Figure 1 Schematic description of the preparation procedure of FA-Oli-CSNPs.
Abbreviations: Oli-A, oligomycin-A; FA-CS, the folate-conjugated chitosan; TPP, sodium tripolyphosphate; FA-Oli-CSNPs, folate-conjugated chitosan nanoparticles loading oligomycin-A; NHS-folate, N-Hydroxysuccinimide ester of folate.
The mixture was centrifuged (10,000 rpm, 5 min) at 25°C to separate the dissociative Oli-A from the supernatant, and was washed with 70% ethanol three times. The supernatant was collected to detect the DER and DLR, the precipitation was redispersed with purified water, 2 mL was withdrawn for particle size measurement and ZP analysis.
The major factors affecting the particle size and drug loading efficiency of nanoparticles were the carrier concentration, the drug concentration, crosslinking agent concentration, mass ratio of carrier to crosslinking agent, and crosslinking time.Citation29,Citation30 So in this study, FA-Oli-CSNPs preparation procedure was optimized by a five-factor, two-level factorial design (2-LFD), with FA-CS concentration (X1), Oli-A concentration (X2), mass ratio of FA-CS to TPP (X3), TPP concentration (X4), and crosslinking time (X5) as the independent variables (). The levels of those independent variables were based on preliminary trials. The MPS, DER, DLR and ZP of the resulting FA-Oli-CSNPs were used as response variables. Each factor was studied at two levels; low level and high level, added center points. To analyze the factorial design, the original measurement units for the experimental factors (uncoded units) were transformed into coded units. The factor levels were coded as −1 (low), 0 (center) and +1 (high). MINITABTM (Minitab, State College, PA) release 15 statistical software was applied to generating and evaluating the statistical experimental design () for gaining the optimum preparation condition. Five factors were used at two levels applying a 1/2 fraction factorial 25−1 Resolution V design and adding three center points resulting in 19 runs ().
Table 1 Factors and their levels in 2-LFD analysis
Table 2 Experimental design and results of the 2-LFD analysis
Lyophilization
To further improve the chemical and physical stability of the final product, the resulting precipitate was freeze dried again after the final redispersion. Some amount of cryoprotectants (mannitol) were added to the final redispersed solution in 10 mL glass vials before freeze drying if needed according to the mass ration of mannitol: FA-Oli-CSNPs = 1:1 (w/w). The mixture was firstly prefrozen in the refrigerator (−40°C) for 12 hours, subsequently lyophilized at −40°C for 48 hours in a Gamma 2–20 apparatus (Christ, Osterode am Harz, Germany). Lastly, the FA-Oli-CSNPs, a kind of pale yellow powder, were obtained.
Characterization of FA-Oli-CSNPs
Determination of the DER and DLR of Oli-A
The dissociative Oli-A in the supernatant was examined by high performance liquid chromatography (HPLC). A Waters high performance liquid chromatograph (Waters Corporation, Milford, MA), consisting of a Waters 1525 Binary HPLC Pump, and a Waters 2489 UV/Visible Detector. The samples were chromatographed at 25°C by injecting of 5 μL of sample into a Diamonsil C18 column (250 mm × 4.6 mm, 5 μm; Dikma Technologies, Beijing, China). The mobile phase was composed of acetonitrile: deionized water = 80: 20 (v/v) at 1 mL · min−1. The UV/Visible detection wavelength was set to 226 nm. DLR and DER were determined by Equationequations (1)(1) and Equation(2)
(2) .
MPS and ZP of FA-Oli-CSNPs
The MPS and ZP of FA-Oli-CSNPs were determined by dynamic laser light scattering and a ZP analyzer (Zetapals, Brookhaven Instruments, Holtsville, NY), respectively. The samples were diluted with deionized water and measured at room temperature in triplicate. The multimodal size distribution analysis method was adopted to calculate the MPS of samples.Citation31
Morphology of FA-Oli-CSNPs by a scanning electron microscopy
The morphology of the nanoparticles was observed by scanning electron microscopy (FEI Co, Eindhoven, The Netherlands). Prior to analysis, original Oli-A, the FA-CS, and FA-Oli-CSNPs powders were painted on the conductive adhesive, subsequently coated with gold (JFC 1200 fine coater, JEOL, Japan), and examined by scanning electron microscopy.
Drug release of FA-Oli-CSNPs
Oli-A release from FA-Oli-CSNPs was determined in phosphate-buffered solution at 37°C. FA-Oli-CSNPs were dispersed in phosphate-buffered solution (5 mL), and placed in a dialysis bag (MWCO = 3500 Da). The end-sealed dialysis bag was immersed in a 250 mL beaker containing 200 mL release buffer, and the beaker was then placed in an incubator shaker at 37°C and 100 rpm. At predetermined time intervals, 20 mL of the dialysis solution was withdrawn and replaced with an equal volume of fresh phosphate-buffered solution. In order to make a negative control, meanwhile, the release of Oli-A raw powder was also carried out according to the above method. The concentration of Oli-A in each collected release buffer sample was determined by HPLC as described earlier. The drug release studies were carried out in triplicate for each of the samples. The accumulative release percentage was calculated by using the following equations:
where Ci represents the Oli-A concentration of each sample withdrawn at predetermined time intervals, C′i represents the increase of the Oli-A concentration during each time interval, V represents the volume of the release buffer, Vi represents the volume of each withdrawn sample, M is the Oli-A loaded in the FA-Oli-CSNPs, and Qi is the accumulative release percentage at predetermined time point.
Results and discussions
The FTIR spectroscopy of NHS-FA
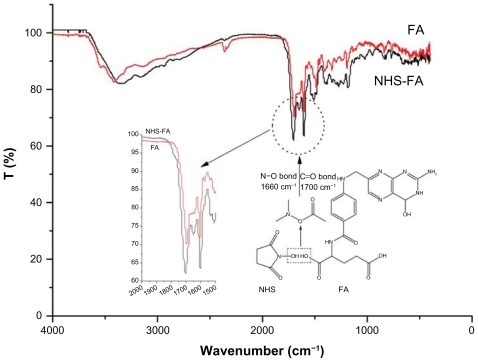
shows the FTIR spectroscopy of FA and NHS-FA. NHS-FA presents two remarkable absorption peaks at 1660 cm−1 due to the N–O bond, and 1700 cm−1 because of the C=O bond. This phenomenon proves that FA has been successfully transferred into NHS-FA. These results are accorded with Zhao’s report.Citation32
Figure 2 The FTIR spectroscopy figure of NHS-FA compared with FA.
Notes: NHS-FA presents two remarkable absorption peaks at 1660 cm−1 due to the N–O bond, and at 1700 cm−1 because of the C=O bond. This phenomenon proves that FA has been successfully transferred into NHS-FA.
Abbreviations: FA, Folate; NHS-FA, N-hydroxysuccinimide ester of folate; NHS, N-hydroxysuccinimide.
The UV absorption spectroscopy of FA-CS
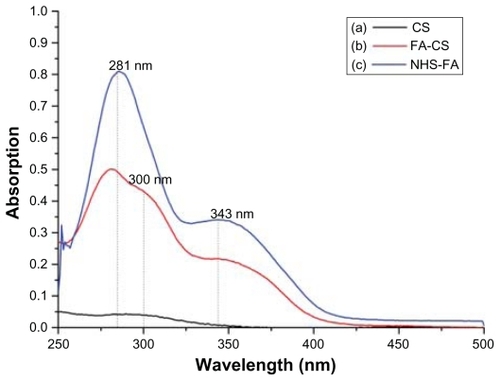
shows the UV absorption spectroscopy of CS, FA-CS and NHS-FA. CS has an extremely weak absorption peak at 300 nm, whereas NHS-FA has a strong absorption peak at 281 nm and a weak absorption peak at 343 nm. The absorption peaks of FA-CS at 281 nm and 343 nm confirmed the successful conjugation of NHS-FA with CS. Furthermore, according to the calibration curve of the NHS-FA: y = 0.04580× − 0.01668, R2 = 0.9999 (x: NHS-FA concentration, μg/mL; y: absorption), then the amount of NHS-FA conjugation was 45.85 mg/g CS.
Figure 3 Determination of NHS-FA conjugation with CS.
Notes: (a) CS has an extremely weak absorption peak at 300 nm. (b) FA-CS has three absorption peaks, at 281 nm, 300 nm, and 343 nm, respectively. (c) NHS-FA has a strong absorption peak at 281 nm and a weak absorption peak at 343 nm.
Abbreviations: CS, chitosan; FA-CS, the folate-conjugated chitosan; NHS-FA, N-hydroxysuccinimide ester of folate.
Statistical analysis
Particle size plays a key role in determining the decentralization of FA-Oli-CSNPs in vivo and easier access into cancer cells.Citation33 The DLR is another important factor of drug delivery system. So the MPS and DLR of the resulting FA-Oli-CSNPs were used as response variables.
The results were analyzed by using MINITABTM release 15 statistical software as shown in . The main effects and interactions between factors were determined. The effect of a factor is the change in response, here, MPS and DLR, produced by a change in the level of a factor, FA-CS concentration, Oli-A concentration, mass ratio of FA-CS to TPP, TPP concentration, and crosslinking time from lower to higher levels. The codified model employed for 22 factorial designs was
where A0 represents the global mean and Ai represents the regression coefficient corresponding to the main factor effects and interactions. The net effects, regression coefficients, standard errors, standardized effects (t) and P are shown in . The net effect is different between the responses of two levels (high and low level) of factors; the regression coefficients are obtained by dividing the net effects by two. t-values are obtained by dividing the regression coefficients by standard error coefficient.Citation33 P-value is the probability value that is used to determine the effects in the model that are statistically significant. The significance of the data is judged by its P-value being closer to zero (0.00). For a 95% confidence level the P-value should be less than or equal to 0.05 for the effect to be statistically significant. The main effects represent deviations of the average between high and low levels for each one of them. When the effect of a factor is positive, responses (MPS and DLR) increase as the factor is changed from low to high levels. In contrast, if the effects are negative, a reduction in responses occurs for high level of the same factor. Substituting the regression coefficients in Equationequation (5)(5) we get the model equation relating the level of parameters and responses:
Table 3 Estimated effects and coefficients for MPS and DLR (coded units)
Student’s t-test
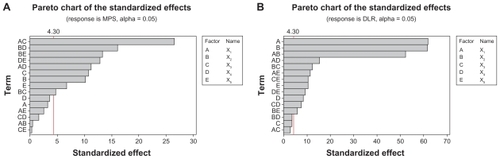
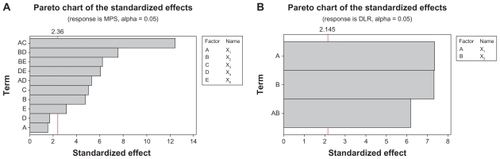
The Pareto chart () gives the relative importance of the individual and interaction effects. Student’s t-test was conducted to determine whether the calculated effects were significantly different from zero and these values for each effect are shown in the Pareto chart by horizontal columns. For a 95% confidence level and 16 degrees of freedom t-value is equal to 4.30. The vertical line in the chart indicates the minimum statistically significant effect magnitude for 95% confidence level.
Figure 4 Pareto chart of the standardized effects for (A) MPS and (B) DLR – full model.
Abbreviations: MPS, mean particle size; DLR, drug loading rate.
Analysis of variance (ANOVA)
In the sum of squares used to estimate the factors’ effects and F-ratios are shown. Since F0.05, 1, 2 = 18.5, all the effects with F value higher than 18.5 are significant. The effects are statistically significant when P-value, defined as the smallest level of significance leading to rejection of null hypothesis, is less than 0.05.
Table 4 Analysis of variance for MPS and DLR using adjusted SS for tests
Based on the student’s t-test and F-test, few interaction effects which seem insignificant compared to other effects, were neglected and the net effects, regression coefficients, standard error and P-value were recalculated with remaining variables. Resultant values are shown in . shows the student’s t-test results. For the MPS, the magnitude of effects of each factor and their interactions were found to increase in the following order: FA-CS concentration × mass ratio of FA-CS to TPP > Oli-A concentration × TPP concentration > Oli-A concentration × crosslinking time > TPP concentration × crosslinking time > FA-CS concentration × TPP concentration > mass ratio of FA-CS to TPP > Oli-A concentration > crosslinking time. For the DLR, the increasing order of the effects is given by: FA-CS concentration > Oli-A concentration > FA-CS concentration × Oli-A concentration. Namely, reduced model equation with resultant coefficients was
Table 5 Estimated effects and coefficients for MPS and DLR – reduced model
Figure 5 Pareto chart of the standardized effects for (A) MPS and (B) DLR – reduced model.
Abbreviations: MPS, mean particle size; DLR, drug loading rate.
The reduced model ANOVA and F-test and were performed and results of ANOVA are given in . Lack of fit associated elimination of few factors was FMPS = 7.58. This was very much lower compared to tabulated value F0.05, 7, 2 = 19.4. Therefore, these factors did not have statistical significance. The residues should also be examined for normal distribution.
Table 6 Analysis of variance for MPS and DLR – reduced model
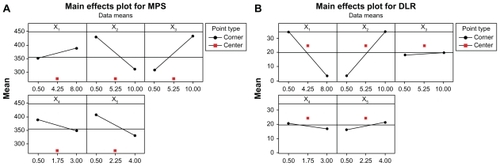
Main effects plot
The main effects plot is shown in for MPS and DLR. It indicates the relative strength of effects of various factors. A main effect is present when the mean response changes across the level of a factor. The sign of the main effect indicates the directions of the effect. It can be seen from that for MPS and DLR, the effect of Oli-A concentration was characterized by a greater degree of departure from the overall mean. The concentration of Oli-A had a negative effect on the MPS, decreasing with increasing concentration from 0.5 to 10 mg/mL. So, high concentration favors generating a smaller particle. However, the concentration of Oli-A had a positive effect on the DLR, increasing with increasing concentration from 0.5 to 10 mg/mL. One possible reason is that FA-CS nanoparticles have more opportunity of loading the Oli-A with a high concentration. For MPS, the mass ratio of FA-CS to TPP showed a great positive effect, increasing with increasing the mass ratio from 0.5 to 10. So, low mass ratio favors forming a smaller particle. But crosslinking time had a slight negative effect. For DLR, the concentration of FA-CS was found to have a great negative effect with increasing concentration from 0.5 to 8 mg/mL. So, high DLR can be easily obtained at low concentration of FA-CS. All other factors showed a slight effect on the MPS and DLR.
Figure 6 Main effects plot for (A) MPS and (B) DLR.
Abbreviations: MPS, mean particle size; DLR, drug loading rate.
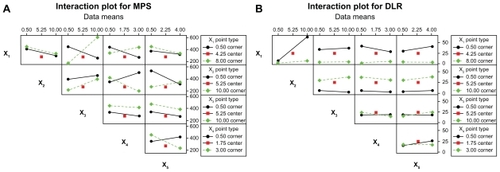
Interaction effects plot
The interaction effects plots are shown in for MPS and DLR. The plots provide the mean response of two factors at all possible combinations of their settings. If the lines are not parallel, it is an indication of interaction between the two factors.Citation34 For MPS, FA-CS concentration and mass ratio of FA-CS to TPP showed great antagonistic effects, under the condition of FA-CS concentration of 8.00 mg/mL, the MPS decreased with decreasing mass ratio of FA-CS to TPP from 10 to 0.50. On the contrary, when FA-CS concentration of 0.50 mg/mL was used, the MPS increased at decreasing mass ratio of FA-CS to TPP. Oli-A concentration and TPP concentration, Oli-A concentration and crosslinking time, TPP concentration and crosslinking time, and FA-CS concentration and TPP concentration produced minor interaction effects on the MPS. For DLR, interaction effects between FA-CS concentration and Oli-A concentration showed that the DLR was lower at Oli-A concentration of 0.50 mg/mL than at Oli-A concentration of 10.00 mg/mL. Other interactions showed no prominent features on two response variables.
Figure 7 Interaction plot for (A) MPS and (B) DLR.
Abbreviations: MPS, mean particle size; DLR, drug loading rate.
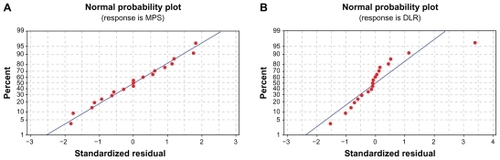
Normal probability plot of residuals
One of the key assumptions for the statistical analysis of data from experiments is that the data come from a normal distribution. Citation34 The normality of the data can be checked by plotting a normal probability plot of the residuals. If the points on the plot fall fairly close to a straight line, then the data are normally distributed.Citation34 The normal probability plot of MPS and DLR is shown in . It can be seen that the points fall fairly close to the straight line. Therefore, the data from the experiments come from a normally distributed population.
Figure 8 Normal probability plot of residual values for (A) MPS and (B) DLR.
Abbreviations: MPS, mean particle size; DLR, drug loading rate.
Verification studies
Optimum values of the variables were obtained by mathematical analyses using MINITABTM release 15 statistical software and were based on the criterion of desirability. The optimized formulation was achieved with 0.5 mg/mL FA-CS, 10.00 mg/mL Oli-A, 7.87 FA-CS/TPP (w/w), 2.55 mg/mL TPP, and 3.79 hours crosslinking time. The predicted responses were displayed with the MPS of 150.0 nm, DER of 18.4%, DLR of 62.6%, ZP of 23.6 mV and the desirability of 0.846. The FA-Oli-CSNPs with the MPS of 182.6, DER of 17.3%, DLR of 58.5%, and ZP of 24.6 mV were obtained by the verification experiments.
Morphology of FA-Oli-CSNPs
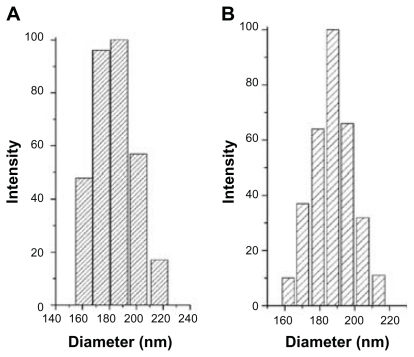
Original Oli-A, FA-CS and FA-Oli-CSNPs were observed by scanning electron microscopy. Raw Oli-A particles are irregular lamelliform crystals (). shows the surface characteristic of FA-CS powder, which displays in the agglomeration state. Meanwhile, FA-Oli-CSNPs gained under optimum conditions were uniform and spherical with MPS of 182.6 nm () approximately. The corresponding data about the quantitative changes of the particle size, namely, the particle size distributions of FA-Oli-CSNPs which were determined by dynamic laser light scattering are shown in .
Figure 9 Comparison of SEM images of original Oli-A, FA-CS and FA-Oli-CSNPs. (A) Irregular lamelliform crystals of raw Oli-A particles. (B) FA-CS lyophilized powder. (C) FA-Oli-CSNPs dispersed with deionized water. (D) FA-Oli-CSNPs containing mannitol dispersed with deionized water.
Abbreviations: Oli-A, oligomycin-A; FA-CS, folate-conjugated chitosan; FA-Oli-CSNPs, folate-conjugated chitosan nanoparticles which encapsulate oligomycin-A.
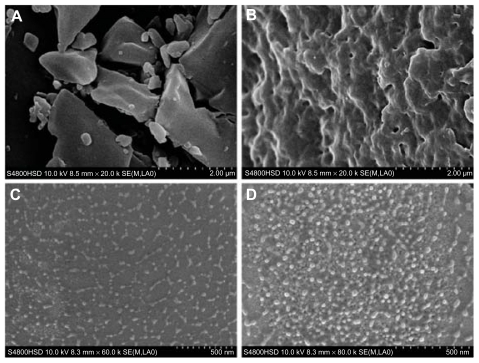
Figure 10 The particle size distributions of FA-Oli-CSNPs which were determined by DLS. (A) FA-Oli-CSNPs dispersed with deionized water. (B) FA-Oli-CSNPs containing mannitol dispersed with deionized water.
Abbreviations: FA-Oli-CSNPs, folate-conjugated chitosan nanoparticles which encapsulate oligomycin-A; DLS, dynamic laser light scattering.
Drug release of FA-Oli-CSNPs
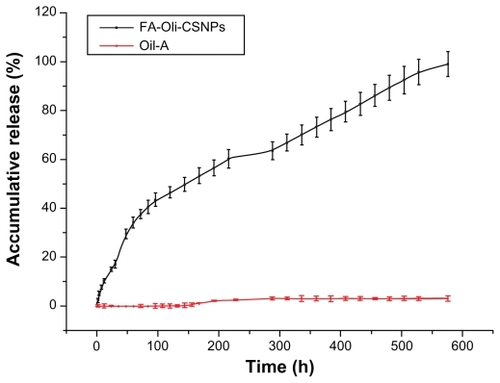
The FA-Oli-CSNPs in the drug release experiment had a DER of 17.3% and a DLR of 58.5%, respectively. shows the release profiles of raw Oli and FA-Oli-CSNPs in vitro over 576 hours. The drug carrier system had a burst release in 12 hours and a slow release up to 576 hours, releasing approximately 10% and 90% of Oli-A, respectively. At the same time, the release rate of raw Oli was very slow under the same release conditions. These facts indicated FA-Oli-CSNPs had a better solubility in water compared with raw Oli. The possible explanation for these discrepancies could be that Oli loaded in FA-Oli-CSNPs may exist in an amorphous formation, which can improve the solubility of compounds. The generally sustained and controlled release profile of Oli facilitates the application of nanoparticles for the delivery of anticancer drugs.Citation34
Figure 11 FA-Oli-CSNPs accumulative drug release profile.
Abbreviation: FA-Oli-CSNPs, folate-conjugated chitosan nanoparticles which encapsulate oligomycin-A.
Conclusion
The 2-LFD analysis has been successfully applied to optimize the procedure for the preparation of FA-Oli-CSNPs. FA-Oli-CSNPs with a MPS of 182.6 nm was obtained under optimum conditions of FA-CS concentration of 0.5 mg/mL, Oli-A concentration of 10.00 mg/mL, mass ratio of FA-CS to TPP of 7.87 (w/w), TPP concentration of 2.55 mg/mL, and crosslinking time of 3.79 hours by MINITABTM release 15 statistical software, respectively. Under these optimum conditions, DER, DLR, and ZP were 17.3%, 58.5%, and 24.6 mV, respectively. The amount of FA conjugation was 45.9 mg/g CS. The FA-Oli-CSNPs showed sustained-release characteristics for 576 hours in vitro. Oli-A has a definite effect on CML. CS nanoparticles with a particle size of less than 200 nm have passive targeting to the cancer cell. The drug delivery systems conjugating FA have active targeting to the CML cell with high expression of FA surface receptors.Citation35 So, we can infer that the FA-Oli-CSNPs should have a good therapeutic effect in vitro and in vivo.
Disclosure
The authors report no conflicts of interest in this work.
Acknowledgments
The authors are grateful for the comments and careful corrections made by anonymous reviewers. The authors would also like to acknowledge the financial support from 948 Project of the State Forestry Administration of China (2010-4-20), the Special Fund for Forestry Scientific Research in the Public Interest (2010040072), and the Agricultural Science and Technology Achievements Transformation Fund Programs of the Ministry of Science and Technology (2011GB23600016).
References
- KiharaTKusakabeHNakamuraGSakuraiTIsonoKCytovaricin, a novel antibioticJ Antibiot (Tokyo)198134107310747319923
- KobayashiKNishinoCOhyaJOligomycin E, a new antitumor antibiotic produced by Streptomyces sp. MCI-2225J Antibiot (Tokyo)198740105310573624067
- TanakaYOmuraSAgroactive compounds of microbial originAnnu Rev Microbiol19934757878257109
- EnomotoYShiomiKMatsumotoAIsolation of a new antibiotic oligomycin G produced by Streptomyces sp. WK-6150J Antibiot (Tokyo)20015430831311372788
- LeistMSingleBCastoldiAFKühnleSNicoteraPIntracellular adenosine triphosphate (ATP) concentration: a switch in the decision between apoptosis and necrosisJ Exp Med1997185148114869126928
- KobayashiHLinPCNanotechnology for antiangiogenic cancer therapyNanomedicine (Lond)20061172217716205
- LeeJMYanagawaJPeeblesKASharmaSMaoJTDubinettSMInflammation in lung carcinogenesis: new targets for lung cancer chemoprevention and treatmentCrit Rev Oncol Hematol20086620821718304833
- GrunerBAWeitmanSDThe folate receptor as a potential therapeutic anticancer targetInvest New Drugs19981620521910360600
- GuoWLeeRLReceptor-targeted gene delivery via folate-conjugated polyethylenimineAAPS PharmSci19991E1911741215
- LiHLuYPiaoLTargeting human clonogenic acute myelogenous leukemia cells via folate conjugated liposomes combined with receptor modulation by all-trans retinoic acidInt J Pharm2010402576320883757
- RossJFChaudhuriPKRatnamMDifferential regulation of folate receptor isoforms in normal and malignant tissues in vivo and in established cell lines. Physiologic and clinical implicationsCancer199473243224437513252
- ZhengYSongXDarbyMPreparation and characterization of folate-poly(ethylene glycol)-grafted-trimethylchitosan for intracellular transport of protein through folate receptor-mediated endocytosisJ Biotechnol2010145475319770010
- DosioFArpiccoSStellaBBrusaPCattelLFolate-mediated targeting of albumin conjugates of paclitaxel obtained through a heterogeneous phase systemInt J Pharm200938211712319712735
- LiFQSuHWangJPreparation and characterization of sodium ferulate entrapped bovine serum albumin nanoparticles for liver targetingInt J Pharm200834927428217870261
- ZhaoDZhaoXZuYPreparation, characterization, and in vitro targeted delivery of folate-decorated paclitaxel-loaded bovine serum albumin nanoparticlesInt J Nanomedicine2010566967720957218
- HejaziRAmijiMChitosan-based gastrointestinal delivery systemsJ Control Release20038915116512711440
- MitraSGaurUGhoshPCMaitraANTumour targeted delivery of encapsulated dextran-doxorubicin conjugate using chitosan nanoparticles as carrierJ Control Release20017431732311489513
- AgnihotriSAMallikarjunaNNAminabhaviTMRecent advances on chitosan-based micro-and nanoparticles in drug deliveryJ Control Release200410052815491807
- FeltOBuriPGurnyRChitosan: a unique polysaccharide for drug deliveryDrug Dev Ind Pharm1998249799939876553
- IllumLChitosan and its use as a pharmaceutical excipientPharm Res199815132613319755881
- SinglaAKChawlaMChitosan: some pharmaceutical and biological aspects – an updateJ Pharm Pharmacol2001531047106711518015
- LeeDWYunKSBanHSChoeWLeeSKLeeKYPreparation and characterization of chitosan/polyguluronate nanoparticles for siRNA deliveryJ Control Release200913914615219567259
- TongHQinSFernandesJCLiLDaiKZhangXProgress and prospects of chitosan and its derivatives as non-viral gene vectors in gene therapyCurr Gene Ther2009949550219807649
- CarusoFCarusoRAMohwaldHNanoengineering of inorganic and hybrid hollow spheres by colloidal templatingScience1998282111111149804547
- JiangPBertoneJFColvinVLA lost-wax approach to monodisperse colloids and their crystalsScience200129145345711161193
- LeeRJLowPSDelivery of liposomes into cultured KB cells via folate receptor-mediated endocytosisJ Biol Chem1994269319832048106354
- TeotiaSLataRGuptaMNChitosan as a macroaffinity ligand purification of chitinases by affinity precipitation and aqueous two-phase extractionsJ Chromatogr A20041052859115527124
- SonvicoFCagnaniARossiAFormation of self-organized nano-particles by lecithin/chitosan ionic interactionInt J Pharm2006324677316973314
- BaoHLiLZhangHInfluence of cetyltrimethylammonium bromide on physicochemical properties and microstructures of chitosan-TPP nanoparticles in aqueous solutionsJ Colloid Interface Sci200832827027718840381
- WangSLYaoHHGuoLLSelection of optimal sites for TGFB1 gene silencing by chitosan-TPP nanoparticle-mediated delivery of shRNACancer Genet Cytogenet200919081419264227
- LiQPreparation, characterization and targeting of micronized 10-hydroxycamptothecin-loaded folate-conjugated human serum albumin nanoparticles to cancer cellsInt J Nanomedicine2011639740521499429
- ZhaoXiuhuaProcess Optimization Studies of 10-Hydroxycamptothecin (HCPT)-Loaded Folate-Conjugated Chitosan Nanoparticles by SAS-Ionic Crosslink Combination Using Response Surface Methodology (RSM)Applied Surface Science2011
- AntonyJDesign of experiments for engineers and scientists2003Butterworth-HeinemannOxford; Burlinton, MA1 online resource x152
- ZuYZhangYZhaoXZhangQLiuYJiangROptimization of the preparation process of vinblastine sulfate (VBLS)-loaded folate-conjugated bovine serum albumin (BSA) nanoparticles for tumor-targeted drug delivery using response surface methodology (RSM)Int J Nanomedicine2009432133320054435
- YangFJinCJiangYLiposome based delivery systems in pancreatic cancer treatment: From bench to bedsideCancer Treat Rev20113763364221330062