Abstract
Background
Carbon nanotubes (CNTs) are novel materials with considerable potential in many areas related to nanomedicine. However, a major limitation in the development of CNT-based therapeutic nanomaterials is a lack of reliable and reproducible data describing their chemical and structural composition. Knowledge of properties including purity, structural quality, dispersion state, and concentration are essential before CNTs see widespread use in in vitro and in vivo experiments. In this work, we describe the characterization of several commercially available and two in-house-produced CNT samples and discuss the physicochemical profiles that will support their use in nanomedicine.
Methods
Eighteen single-walled and multi-walled CNT raw materials were characterized using established analytical techniques. Solid CNT powders were analyzed for purity and structural quality using thermogravimetric analysis and Raman spectroscopy. Extinction coefficients for each CNT sample were determined by ultraviolet-visible near infrared absorption spectroscopy. Standard curves for each CNT sample were generated in the 0–5 μg/mL concentration range for dispersions prepared in 1,2-dichlorobenzene.
Results
Raman spectroscopy and thermogravimetric analysis results demonstrated that CNT purity and overall quality differed substantially between samples and manufacturer sources, and were not always in agreement with purity levels claimed by suppliers. Absorbance values for individual dispersions were found to have significant variation between individual single-walled CNTs and multi-walled CNTs and sources supplying the same type of CNT. Significant differences (P < 0.01) in extinction coefficients were observed between and within single-walled CNTs (24.9–53.1 mL·cm−1·mg−1) and multi-walled CNTs (49.0–68.3 mL·cm−1·mg−1). The results described here suggest a considerable role for impurities and structural inhomogeneities within individual CNT preparations and the resulting spectroscopic properties of their dispersions.
Conclusion
Raw CNT materials require thorough analytical workup before they can be used as nanoexcipients. This applies especially to the determination of CNT purity, structure, and concentration. The results presented here clearly demonstrate that extinction coefficients must be determined for individual CNT preparations prior to their use.
Introduction
Tailored nanomaterials have become increasingly important in the development of targeted medical therapies and pharmaceutical products. As a result of their nanoscale dimensions, the physicochemical properties for the individual molecules of these materials can differ considerably compared with the bulk material from which they are obtained. The exceptionally high surface areas associated with many nanoparticles provide them with an increased capacity to carry combinations of active targeting agents simultaneously, moieties that increase plasma half-life, and structures to facilitate controlled drug release. Properties related to molecular surfaces, such as surface charge density and hydrophobicity, can also provide a platform for formulating delivery vehicles tailored to drugs with low solubility or difficulties with in vitro and in vivo drug stability. Incorporating nanomaterials, such as carbon nanotubes (CNTs), into pharmaceutical formulations can result in enhanced biodistribution and pharmacokinetic properties, increasing the efficacy of a therapeutic product and potentially reducing unwanted side effects.Citation1
In the past decade, CNTs have emerged as promising and potentially versatile materials in the field of nanomedicine.Citation2–Citation5 CNTs are seamless cylinders of graphene sheets which, depending on the number of individual graphene layers, can be classified as either single-walled or multi-walled CNTs. A significant research effort is currently being devoted to determining the feasibility of CNTs for use in the development of nanomedicines.Citation2,Citation6,Citation7 However, cross-comparison of the CNT preparations used by many of these research groups is impeded by a persistent absence of standardized protocols for evaluating CNTs as excipients. While the underlying structure of CNTs is relatively simple, the materials themselves can differ tremendously depending on the synthesis technique and purification treatments used during their manufacture.Citation8–Citation11 The combination of ill-defined standardization protocols and a high degree of variability in manufacturing and purification procedures complicate the determination and design of a single set of CNT standards.Citation12
In recognition of the rapidly growing field of nanomedicine, the US Food and Drug Administration (FDA) formed a Nanotechnology Task Force in 2006. The central aim of this task force was the determination of critical regulatory issues related to the approval of pharmaceutical products containing nanomaterials such as CNTs.Citation13,Citation14 While no additional guidelines or regulatory requirements have been released for formulations containing nanoparticles, thorough physicochemical characterization of all constituents in these products is essential for FDA approval.Citation15–Citation17 Basic physicochemical characterization includes, but is not limited to, characterization of structure, composition, quality, purity, and reproducibility of nanoparticle synthesis.
In this work, we describe the characterization of several commercially sourced and in-house-produced single-walled CNT and multi-walled CNT bulk samples with respect to their structure, purity, and solution properties using thermogravimetric analysis (TGA), Raman spectroscopy, and ultraviolet-visible near infrared absorption spectroscopy. We observed that the overall quality of CNTs, including their reported purity, homogeneity, and solubility, differs significantly among the samples tested. These results clearly demonstrate that the physicochemical characteristics of CNTs, in particular their absorption properties, differ in regard to the CNT type and source, and even vary within individual samples. The progression of CNT-based nanomedicine formulations into a clinical setting will be dependent on enhanced characterization of their physicochemical and toxic properties as it relates to their use as bulk excipients.Citation18–Citation20
Materials and methods
Materials
1,2-dichlorobenzene (DCB), Chromasolv® 99% purity grade, was purchased from Sigma-Aldrich (Oakville, ON, Canada). Single- walled CNTs and multi-walled CNTs with a manufacturer reported purity of >95% were purchased from several suppliers, ie, NanoIntegris Inc (Skokie, IL), Cheap Tubes Inc (Brattleboro, VT), NanoLab Inc (Newton, MA), and Unidym Inc (Sunnyvale, CA). See for a list and nomenclature of all 18 CNT samples and their properties as provided by the suppliers.
Table 1 Properties of commercial carbon nanotubes as provided by suppliers
Synthesis of multi-walled CNT samples 11 and 12
In-house multi-walled CNTs (denoted MWNT 11 and MWNT 12) were synthesized via a catalytic chemical vapor deposition procedure in an SSP-354 synthesizer (Nanotech Innovations, Betatek Inc, Toronto, ON, Canada) under inert gas (argon 1 L/minute) conditions. A precursor CNT solution (Nanotech Innovations) was injected at a flow rate of 7.5 mL/hour, and the product was deposited onto a quartz cylindrical process tube. The process tube had two heating zones, ie, zone 1, set to 225°C, and zone 2, set to 700°C. Upon cooling of the process tube, the deposited multi-walled CNT material was collected from zone 2 of the tube by careful scraping. A vial (25 mL) of precursor solution yielded about 200 mg of multi-walled CNTs. This synthesized CNT material was used without any further purification.
Thermogravimetric analysis
TGA of CNT powders was obtained in duplicate or triplicate using a Q500 TGA instrument (TA Instruments, Grimsby, ON, Canada). Sample masses analyzed ranged between 1 mg and 2 mg of CNT, as determined by the TGA instrument. Platinum pans with samples were first equilibrated to 30°C, and then heated to 800°C at a rate of 10°C/minute. An oxidizing environment was maintained inside the chamber by the introduction of air at a flow rate of 25 mL/minute.
Raman spectroscopy
CNTs were characterized in their dry state using a Senterra Dispersive Raman Spectrometer (Bruker Optics, Milton, ON, Canada), with a 532 nm Nd:YAg laser at room temperature. The laser beam was focused onto the sample with a 20× objective and data were collected from 70–3700 cm−1 at a power of 20 mW. All spectral analyses were performed using OPUS 6.0 software (Bruker Optics). Spectra were taken from three separate regions of the powder sample and overall average spectra were generated.
Preparation of CNT dispersions
Stock CNT solutions (approximately 0.05 mg/10 mL) were prepared using an XP6U ultra microbalance (sensitive to 0.1 μg) equipped with a universal antistatic kit (Mettler Toledo, Toronto, ON, Canada). Approximately 1 mL of DCB was added to a vial containing the bulk CNT material, followed by analytical transfer to a 20 mL scintillation vial, rinsing to ensure complete transfer of all the CNT material with a final volume of 8.5 mL. The CNT dispersion was sonicated in a bath sonicator for 500 minutes and fully dispersed CNT solutions were transferred to a 10 mL volumetric flask and the volume was brought up to 10 mL with DCB.
Ultraviolet-visible near infrared spectrophotometry
All absorption studies were performed using a SpectraMax ultraviolet-visible near infrared spectrophotometer (Molecular Devices, Sunnyvale, CA). Scans in the range of 200–1000 nm were collected every 10 nm. All DCB CNT samples were analyzed immediately after preparation using acrylic 96-well plates (Corning Inc, Corning, NY) with a 200 μL sample volume. For analysis, measurements were taken at a 500 nm wavelength with a 0.596 cm path length. For each of the 18 CNT samples, five independent CNT DCB stock solutions, were prepared according to the procedure described above. Standard curves composed of seven concentration points were generated for each independent stock solution. From each stock solution, three independent sets of standards were prepared, resulting in a standard curve representing the average absorption intensity of 15 measurements.
Statistical evaluation
Raw absorption data and average extinction coefficients were evaluated using one-way analysis of variance followed by a Tukey multiple comparison post-test statistical analysis (with a 95% confidence interval) using GraphPad Prism software (v 4; GraphPad Software Inc, San Diego, CA).
Results and discussion
Evaluating the effectiveness of CNT-based pharmaceutical formulations in treated cells or organisms requires the consideration of several parameters related to CNT concentration and dose. These include properties, such as CNT dimensions, surface topology, structural defects, and extent of impurities present in the samples. Often these pharmaceutically relevant specifications are provided by the manufacturer, but there is no standardized testing methodology or requirement for the reporting of these values or relative interbatch consistency. We feel this lack of reporting is most obvious when addressing the determination of extinction coefficients for CNT materials, which are required for the calculation of accurate CNT concentrations in suspension.
The aim of this study was to characterize CNT materials employing standard analytical techniques that are generally accessible in most nanomaterial laboratories. We subjected CNT materials to analysis by TGA, Raman spectroscopy, and ultraviolet-visible near infrared absorption spectroscopy in order to assess their quality as pharmaceutical excipients efficiently and to compare our values with manufacturer specifications. Techniques such as TGA provide information about the amount of impurity and residual metal catalyst remaining in synthesized CNTs, which is very important when addressing toxicological considerations.Citation21 While TGA can also provide information regarding coarse CNT structure,Citation22 it must be evaluated in combination with additional data obtained from Raman spectroscopy. Raman spectroscopy itself is an indispensable technique for the qualitative and structural characterization (extent of defect sites) of CNTs and, most specifically, the determination of single-walled CNT diameter. Citation23 Finally, the determination of extinction coefficients for each CNT material using ultraviolet-visible near infrared absorption spectroscopy provides a critical parameter for reliable CNT concentration determination.
To facilitate a rational selection of candidates from the large variety of commercially available single-walled CNT and multi-walled CNT materials, we defined four basic pharmaceutically applicable requirements, ie, ≤50 nm outer diameter,Citation24 relatively narrow diameter distribution, ≤20 μm length,Citation4,Citation24–Citation28 and 95% by weight structural purity (samples contained at least 95% CNTs by weight). Based on the fulfillment of these four basic parameters, we purchased 16 CNT materials from several manufacturers (), and to evaluate noncommercial sources, we synthesized two multi-walled CNT samples using a commercially available instrument.
Thermogravimetric analysis
TGA yields measurements of sample weight change as a function of temperature under a controlled atmosphere. In air, amorphous carbon burns at 200°C–400°C while CNTs decompose at far higher temperatures, typically 800°C.Citation22 Compositional purity of CNT samples can be assessed by quantification of the residual mass (ash content) remaining after heating the samples to 800°C.Citation21 illustrates combustion characteristics, ash content, and oxidation temperature for each of the single-walled CNT and multi-walled CNT materials we examined. Of the total 18 CNT samples used for this study, single-walled CNT samples 5 and 6 (NanoIntegris Isonanotubes-S and -M) were not subjected to TGA because the required sample size was cost prohibitive. Experimentally determined residual ash content for single-walled CNT samples 1, 3, and 4 as well as multi-walled CNT samples 1–4 can be compared with those reported by the corresponding suppliers (, gray columns). As shown, single-walled CNT sample 3 was found to have a slightly lower ash content than reported, while single-walled CNT samples 1 and 4 and multi-walled CNT samples 1–4 yielded a higher value than claimed by the suppliers. In general, it was found that 10 of the 16 samples had an ash content ≤ 5%. The residual masses for multi-walled CNT samples 12, 10, 9, 8, and 5 (NanoLab) and single-walled CNT sample 1 (CheapTubes) were clearly higher than previously reported. Of special concern was single-walled CNT sample 1, which demonstrated an exceedingly high difference between the manufacturers claimed ash content of less than 1.5% and our measured ash content of 38%. As produced, multi-walled CNT samples 11 and 12 (synthesized in-house) showed a high oxidation temperature indicative of a relatively low density of defect sites and 5%–7.5% ash content ().
Figure 1 Ash content and oxidation temperature of carbon nanotubes. The ash content and oxidation temperature for four single-walled carbon nanotubes and twelve multi-walled carbon nanotubes was experimentally determined using thermogravimetric analysis. Ash content is illustrated in the histogram, and oxidation temperature is in the scatter plot. Experimentally determined thermogravimetric analysis values (black bars or dots) are contrasted to the manufacturers’ reported values, where available (gray bars or dots).
Abbreviations: SWNT, single-walled carbon nanotubes; MWNT, multi-walled carbon nanotubes.
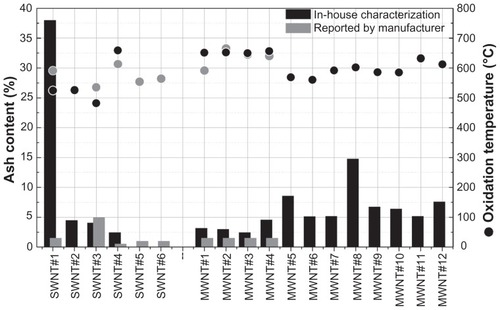
In all multi-walled CNT samples, an initial mass loss of approximately 5% at temperatures from 200°C to 400°C was observed (data not shown). This loss can be attributed to decomposition of polyaromatic fragments and amorphous carbon species, suggesting that the purity of most samples was ≥95%. However, single-walled CNT samples 1–4 showed a higher mass loss (about 10%) before the nanotube oxidation temperature, corresponding to a lower fraction of CNT and higher amorphous carbon content in the total carbon material (data not shown).
Ash content generally represents the amount of oxidized metal catalyst remaining in CNT samples following their synthesis. Metal content in CNTs is considered an impurity that can significantly affect the pharmacological properties of these nanomaterials, potentially resulting in undesired toxic effects. It is important to note that the manufacturer/supplier statements about CNT purity can be misleading because they sometimes refer only to overall carbonaceous content and not to the actual nanotube content of the material.
Multi-walled CNTs generally decompose at temperatures higher than those for single-walled CNTs due to their multilayered structure.Citation21 Accordingly, we observed higher oxidation temperatures for all multi-walled CNT samples. However, CNT oxidation temperature can also be affected by structural defects in the nanotube sidewalls. A higher density of defect sites suggests that the structural quality of multi-walled CNT samples 1–4 is higher as compared with multi-walled CNT samples 5, 6, 9, and 10, which had lower oxidation temperatures. This observation can be explained by manufacturer claims that the latter two samples are bamboo-like multi-walled CNTs for which a higher number of structural defects is expected. The influence of the structural composition in the nanotube material on the oxidation temperature is also evident in the observation of higher than expected oxidation temperatures for single-walled CNT samples 4–6 (NanoIntegris materials, ) which may be a result of their high levels of purity and crystalline structure, as suggested by a very low ID/IG ratio in the Raman analysis ().Citation29
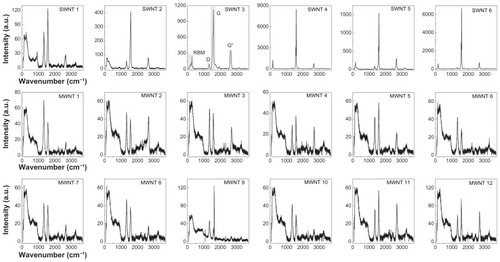
Figure 2 Raman spectra of multi-walled and single-walled carbon nanotubes. Dry powder samples of six single-walled carbon nanotubes and twelve multi-walled carbon nanotubes were analyzed using Raman spectroscopy at a wavelength of 532 nm. Spectra are shown as Raman intensity as a function of wavenumber (cm−1), where characteristic peaks representing the radial breathing mode, D-band, G-mode, and G’-mode for a typical carbon nanotube Raman spectrum are shown in panel 3 (single-walled carbon nanotube sample 3).
Abbreviations: SWNT, single-walled carbon nanotubes; MWNT, multi-walled carbon nanotubes.
Raman spectroscopy
Raman spectroscopy is a common technique for the qualitative characterization of CNT structural parameters, particularly of single-walled CNTs. Raman spectroscopy can provide detailed information regarding both the purity of a CNT sample as well as structural information, including diameter distribution, electronic structure, and chirality of a single-walled CNT sample.Citation23 Several scattering modes dominate the Raman spectrum of CNTs. These modes include the radial breathing mode (RBM) in the low wavenumber range (about 100–300 cm−1), which results from low-energy radial vibrations of carbon atoms in the nanotube lattice,Citation30 where all the carbon atoms are moving in-phase out of plane in the radial direction, the G-mode (about 1600 cm−1), a tangential vibrational mode characteristic to all graphitic materials, neighboring atoms move in opposite directions along the surface of the tube as in two dimensional graphite, the dispersive disorder-induced D-band (at wavenumbers below the G-mode) indicating the presence of defective sites in the single-walled CNT lattice, where C–C bonds are sp3-hybridized instead of the regular sp2 hybridization, and the G′-mode (at wavenumbers above the G-mode), representing a second-order related harmonic of the D-mode.Citation31
Unfortunately, many of the characteristic properties that are present in the Raman spectra of single-walled CNTs are not as evident when studying multi-walled CNTs. As a result of the ensemble average over all inner tube diameters, the Raman signals are generally broadened and the RBM signal from large diameter multi-walled CNTs is usually too weak to be observed.Citation31 For these samples, high resolution microscopic methods, such as transmission electron microscopy or atomic force microscopy, must be employed to obtain information about CNT diameters.
Raman spectra of CNT powders were used to evaluate the dimensions and structural purity of CNTs (). These spectra represent averaged data from 18 different dry CNT powders, obtained from excitation at a 532 nm laser wavelength. The spectra of single-walled CNT samples consistently demonstrated a much higher Raman intensity as compared with multi-walled CNT samples. The highest Raman intensities as well as lowest noise and sharpest features are observed for NanoIntegris samples (single-walled CNT samples 4–6) indicative of high nanotube quality and purity. Of notable exception, single-walled CNT sample 1 exhibited a very low overall Raman intensity and the spectral features compare more with those of the multi-walled CNT samples. This result suggests that this sample also contained a high fraction of multi-walled CNTs, which agrees with our observation of lower structural purity from the TGA analysis ().
Structural quality
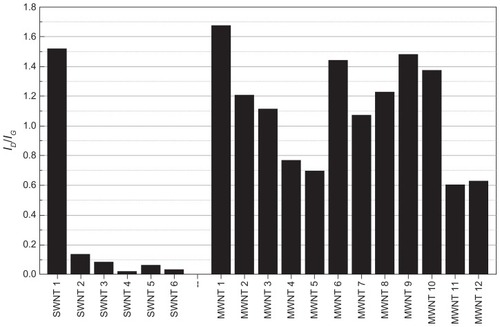
The intensity ratio of the Raman D-band to G-band is often used to estimate the density of structural defects in CNTs, providing a relative measure for the structural quality of a sample.Citation21,Citation32 If both of these bands are similar in intensity, the density of structural defects is assumed to be high. illustrates the band intensity ID/IG ratios for all CNT samples, where a lower ratio indicates fewer defects and therefore higher structural quality. We observed the highest structural quality in single-walled CNT samples 4, 5, and 6, all of which were obtained from NanoIntegris. We consistently observed a considerably higher ID/IG ratio for all purchased multi-walled CNTs, which is indicative of a greater number of structural defects, most likely resulting from their growth in multiple graphite layers, whereas the in-house produced multi-walled CNT samples 11 and 12 had the lowest ID/IG ratio of all the multi-walled CNT samples, indicating generally higher structural quality. As previously observed in the TGA () and Raman () data, single-walled CNT sample 1 exhibited a considerably higher defect density than any of the other single-walled CNT samples, leading to the conclusion that single-walled CNT sample 1 contains a higher fraction of multi-walled CNTs. For the bamboo-like multi-walled CNT samples 9 and 10, we expected a high number of surface defects due to the particular structure of these nanotubes, which is confirmed by their high ID/IG ratio and slightly lower oxidation temperatures in TGA measurements. In all of the other CNT samples we examined, similar ID/IG ratio correlations are not as evident.
Figure 3 Structural quality of carbon nanotube samples. ID/IG band intensity ratios were determined from the Raman spectra of all single-walled and multi-walled carbon nanotube samples. A lower ID/IG ratio (shorter bars) indicates fewer defects and therefore higher structural quality. Due to the limitations of this method, the higher observed values for the multi-walled carbon nanotube samples is not necessarily indicative of a higher number of defects.
Abbreviations: SWNT, single-walled carbon nanotubes; MWNT, multi-walled carbon nanotubes.
Diameter estimation of single-walled CNT samples
Within the characteristic Raman modes of single-walled CNTs, the RBM is of special interest, because the frequency ω̄RBM at which the radial vibrations of the C–C bonds occur are strongly correlated with the tube diameter, dt, with ω̄RBM = C1/dt + C2.Citation31 The constants, C1 and C2, have to be determined experimentally because they depend on the synthesis process and aggregation state of individual single-walled CNTs.Citation31,Citation33 Values reported in literature for the parameter C1 vary among experiments, and any independent confirmation for values of C2 are lacking.Citation34 Using the most pronounced RBM-related peaks in the single-walled CNT spectra, we have calculated the diameters of the single-walled CNTs for 15 different pairs of C1 and C2. The respective average diameter for each single-walled CNT sample is listed in and is compared with the diameter reported by the suppliers. In addition to the C1 and C2 parameters obtained in our results, we also used the commonly adopted parameters for C1 = 223.5 cm−1 · nm and C2 = 12.5 cm−1, which have previously been reported for HiPco single-walled CNTs.Citation35 In our analysis, we found that the calculated average diameter values for each of the CNT samples corresponded well with the dimensions reported by suppliers. Furthermore, using different sets of parameters for C1/C2 to calculate the diameters from the observed RBM peaks did not significantly affect our results.
Table 2 Comparison of SWNT diameters as reported by manufacturer and determined experimentally through Raman spectroscopy
Because Raman scattering in CNTs is a resonant process, only those CNTs for which one of the bandgaps is equal to the energy of the excitation laser contribute to the RBM in a spectrum.Citation36 Since all known synthesis routes yield a range of electronic typesCitation31,Citation33 that are distributed around a mean tube diameter,Citation24 the excitation wavelength must be varied to obtain a full picture of all single-walled CNT diameters present in a sample.Citation36 It is also well established that the bundling and aggregation of CNTs will result in shifted peak positions. Thus, the determination of single-walled CNT diameters from Raman spectra is afflicted with inaccuracies when not performed on well dispersed single-walled CNT suspensions. Consequently, results obtained from the dried CNT powders should be considered a first estimate of the dimensions of nanotubes present in an unknown sample and are only used to compare with manufacturer specifications.
Ultraviolet-visible near infrared absorption spectroscopy and standard CNT curves
Ultraviolet-visible near infrared spectroscopy is a standard analytical technique to determine the presence and concentration of a material in solution. Using Beer–Lambert’s law (A = ɛ · c · l) and a calibration curve generated with known concentrations (c), the extinction coefficient (ɛ) can be determined from the slope of the curve, and a known path length (l).
Dispersion in DCB
As a consequence of the hydrophobic nature of graphene sidewalls and the strong π-π interactions between individual tubes, pristine CNTs have a strong tendency to aggregate and are practically insoluble in most solvents. Using CNTs for pharmaceutical applications raises a concern with regards to proper dispersion, and consequently accurate determination of concentration. Therefore, ultraviolet-visible near infrared absorbance will be highest only for maximally exfoliated CNTs.Citation37 If dispersed CNTs reaggregate over the course of an experiment, absorbance values will gradually decrease affecting the accuracy of the experiment. It has previously been demonstrated that single-walled CNTs show the highest solubility in organic solvents such as DCB, and in order to maximize dispersability of CNTs, we chose this solvent for our ultraviolet-visible near infrared absorption experiments.Citation38
We have used a specific strategy to obtain well dispersed CNTs in the organic solvent DCB, avoiding reaggregation and ensuring proper determination of absorbance values. In order to achieve a CNT concentration in DCB below the solubility limit in our stock solution, a very small amount of approximately 50 μg CNT material was used for dispersion. The stock CNT DCB solutions had a final concentration of approximately 0.05 mg/10 mL and were sonicated in a bath sonicator while monitoring the absorption at a wavelength of 500 nm. Using this method, an optimal sonication time of 8 hours was established, which ensured that a maximum ultraviolet-visible near infrared absorbance value was measured.
Extinction coefficients of CNTs in DCB
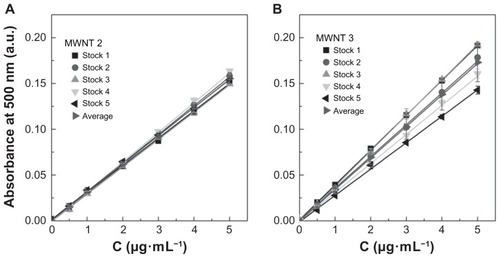
From each of the stock CNT solutions, seven independent standards were prepared in triplicate and measured using a 96-well plate. shows the average standard curves for all of the 18 CNT samples. Each of the seven data points in these standard curves represents an average of 15 independent measurements and shows linearity, with R2 values between 0.9902 and 0.9999. lists the average extinction coefficients for single-walled CNTs and multi-walled CNTs, which range between 24.9 and 54.2 mL·cm−1·mg−1 and 49.0 and 68.3 mL·cm−1·mg−1, respectively.
Table 3 Average extinction coefficients (ɛave, with corresponding variation) of carbon nanotubes in 1,2-dichlorobenzene
Figure 4 Experimentally determined average standard curves of carbon nanotube dispersions in 1,2-dichlorobenzene. Absorbance values for a seven-point dilution series of carbon nanotube samples was measured using an ultraviolet-visible near infrared spectrophotometer at a wavelength of 500 nm. Average absorbance values for (A) the six single-walled carbon nanotubes (P < 0.05), (B) six NanoLab multi-walled carbon nanotubes (P > 0.05) and (C) four Cheaptubes multi-walled carbon nanotubes (P > 0.05), and our two inhouse multi-walled carbon nanotubes (P > 0.05).
Note: P values were calculated using one-way analysis of variance with a Tukey multiple comparison post-test for n = 15 at a 95% confidence value.
Abbreviations: SWNT, single-walled carbon nanotubes; MWNT, multi-walled carbon nanotubes.
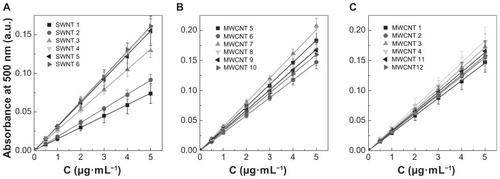
We hypothesized that experimentally determined extinction coefficients can differ greatly between different types of CNTs (single-walled CNTs vs multi-walled CNTs), CNTs with different physical properties (outer diameter, length, and purity) and CNTs synthesized using various manufacturing methods. This hypothesis was confirmed when we calculated the statistical deviation in the measured extinction coefficients for all of the CNT samples. Extinction coefficients for single-walled CNT samples 1 and 2 were significantly different from all other single-walled CNTs (P < 0.05) and multi-walled CNTs (P < 0.001), but were not significantly different from each other. The extinction coefficient for single-walled CNT sample 3 (HiPco) was different from most of the multi-walled CNT samples (3, 4, 6, 7, 8, and 9, P < 0.01). Among the multi-walled CNTs, sample 1 was significantly different from multi-walled CNT samples 4, 5, 6, and 8, while multi-walled CNT sample 6 differed significantly from all six single-walled CNTs and nine of the MWNTs (P < 0.05). Interestingly, we observed that the extinction coefficient for NanoLab multi-walled CNT sample 6 was significantly different when compared with multi-walled CNT sample 2, which had a similar diameter of 30 nm (P < 0.001), but did not show significant differences when compared with multi-walled CNT samples 3 and 4 (Cheaptubes, diameters 30–80 nm). Other significant differences in the extinction coefficients included multi-walled CNT sample 1 when compared with multi-walled CNT samples 4 and 8 (P < 0.05), and multi-walled CNT sample 5 versus multi-walled CNT sample 8 (P < 0.05), which are from the same manufacturer, and have the same reported outer diameter.
The results presented in also clearly demonstrate that absorbance values can differ significantly when comparing single-walled CNTs with multi-walled CNTs and when comparing different manufacturing sources of the same types of CNTs. Statistical analysis indicated that absorbance values for single-walled CNT samples 1 and 2 were significantly different from the other single-walled CNT samples (P < 0.001) and all other multi-walled CNT samples (P < 0.01). The difference between the 12 multi-walled CNT samples was not significant (P > 0.05) within the full concentration range, but at the higher concentrations (5 μg/mL), multi-walled CNT samples 5, 6, and 8 showed differences from the other multi-walled CNTs. This could indicate that during preparation of the higher concentration samples, taking larger volumes from the original stock solutions can introduce increased error if the sample is not completely homogeneous. This further implies that when analyzing unknown CNT samples these types of transfer errors can lead to an overestimation or underestimation of CNT concentrations by up to 30%–40%. This is illustrated by the standard curves presented in for two representative samples, ie, multi-walled CNT samples 2 and 3, which have similar specifications for synthetic method and purification and are from the same manufacturer (Cheaptubes). The relative standard deviation on precision (repeatability) for the full concentration range in multi-walled CNT sample 2 is <3.5%, whereas in multi-walled CNT sample 3 it is <11.4%. According to TGA analysis () and Raman spectra (), both samples are equal in purity and structural quality. However, while multi-walled CNT sample 2 emerges as a rather homogenous material with an average extinction coefficient of 51.4 ± 2.9 mL·cm−1·mg−1 relating to a percentage deviation of 5.6%, multi-walled CNT sample 3 with a similar extinction coefficient of 58.0 ± 7.3 mL·cm−1·mg−1 shows higher heterogeneity with 12.6% deviation. The coefficient of variation values for the average extinction coefficients in (ranging between 4% and 18%) are partly an indication of the variability in sampling due to heterogeneity within each CNT material. The heterogeneity of each CNT sample is important when considering the pharmaceutical quality of a CNT sample. Once acceptable limits have been established, some CNT samples would have to be rated unsuitable because the material may be too heterogeneous for proper evaluation.
Figure 5 Experimental standard curves of multi-walled CNT sample 2 and multi-walled CNT sample 3 dispersions in 1,2-dichlorobenzene. Experimentally determined seven-point standard curves of five different stock solutions and an average curve were determined using an ultraviolet-visible near infrared spectrophotometer at a wavelength of 500 nm. Cheaptubes multi-walled carbon nanotube sample 2 in 1,2-dichlorobenzene (P > 0.05) (A) and Cheaptubes multi-walled carbon nanotube sample 3 in 1,2-dichlorobenzene (P > 0.05) (B). Multi-walled carbon nanotube sample 2 had an average extinction coefficient of 51.4 ± 2.9 mL·cm−1· mg−1 and a percentage deviation of 5.6%, meanwhile multi-walled carbon nanotube sample 3 had an average extinction coefficient of 58.0 ± 7.3 mL· cm−1· mg−1 with 12.6% deviation. Note: P values were calculated using one-way analysis of variance with a Tukey multiple comparison post-test for n = 15 at a 95% confidence value.
Abbreviations: SWNT, single-walled carbon nanotubes; MWNT, multi-walled carbon nanotubes.
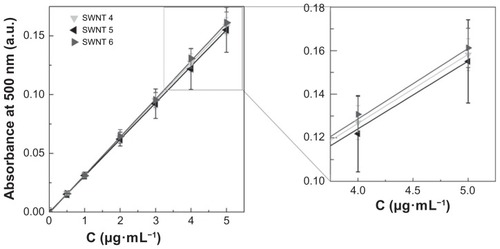
Variability in ultraviolet-visible near infrared absorbance and hence the experimental extinction coefficient, can also originate from different structural compositions, physicochemical properties, and impurities in the final CNT material. These differences are a consequence of synthesis procedures and purification methods. Looking closer at the NanoIntegris single-walled CNTs, samples 4 (Puretubes), 5 (Isonanotubes-M), and 6 (Isonanotubes-S), we can observe a slight but clear influence of electronic type on the extinction coefficient (). Depending on the chiral vector, a single-walled CNT can be either metallic or semiconducting, and as a consequence, a single-walled CNT sample normally consists of approximately one-third metallic and two-thirds semiconducting nanotubes.Citation39 Single-walled CNT samples 5 and 6 are purified CNTs according to their electronic type, with the former being metallic and the latter semiconducting single-walled CNTs. Single-walled CNT sample 4 is the nanotube material prior to separation according to these two electronic types. The ratio of 1:2 of metallic to semiconducting single-walled CNTs in single-walled CNT sample 4 is well reflected in the standard curves presented in . The standard curve of single-walled CNT sample 4 is an exact superposition of the standard curves of single-walled CNT samples 5 and 6 in a ratio of 1:2, respectively. Correspondingly, the average extinction coefficients () of single-walled CNT sample 4 can be obtained by simple weighed addition of single-walled CNT samples 5 and 6 with 51.7 mL·cm−1·mg−1 · 1/3 + 54.2 mL·cm−1·mg−1 · 2/3 equals to 53.4 mL·cm−1·mg−1 (with the experimental value for single-walled CNT sample 4 being 53.1 ± 2.9mL·cm−1·mg−1).
Figure 6 Experimental standard curves of single-walled carbon nanotube sample 4–6 dispersions in 1,2-dichlorobenzene. Experimentally determined seven-point average standard curves of NanoIntegris single-walled carbon nanotube samples 4–6 (P > 0.05) were determined using an ultraviolet-visible near infrared spectrophotometer at a wavelength of 500 nm. The inset shows the standard curve at higher concentration for better comparison. The standard curve of single-walled carbon nanotube sample 4 is an exact superposition of the standard curves of single-walled carbon nanotube samples 5 and 6 in a ratio of 1:2, respectively (representing the structural composition of single-walled carbon nanotube sample 4).
Note: P values were calculated using one-way analysis of variance with a Tukey multiple comparison post-test for n = 15 at a 95% confidence value.
Abbreviations: SWNT, single-walled carbon nanotubes; MWNT, multi-walled carbon nanotubes.
When attempting to compare extinction coefficients determined here with those found in the literature, we discovered that there is a general misconception regarding the validity of previously calculated values, and many research groups incorrectly apply these extinction coefficients to their specific nanotube system. For example, the extinction coefficient for HiPco single-walled CNT in DCB was calculated by Bahr et al to be 28.6 mL·cm−1·mg−1 at 500 nm,Citation38 as compared with our experimentally determined value of 43.8 mL·cm−1·mg−1 for single-walled CNTs also produced by the HiPco method but by a different manufacturer. The extinction coefficient value published by Bahr et alCitation38 was subsequently used by three different groups to analyze single-walled CNT dispersions in micelles,Citation40 single-walled CNTs in aqueous solutions,Citation41 and multi-walled CNTs dispersed in surfactants.Citation42 Since the different diameter, purity, chirality type, and solvent effects may alter the value of the extinction coefficient significantly, this value must be determined for each CNT material exclusively.
Conclusion
In this study, TGA, Raman spectroscopy, and ultraviolet-visible near infrared absorbance spectroscopy were used to characterize and compare sixteen different commercially available and two noncommercial CNT materials. Our aim was to assess the level of purity and quality of these materials for potential incorporation in pharmaceutical formulations. Of particular interest, we determined extinction coefficients for single-walled CNT and multi-walled CNT dispersions in DCB as a standard solvent.
In summary, we found that each CNT raw material requires a thorough pharmaceutical workup to be valid and accurate before it can be used in in vitro or in vivo experiments. Ultraviolet-visible near infrared absorbance analysis identified a significant variation in extinction coefficients depending on the source, CNT type, single-walled CNT electronic type, and manufacturing process. These results clearly demonstrated that there is no one single extinction coefficient that can be universally applied to all types of CNTs, and it is critical to use the appropriate extinction coefficient for each CNT material to ensure reliable concentration determination. Furthermore, we also observed that some CNT materials exhibited considerable inhomogeneities, resulting in significant variations in the extinction coefficients calculated from the same CNT batch.
Because CNTs from different sources can be synthesized using a variety of techniques, all of which are known to yield fairly inhomogeneous materials that contain many impurities, their characterization proves to be a persistent hurdle in the identification and selection of approved standards. It is worth mentioning that, for now, most efforts are dedicated to single-walled CNT standards, and the first National Institute of Standards and Technology (NIST)-certified single-walled CNT material is anticipated to be available at the earliest in 2012 (B Simard, personal communication). Several organizations such as NISTCitation43 and the International Organization for Standardization,Citation12 as well as other research groups,Citation44 have been working on the development of a compendium of standardized measurements and protocols for the characterization of single-walled CNTs and multi-walled CNTs. In addition to the analytical techniques presented here, the recommended techniques for CNT characterization also include transmission electron microscopy, scanning electron microscopy, energy-dispersive X-ray analysis, near infrared photoluminescence spectroscopy, evolved gas analysis–gas chromatography–mass spectrometry, measurement of moisture content, ash content, metallic constituents, volatile content, polyaromatic hydrocarbon content, and carbon materials.Citation12
While time-consuming, rigorous physicochemical characterization is necessary to obtain well defined CNTs, especially in the scope of biomedical and pharmaceutical applications. The quality of CNT materials used in experiments to assess their effects in biological systems is clearly important. The specific degree of chemical and defined structural purity needs to be considered carefully to obtain relevant results. The knowledge of accurate concentration values is essential to reproducible dosing and measurement of observed effects. The overall level of accuracy needed for all physicochemical parameters mentioned will depend on the width of an excipient’s function-toxicity window. This is a concept similar to a drug-therapeutic window, which defines the concentration range for an active ingredient that is expected to be clinically effective without unwanted side effects. There is an urgent need for the definition of standardized guidelines for pharmaceutical grade CNTs, to encourage and enable manufacturers to offer high quality CNT materials that are suitable for incorporation in pharmaceuticals and other medicinal products.
Acknowledgments
This paper was supported by grants from the Canadian Institutes of Health Research and the Natural Sciences and Engineering Research Council of Canada to MF. The generous support of the Canada Research Chairs Program, the Canada Foundation for Innovation, and the Ontario Research Fund for MF is also gratefully acknowledged. CL acknowledges funding through a mobility scholarship from the Wilhelm Macke Foundation (Johannes Kepler University Linz).
Disclosure
The authors report no conflicts of interest in this work.
References
- VauthierCCouvreurPNanotechnology: Intelligent design to treat complex diseasePharm Res20062371417145016779701
- LiuZTabakmanSWelsherKDaiHJCarbon nanotubes in biology and medicine: in vitro and in vivo detection, imaging and drug deliveryNano Res2009228512020174481
- KlingelerRSimRBCarbon nanotubes for biomedical applications1st edBerlin, GermanySpringer2010
- LacerdaLBiancoAPratoMKostarelosKCarbon nanotube cell translocation and delivery of nucleic acids in vitro and in vivoJ Mater Chem20081811722
- WeiWSethuramanAJinCMonteiro-RiviereNANarayanRJBiological properties of carbon nanotubesJ Nanosci Nanotechnol20074–571284129717450891
- LacerdaLBiancoAPratoMKostarelosKCarbon nanotubes as nanomedicines: from toxicology to pharmacologyAdv Drug Deliv Rev200658141460147017113677
- YangWRThordarsonPGoodingJJRingerSPBraetFCarbon nanotubes for biological and biomedical applicationsNanotechnology200718412001
- DaiHJNanotube growth and characterizationDresselhausMSDresselhausGAvourisPHCarbon Nanotubes: Synthesis, Structure, Properties, and ApplicationsNew YorkSpringer2001
- DresselhausMSDaiHCarbon nanotubes: Continued innovations and challengesMRS Bull2004294237239
- SinnottSBAndrewsRCarbon nanotubes: Synthesis, properties, and applicationsCrit Rev Solid State Mater Sci2001263145249
- ZhouWBaiXWangEXieSSynthesis, structure, and properties of single-walled carbon nanotubesAdv Mater2009214545654583
- IchimuraSCurrent activities of ISO TC229/WG2 on purity evaluation and quality assurance standards for carbon nanotubesAnal Bioanal Chem2010396396397119894038
- US Food and Drug Administration2011 Available from: http://www.fda.gov/ScienceResearch/SpecialTopics/Nanotechnology/NanotechnologyTaskForce/default.htmAccessed August 16, 2011
- FDA Nanotechnology Regulatory Science Program Science Board Presentation August 2010US Food and Drug Administration2010 Available from: http://www.fda.gov/downloads/AdvisoryCommittees/CommitteesMeetingMaterials/ScienceBoardtotheFoodandDrugAdministration/UCM222536.pdfAccessed August 18, 2011
- Guidance for IndustryContent and format of investigational new drug applications (INDs) for phase 1studies of drugs, including well-characterized, therapeutic biotechnology-derived productsFood and Drug Administration1995 Available from: http://www.fda.gov/downloads/Drugs/GuidanceComplianceRegulatoryInformation/Guidances/UCM071597.pdfAccessed August 16, 2011
- Guidance for Industry, Investigators, and ReviewersExploratory IND StudiesFood and Drug Administration2006 Available from: http://www.fda.gov/downloads/Drugs/GuidanceComplianceRegulatoryInformation/Guidances/UCM078933.pdfAccessed August 16, 2011
- BawaRRegulating nanomedicine – can the FDA handle it?Curr Drug Deliv20118322723421291376
- FoldvariMBagonluriMCarbon nanotubes as functional excipients for nanomedicines: I. pharmaceutical propertiesNanomedicine20084317318218550451
- FoldvariMBagonluriMCarbon nanotubes as functional excipients for nanomedicines: II. Drug delivery and biocompatibility issuesNanomedicine20084318320018550450
- FoldvariMFormulating nanomedicines: Focus on carbon nanotubes as novel nanoexcipientsKey Eng Mater20104415374
- MansfieldEKarAHookerSAApplications of TGA in quality control of SWCNTsAnal Bioanal Chem201039631071107720016881
- PangLSKSaxbyJDChatfieldSPThermogravimetric analysis of carbon nanotubes and nanoparticlesJ Phys Chem1993972769416942
- JorioAPimentaMASouzaAGSaitoRDresselhausGDresselhausMSCharacterizing carbon nanotube samples with resonance Raman scatteringNew J Phys20035139
- KamNWSLiuZADaiHJCarbon nanotubes as intracellular transporters for proteins and DNA: An investigation of the uptake mechanism and pathwayAngew Chem Int Ed Engl200645457758116345107
- BeckerMLFaganJAGallantNDLength-dependent uptake of DNA-wrapped single-walled carbon nanotubesAdv Mater2007197939
- ChaudhuriPHarfoucheRSoniSHentschelDMSenguptaSShape effect of carbon nanovectors on angiogenesisACS Nano20104157458220043662
- JinHHellerDASharmaRStranoMSSize-dependent cellular uptake and expulsion of single-walled carbon nanotubes: single particle tracking and a generic uptake model for nanoparticlesACS Nano20093114915819206261
- MuQXBroughtonDLYanBEndosomal leakage and nuclear translocation of multi-walled carbon nanotubes: developing a model for cell uptakeNano Lett20099124370437519902917
- Nano-IntegrisHigh mobility semiconducting inks using single-walled carbon nanotubes Available from: http://www.nanointegris.com/en/about-our-productsAccessed November 9, 2011
- EklundPCHoldenJMJishiRAVibrational modes of carbon nanotubes – spectroscopy and theoryCarbon1995337959972
- DresselhausMSDresselhausGSaitoRJorioARaman spectroscopy of carbon nanotubesPhysics Reports-Review Section of Physics Letters200540924799
- DillonACYudasakaMDresselhausMSEmploying Raman spectroscopy to qualitatively evaluate the purity of carbon single-wall nanotube materialsJ Nanosci Nanotechnol20044769170315570946
- HellerDABaronePWSwansonJPMayrhoferRMStranoMSUsing Raman spectroscopy to elucidate the aggregation state of single-walled carbon nanotubesJ Phys Chem B20041082269056909
- ReichSThomsenCMaultzschJVibrational propertiesCarbon Nanotubes: Basic Concepts and Physical PropertiesWeinheim, GermanyWiley-VCH2004
- BachiloSMStranoMSKittrellCHaugeRHSmalleyREWeismanRBStructure-assigned optical spectra of single-walled carbon nanotubesScience200229856022361236612459549
- DresselhausMSJorioASouzaAGDresselhausGSaitoRRaman spectroscopy on one isolated carbon nanotubePhysica B20023231–41520
- GrossiordNSchootPMeuldijkJKoningCEDetermination of the surface coverage of exfoliated carbon nanotubes by surfactant molecules in aqueous solutionLangmuir20072373646365317311428
- BahrJLMickelsonETBronikowskiMJSmalleyRETourJMDissolution of small diameter single-wall carbon nanotubes in organic solventsChem Commun20012193194
- LouieSGElectronic properties, junctions, and defects of carbon nanotubesDresselhausMSDresselhausGAvourisPCarbon Nanotubes: Synthesis, Structure, Properties and ApplicationsHeidelberg, GermanySpringer2001
- TatonTAKangYJMicelle-encapsulated carbon nanotubes: A route to nanotube compositesJ Am Chem Soc2003125195650565112733901
- IkedaAHamanoTHayashiKKikuchiJWater-solubilization of nucleotides-coated single-walled carbon nanotubes using a high-speed vibration milling techniqueOrg Lett2006861153115616524291
- RastogiRKaushalRTripathiSKSharmaALKaurIBharadwajLMComparative study of carbon nanotube dispersion using surfactantsJ Colloid Interface Sci2008328242142818848704
- ArepalliSFreimanSWHookerSMiglerKDMeasurement Issues in Single-Wall Carbon NanotubesGaithersburg, MDNational Institute of Standards and Technology2008
- NikolaevPArepalliSGorelikOProtocol for the characterization of single-wall carbon nanotube material qualityCarbon2004428–917831791