Abstract
Objective
Mural inflammation has been shown to contribute to the development of plaque, with the αVβ3 integrin highly expressed in atherosclerotic plaques. We herein examined αVβ3 integrin expression as a function of carotid atherosclerosis formation in the apolipoprotein E-deficient (apoE−/−) mouse.
Methods and results
Constrictive collars were placed around the left common carotid arteries of apo E−/− mice maintained on a high-fat diet (n = 14). Before and 21 days following collar placement, in vivo serial magnetic resonance imaging (MRI) measurements of the carotid aortic diameter were performed using a 7T magnetic resonance (MR) scanner. Near- infrared fluorescence (NIRF) imaging was performed (n = 6) using an in vivo imaging system 0–24 hours following administration of 1.0 nmol c(RGDyK)-Cy5.5 via the tail vein. A competition experiment was performed by the co-injection of a saturating dose of bicyclic RGD peptide H-Glu[cyclo(Arg-Gly-Asp-D-Tyr-Lys)]2 (n = 3). Following image acquisition and sacrifice at 24 hours after injection, carotid arteries were harvested for histological analyses. Neointima formation and arterial remodeling in the carotid arteries of apoE−/− mice were induced by the placement of a constrictive collar. Significantly greater fluorescent signals were obtained from constrictive collar left common carotid arteries as compared to uninvolved aortic segments in constrictive collar mice. Binding to stenotic lesions was efficiently blocked in competition experiments. Immunostaining confirmed the presence of mural αVβ3 integrin expression in macrophages in the neointima. Signal intensity increased in a macrophage density-dependent fashion in the stenotic segments.
Conclusion
Mural αVβ3 integrin expression, as determined using RGD-Cy5.5 near-infrared optical imaging, was increased in carotid arteries with constrictive collars in experimental mice. This expression can estimate the macrophage-bound inflammatory activity of atherosclerotic lesions.
Introduction
Atherosclerosis is considered an inflammatory disease.Citation1 Various adhesion molecules, inflammatory cytokines, and chemokines are involved in the early initiation of atherosclerotic lesions by the recruitment of monocytes/macrophages into the subendothelial space, which is essential for the initiating stages of atherosclerotic lesion development.Citation2
Carotid artery disease, or carotid artery stenosis, is defined by the narrowing of the carotid arteries, and commonly caused by atherosclerosis, potentially leading to ischemic stroke.Citation3 In recent years, hyperlipidemic apolipoprotein E-deficient (apoE−/−) mice have emerged as a powerful tool for studying plaque formation. Von der Thüsen et al developed a model for rapid progression of atherosclerosis by placing a perivascular collar around the common carotid artery.Citation4 Researchers believe that the most reproducible site for studies of lesions in mice is the carotid artery, which is a better model for human atherosclerosis. Citation5 The initial lesions seen in this model contained mostly foam cells of monocytic origin in addition to extracellular lipid deposits.Citation4
It is well known that macrophages play a pivotal role in the pathogenesis of atherosclerosis. A strong correlation between macrophage infiltration and plaque vulnerability in recently symptomatic carotid plaques has been shown recently.Citation6,Citation7 Plaque macrophages are thought to be derived from blood monocytes, which are recruited into the arterial wall through adhesion molecules and chemokines.Citation8 αVβ3 integrin is a ubiquitous receptor expressed on a variety of cell types, including activated macrophages.Citation9 αVβ3 integrin expression is upregulated in the media and adventitia during hyperplastic responses in injured arteries.Citation10,Citation11 We postulated that αVβ3 integrin, highly expressed in macrophages, could be important during the early stages of carotid atherogenesis in apoE−/− mice.
In an effort to examine mural inflammation monitoring as a marker for disease formation, we herein tested the ability of in situ and ex vivo c(RGDyK)-Cy5.5 near-infrared fluorescence imaging (NIRF) to identify αVβ3 integrin expression in the atherosclerotic carotid artery.
Materials and methods
Animals
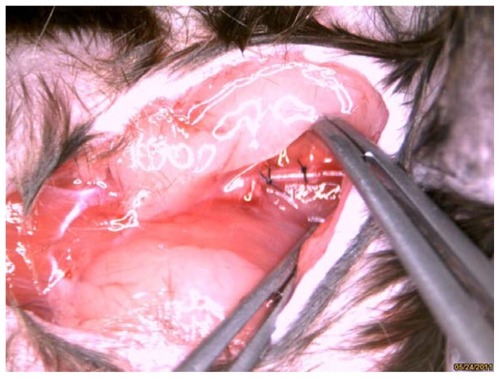
The study complied with standards for the care and use of laboratory animals (Laboratory Animal Center, Southeast University, Nanjing, China). Male apoE−/− mice (n = 14), obtained from the Laboratory Animal Center, Peking University Health Science Center, Beijing, China), were fed a Western diet, containing 0.15% cholesterol and 21% fat. Following 4 weeks of diet feeding, carotid artery plaque formation was induced by perivascular collar placement in the mice, as described previously.Citation4 Collars (PE0402; length 2 mm, internal diameter 0.2 mm, external diameter 0.38 mm) were made from Anilab (Ningbo, Zhejiang, China) and were positioned around the left carotid artery. The contralateral right carotid artery was sham-operated to serve as an intra-animal control ().
Figure 1 Carotid collar model is clearly visible in bright field anatomic image.
Following perivascular collar placement, all mice underwent magnetic resonance imaging (MRI) examinations to measure arterial diameter at 3, 10, and 21 days. Eleven mice were sacrificed at 22 days to confirm MRI results and in situ and ex vivo NIRF analyses. The remaining three mice were sacrificed at 21 days following collar insertion to assess αVβ3 integrin expression.
Synthesis of cyclic RGD peptide was performed as described previously.Citation12 apoE−/− mice were injected with an average of 1 nmol c(RGDyK)-Cy5.5 via the tail vein at 21 days following collar insertion. To validate tissue specificity of the probe-related fluorescence, we performed a blocking experiment in three mice. Those in the blocking experiment were each administered co-injections of 1 nmol of c(RGDyK)-Cy5.5 and 227 nM bicyclic RGD peptide H-Glu[cyclo(Arg-Gly-Asp-D-Tyr-Lys)]2 (Peptides International, Louisville, KY). The blocking peptide (H-Glu[cyclo(Arg-Gly-Asp-DPhe-Lys)]2) is a commercial product, which has been reported to possess a high affinity for αvβ3 integrin as well.Citation13 One nmol of monofunctional near-infrared dye, Cy 5.5-NHS (MW 1128, Amersham Pharmacia, Piscataway, NJ) was injected via the tail vein to test autofluorescence without RGD peptide in two mice. At 24 hours post-injection, the mice were anesthetized, and the heart, aortic arch, and both carotid arteries were dissected for detailed anatomical information of the carotid arteries. Ex vivo fluorescence images were obtained and the left stenotic carotid and contralateral right carotid arteries were embedded.
Histological examination
Following ex vivo NIRF imaging, carotid arteries were collected from sacrificed mice, immediately placed in embedding medium (optimal cutting temperature [OCT] compound, Sakura Fine Technical, Tokyo, Japan), and rapidly frozen using liquid nitrogen. Frozen sections were prepared on a Leica CM1950 Cryostat (Leica Instruments, Heidelberg, Germany) in a proximal direction for staining with hematoxylin and eosin or immunohistochemical analyses using a staining kit (Universal Elite ABC, Vector Laboratories, Burlingame, CA) according to the manufacturer’s instructions. Primary antibody against αVβ3 integrin (anti-human integrin αVβ3 CD51/CD61, R&D Systems; Minneapolis, MN, 1:200) was used for immunostaining of αVβ3 integrin.
Rat anti-mouse Mac-3, a macrophage marker (BD Biosciences Pharmingen, San Diego, CA), was used (1:100) to access the deposition of macrophages in the proximal portions of the perivascular collar placement arterial segments. Sections were incubated overnight at 4°C with the antibody against macrophages. Immunohistochemical analyses were performed according to the manufacturer’s instructions. The number of MAC-3-positive cells was counted in a double- blind fashion from four different regions of each section (n = 6) at 400× magnification. The cross-sectional areas of the proximal portions of the perivascular collar placement arterial segments were analyzed using ImageJ 1.41 software (ImageJ, NIH, Bethesda, MD). Luminal stenosis (as expressed by the intima–lumen ratio) was calculated as a percentage of the intimal area over the total area within the internal elastic lamina area.
Aortic monitoring via micro-MRI animal scanner
MRI scanning was performed at baseline, days 3, 10, and 21 following collar placement. All scanning was performed on a micro-magnetic resonance (MR) animal scanner (7.0T Bruker PharmaScans; Bruker Biospin, Ettlingen, Germany). Circular polarized 1H mouse body coil (inner diameter 35 mm) was used for MR data collection. Each mouse was induced and maintained under isoflurane anesthesia (2%) in medical-grade air and monitored using standard small animal instrument monitoring. All animals were placed in the prone position.
For MR angiography, the carotid artery tree was imaged using a three-dimensional fast low-angle shot (3D-FLASH), with a sequence (repetition time (TR) of 15 milliseconds and echo time (TE) of 2.5 milliseconds. The field of view (FOV) was 2 cm × 2 cm, and a 256 × 256 × 128 matrix was employed, yielding a voxel resolution 78 × 78 × 156 μm; flip angle (FA) was 20°; one excitation).
The carotid arteries were identified in the scout view of the coronal images. Twenty-four contiguous, 500 μm thick axial slices spanning from the neck region of the mouse were acquired using a spin echo sequence. MR images were acquired using black-blood T2 to proton density (PD) weighted multi-spin multi-echo (MSME) sequences and a dedicated mouse volume coil. Imaging parameters were as follows: TR 1237.1 milliseconds, TE 12.8/34.2 milliseconds, FOV 2.5 cm, FA was 180°, matrix size 256 × 256, and in- plane resolution 98 μm × 98 μm; slice thickness of 0.5 mm, and four excitations. The imaging acquisition time was 40 minutes per animal. Fat suppression was performed for PD and T2-weighted imaging.
Fluorescence imaging
Fluorescent images were obtained using the Maestro in vivo imaging system (CRi, Woburn, MA) at predetermined time points. For this imaging system, the excitation filter is 586–601 nm, while for the emission filter, we used a 645 nm long pass; core hardware of multispectral imaging technologies of Maestro was the liquid crystal tunable filter. It was located in the optical path of emission and ranged from 640 nm to 820 nm in 10 nm steps. This filter provides capability to users to select emission windows between 640 nm and 820 nm and was used to detect probe-related fluorescence and autofluorescence (primarily from the skin and blood vessels). The fluorescent images consisting of probe-related fluorescence and autofluorescence spectra were then organized based on their spectral patterns using Maestro Software (v 2.10.0). The meaning signals were separated using multispectral imaging technology. The measurement was carried out in gray level integration. Region of interest (ROI) analyses was performed by an investigator blinded to the experimental groups. ROIs were selected manually by drawing regions on the ex vivo NIRF images. Area ROIs were selected over the right and left carotid arteries using normalized NIRF images. Target-to-background ratios (TBRs) were defined as: (ROI values from the perivascular collar placement left arterial segments)/(ROI values from the right carotid artery).Citation14 The total signal (scaled-counts/s) within the ROI was calculated.
Fluorescence microscopy and laserscanning confocal microscopy
For confocal microscopic analyses of tissues, frozen tissues were cryosectioned into 5 μm thick sections and fixed with ice-cold acetone. Slides were incubated with a rat monoclonal anti-mouse MAC-3 antibody, washed with phosphate buffered saline (PBS); goat anti-rat IgG-FITC (Santa Cruz Biotechnology, Santa Cruz, CA) was used as the secondary antibody for visualizing macrophages. Slides were stained with 4′,6-diamidino-2-phenylindole dihydrochloride (DAPI, Sigma-Aldrich, St Louis, MO,) to visualize tissue morphology. Samples were analyzed using a confocal laser scanning microscope (Olympus FV1000; Olympus America, Center Valley, PA). Images of the Cy5.5 signals were acquired with a tunable filter automatically stepping in 10 nm increments from 580 nm to 750 nm and generated through separating autofluorescence and Cy5.5 spectra by applying normal spectral deconvolution algorithms provided by the FV1000 software.
Statistical analyses
Data were compared among experimental groups using analysis of variance (ANOVA) followed by Fisher’s protected least significant difference (PLSD). Data are expressed as mean ± standard error of the mean (SEM). Differences were considered statistically significant at a value of P < 0.05. A Pearson correlation coefficient analyses was calculated to describe the relationship between MR and histological measurements.
Results
MRI and histology both exhibit carotid stenosis
The significant lumen changes observed were monitored using 7.0T micro-MRI. There was a progressive stenosis of the left common carotid artery at 21 days following surgery ().
Figure 2 Identification of neointima formation in apoE−/− mouse using in vivo MRI and the corresponding histology. (A) Example of MR images at day 10 following perivascular collar placement. MRI of a mouse with slight stenosis of the left carotid artery. The image shows an in vivo image of a transverse section at the RCA and LCA after perivascular collar placement using MSME proton-density/T2-weighted sequences. (B) Example of MR images at day 21 following perivascular collar placement. MRI of a mouse with significant stenosis of the left carotid artery. LCA with a neointima formation reveals a stenostic lumen, white arrows indicate aortic stenosis. (C) Corresponding H&E stain obtained in a mouse at 21 days following perivascular collar placement. Representative photomicrographs showing hematoxylin and eosin stained cross sections of proximal carotid site (H&E staining, 20×). (D) Representative carotid artery tree image in mice acquired at 7 T using 3D-FLASH sequence. The longitudinal view shows the characteristic stenosis of the left carotid artery.
Abbreviations: H&E, hematoxylin-and-eosin; LCA, left carotid artery; MR, magnetic resonance; MRI, magnetic resonance imaging; MSME, multi-spin multi-echo; RCA, right carotid artery.
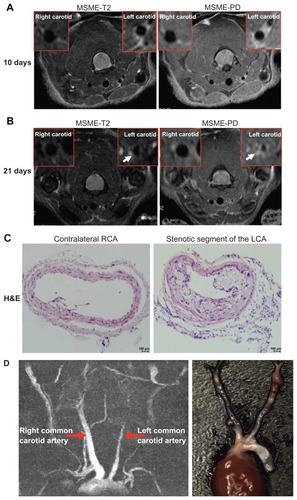
MRI provided cross-sectional images of atherosclerotic lesions in the carotid artery. Stenosis within the artery was identified on the basis of the different signal intensities in T2W, and proton density weighted (PDW) images of left carotid stenosis and confirmed using histopathology (). From days 3 to 21, there was a gradual arterial stenosis in the lumen. We observed a slight reduction in the diameter of the left common carotid artery (0.55 ± 0.05 mm, n = 6) compared to the contralateral carotid artery (0.63 ± 0.07 mm, n = 6, P = 0.051) at 10 days following placement of the collar (). We observed a significant reduction in the diameter of the left common carotid artery (0.22 ± 0.07 mm, n = 6) compared to the contralateral carotid artery (0.65 ± 0.05 mm, n = 6, P < 0.01) at 21 days following surgery (). Hematoxylin and eosin (H&E) staining, Sigma-Aldrich) showed a significant increase in intimal surface area in apoE−/− mice at 3 weeks following collar insertion (). The degree of proximal lumen stenosis was significantly higher (47.7% ± 14.7%, n = 6). A good correlation between the degree of proximal lumen stenosis and the diameter of the lumen in the MR images was observed (r = −0.953, P < 0.01). In vivo MRI accurately tracked the decreases in vessel wall diameter.
On 3D-FLASH MR images, the longitudinal view showed an example of the characteristic blood flow that was significantly decreased in the left common carotid artery compared with the contralateral artery following surgery ().
αVβ3 integrin signal intensity increases with aortic stenosis
Due to thyroid gland and salivary gland autofluorescence, the carotid artery stenosis-specific signal was hardly discernible on in vivo imaging. Ex vivo evaluation of excised carotid arteries at 24 hours post-injection showed that the c(RGDyK)- Cy5.5 was predominantly taken up by the stenotic segment of the left carotid artery, with the fluorescence intensity significantly higher than that obtained using in vivo imaging. Therefore, subsequent signal acquisition and dosimetry calculations were obtained following dissection of the carotid artery (). shows typical NIRF images of apoE−/− mice with a perivascular collar following intravenous injection of 1 nmol of c(RGDyK)-Cy5.5. Using the Maestro in vivo imaging system, signal intensity in the stenotic left carotid aortic segments was significantly higher than that obtained from the contralateral segments in the right carotid artery and a control mouse without injection. To validate the specificity of the targeting process, we performed a blocking experiment. Those in the blocking experiment were each given co-injections of 1 nmol c(RGDyK)-Cy5.5 and bicyclic RGD peptide H-Glu[cyclo(Arg-Gly-Asp-D-Tyr-Lys)]2 (227nM/mouse). Bicyclic RGD peptide H-Glu[cyclo(Arg- Gly-Asp-D-Tyr-Lys)]2 successfully reduced stenotic tissue TBRs from 117 ± 47.8 to 17.7 ± 9.5, n = 3, P < 0.05 (). In addition, Cy5.5 dye alone was injected to determine organ localization of the dye. Injection of Cy5.5 dye alone showed nonspecific binding (). We also checked the fluorescence of polyethylene tubing with the Maestro in vivo imaging system, and found no autofluorescence.
Figure 3 Ex vivo overview of whole carotid artery imaging fluorescence c(RGDyK)-Cy5.5 signal. Pseudo-color fluorescence images of stenotic carotid artery mice were acquired 24 hours following intravenous injection of c(RGDyK)-Cy5.5. (A) In situ whole carotid artery imaging fluorescence c(RGDyK)-Cy5.5 signal, red arrow shows the region of interest of the stenotic segment of the left carotid artery. (B) Ex vivo whole carotid artery imaging fluorescence c(RGDyK)-Cy5.5 signal in a control mouse, and a mouse with a stenotic segment of the left carotid artery. (C) Ex vivo whole carotid artery imaging fluorescence c(RGDyK)-Cy5.5 signal in a control mouse, and a mouse with a stenotic segment of the left carotid artery, along with a mouse with a stenotic segment of the left carotid artery coinjections of 1 nmol of c(RGDyK)-Cy5.5 and bicyclic RGD peptide H-Glu[cyclo(Arg-Gly-Asp-D-Tyr-Lys)]2 using the Maestro in vivo imaging system. Red arrows indicate signal intensity. (D) Injection of Cy5.5 dye alone showed nonspecific binding. The PE tube itself gave no signal.
Abbreviation: PE, pressure equalization.
![Figure 3 Ex vivo overview of whole carotid artery imaging fluorescence c(RGDyK)-Cy5.5 signal. Pseudo-color fluorescence images of stenotic carotid artery mice were acquired 24 hours following intravenous injection of c(RGDyK)-Cy5.5. (A) In situ whole carotid artery imaging fluorescence c(RGDyK)-Cy5.5 signal, red arrow shows the region of interest of the stenotic segment of the left carotid artery. (B) Ex vivo whole carotid artery imaging fluorescence c(RGDyK)-Cy5.5 signal in a control mouse, and a mouse with a stenotic segment of the left carotid artery. (C) Ex vivo whole carotid artery imaging fluorescence c(RGDyK)-Cy5.5 signal in a control mouse, and a mouse with a stenotic segment of the left carotid artery, along with a mouse with a stenotic segment of the left carotid artery coinjections of 1 nmol of c(RGDyK)-Cy5.5 and bicyclic RGD peptide H-Glu[cyclo(Arg-Gly-Asp-D-Tyr-Lys)]2 using the Maestro in vivo imaging system. Red arrows indicate signal intensity. (D) Injection of Cy5.5 dye alone showed nonspecific binding. The PE tube itself gave no signal.Abbreviation: PE, pressure equalization.](/cms/asset/b09462e2-5d38-47cc-853c-3be2b196f246/dijn_a_28065_f0003_c.jpg)
Accumulation of macrophages in the stenotic segment
We first explored αVβ3 integrin expression in the cross-sectional areas of the perivascular collar placement arterial segments. αVβ3 integrin expression was most apparent in the stenotic lesion areas of the left carotid artery. shows that αVβ3 integrin expression was significantly increased in the intima of the left stenotic carotid artery compared with the contralateral segment (localized to endothelial cells).
Figure 4 Accumulation of macrophages in the stenotic segment. (A) Representative micrograph of carotid artery sections stained with antibodies against αvβ3 integrin (400× magnification, scale bar = 100 μm). (B) Representative images of MAC-3 immunostaining in the stenotic lesion areas of the left carotid artery (400× magnification, scale bar = 100 μm). (C) Quantitative analyses of MAC-3-positive cells. (D) Colocalization in the proximal neointima, blue fluorescence of DAPI, the red fluorescence of Cy5.5 (probe) and the green fluorescence of FITC (macrophage) were examined (800× magnification).
Notes: Upper panel shows representative photomicrographs of cross sections of left carotid artery proximal carotid site, white arrows show positive staining. Lower panel shows representative photomicrographs of cross sections of right carotid artery.
Abbreviation: DAPI, diamidino-2-phenylindole dihydrochloride.
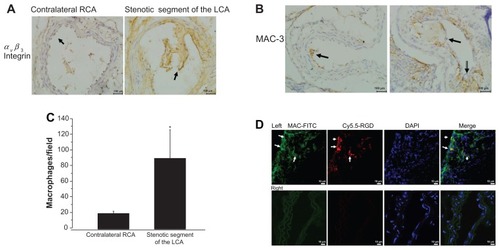
Atherosclerotic plaques were well developed in the left carotid arteries 3 weeks following placement of a constrictive collar. In contrast, no atherosclerotic plaques were found in the contralateral right carotid arteries without collar placement during the same experimental period. shows representative H&E-stained cross sections of the carotid site with neointima hyperplasia progressing at 21 days following surgery. The lesions were rich in macrophage- derived foam cells. The number of macrophages in the stenotic lesions of the left carotid artery was assayed using immunohistochemistry for the macrophage marker MAC-3. Immunohistochemistry verified that the intimal hyperplasia present in the stenotic lesions areas of the left carotid artery consisted of macrophages. Compared with the contralateral segments of the right carotid artery, neointimal lesions consisted of a greater number of macrophages (19.3 ± 3, 98 ± 31.6/high field, n = 6, P < 0.01) ().
RGD-Cy 5.5 signals colocalization with macrophage infiltration
To determine whether c(RGDyK)-Cy5.5 signals in the stenotic segments of the vascular lesions were associated with an increased number of macrophages, evidence for c(RGDyK)-Cy5.5 colocalization within the areas of MAC-3 expression was confirmed using fluorescence confol-microscopy (). More Cy5.5 fluorescence (red) and MAC-3 expression (green) were present in the stenotic segments of the left carotid artery, as compared to the right carotid aortic segments within the same animal. A positive correlation between the number of macrophages in proximal lumen stenosis and c(RGDyK)-Cy5.5 signals in the NIR fluorescence images was observed (r = 0.903, P < 0.05).
Discussion
The present study was designed to examine the influence of activated macrophages on neointima formation induced by perivascular collar placement in apoE−/− mice using NIRF imaging methods during the early stages of atherosclerosis. Our results showed that NIRF imaging with the c(RGDyK)- Cy5.5 probe consistently localized αVβ3 integrin expression with good target-to-background ratios. NIRF signal intensity was correlated well with stenosis location.
Both NIRF signal intensity and immunohistochemistry provided evidence that there was an intense accumulation of the NIRF probe c(RGDyK)-Cy5.5 in macrophages at stenotic atherosclerotic lesions. Correlation analyses demonstrated higher c(RGDyK)-Cy5.5 uptake in the stenotic atherosclerotic plaques than in the contralateral vessel wall in apoE−/− mice. The efficient blocking of c(RGDyK)-Cy5.5 in in vivo competition studies confirmed that binding was αVβ3 integrin dependent.
Plaque inflammation plays a central role in its vulnerability to future complications (eg, rupture, hemorrhage, distal emboli, and acute stenosis).Citation15 Macrophages lead to the initiation and progression of atherosclerosis, while myocytes and extracellular matrix are prevalent at advanced stages.Citation16 Twenty-one days following collar insertion, immunohistochemical analyses demonstrated that the majority of cell types in the neointima are positive for MAC-3, confirming that they were macrophages. The number of macrophages correlated well with luminal stenosis. Some studies have indicated that imaging macrophages could be a promising strategy for vulnerable plaque detection. A potential marker of inflammation and angiogenesis in atherosclerotic lesions is the αVβ3 integrin, a cell surface glycoprotein receptor expressed by macrophages and activated endothelial cells.Citation17 In our experiment, the functional activity of αVβ3 integrin was measured by c(RGDyK)-Cy5.5 and probe uptake increased in proportion to the decrease in carotid artery diameter. Waldeck et al demonstrated that macrophage-associated αvβ3 integrin expression can be visualized using NIRF reflectance imaging.Citation18 Our results are in line with the study of Waldeck et al, but there are several differences. We used apoE−/− mice and placed a perivascular collar in the carotid artery compared to directly inducing vascular lesions by carotid artery ligation. This model causes the classic atherosclerotic plaque formation in the common carotid artery. An advantage of the carotid collar model is that pathogenesis of these lesions depends on lipid accumulation as an initial stimulus rather than migration and proliferation of smooth muscle cells (SMCs).Citation4 However, αvβ3 integrin can also be expressed in neointimal vascular SMCs.Citation19 In this model, we found that most c(RGDyK)-Cy5.5 positive cells were MAC-3 positive stained. We chose the time-course dependence on the peak of the αvβ3 expression. Studies have shown that persistently high levels of αvβ3 expression were observed between 7 and 21 days following injury in the neointima, media, and adventitia, decreasing toward baseline by 28 days.Citation20,Citation21 In this study, both αvβ3 immunoreactivity and MAC-3 number increased within the stenotic segments at 21 days following perivascular collar placement. In the meantime, we used in vivo serial MRI to observe the development of carotid atherosclerosis. Our results showed a significant decrease in the carotid aortic diameter at 21 days following surgery. Ex vivo NIRF imaging confirmed the significantly increased accumulation of c(RGDyK)-Cy5.5 fluorescence.
In this experiment, in vivo imaging is affected by the limited tissue penetration ability of cyanine dye Cy5.5 dye and gland autofluorescence. The dye commonly used for optical imaging is Cy5.5. Researchers were successful only in detecting subcutaneous tumors, but were unable to noninvasively visualize U87MG glioblastoma implanted in the mouse forebrain.Citation12,Citation22 The major limitation of this dye is the limited penetration depth because of the emission maximum of Cy5.5 at 694 nm. To further optimize the NIRF RGD probes in the future, development of fluorescent dyes that have longer wavelength excitation/emission may provide deeper tissue penetration and lower autofluorescence in vivo.Citation23 The Maestro system may have some limitations for certain applications due to weak illumination. This problem may be circumvented by using other more powerful illumination NIRF systems in the future.
Another advantage of the approach used here is that MRI allows acquisition of data regarding detailed structure of the carotid artery. MRI can provide anatomical, structural, and functional characterizations of the arterial wall.Citation24 From 3 days to 3 weeks following surgery, the 7.0T experimental MR scanner offers adequate anatomic resolution for vascular morphology and signal characteristics, along with the location and size of the stenosis. At 3 weeks, MRI showed a focal wall thickening and significant luminal stenosis. However, without special contrast (such as iron oxide), we cannot see the accumulation of macrophages.Citation25
To the best of our knowledge, MRI can image deep tissues and provide detailed anatomical structures. Different MRI sequences can present different components of atherosclerotic plaques, but the sensitivity of MRI is relatively low. The application of optical nanoparticles in cardiovascular research is increasing because of the high spatiotemporal resolution and high sensitivity of optical techniques.Citation26 Some strategies, such as multimodality imaging techniques, combined with the relative advantages of MRI and optical imaging will provide complementary and reliable information that may predict rupture of unstable plaques.
In conclusion, we demonstrate our strategy of RGD-Cy5.5 near-infrared optical imaging for the detection of αVβ3 integrin expression on activated macrophages in carotid arteries with constrictive collars in experimental mice. These findings further support prior observations regarding the potential significance of αVβ3 integrin expression in the pathogenesis of atherosclerosis. αVβ3 integrin expression will serve to estimate macrophage-bound inflammatory activity of atherosclerotic lesions.
Acknowledgments
We acknowledge grant support for our laboratory from the National Natural Science Foundation of China (No 30871071, No 81070085 to Yuyu Yao) and the Basic Research Programs of the Science and Technology Commission of Jiangsu Province (No BK2010424 to Yuyu Yao). YY and YJ contributed equally to this work.
Disclosure
The authors report no conflicts of interest in this work.
References
- RossRAtherosclerosis – an inflammatory diseaseN Engl J Med199934021151269887164
- KutukOBasagaHInflammation meets oxidation: NF-kappaB as a mediator of initial lesion development in atherosclerosisTrends Mol Med200391254955714659470
- ChamblessLEFolsomARCleggLXCarotid wall thickness is predictive of incident clinical stroke: the Atherosclerosis Risk in Communities (ARIC) studyAm J Epidemiol2000151547848710707916
- von der ThüsenJHvan BerkelTJBiessenEAInduction of rapid atherogenesis by perivascular carotid collar placement in apolipoprotein E-deficient and low-density lipoprotein receptor-deficient miceCirculation200110381164117011222482
- NiMWangYZhangMAtherosclerotic plaque disruption induced by stress and lipopolysaccharide in apolipoprotein E knockout miceAm J Physiol Heart Circ Physiol20092965H1598160619286965
- RedgraveJNLovettJKGallagherPJRothwellPMHistological assessment of 526 symptomatic carotid plaques in relation to the nature and timing of ischemic symptoms: the Oxford plaque studyCirculation2006113192320232816651471
- BoyleJJMacrophage activation in atherosclerosis: pathogenesis and pharmacology of plaque ruptureCurr Vasc Pharmacol200531636815638783
- ChoHJShashkinPGleissnerCAInduction of dendritic cell-like phenotype in macrophages during foam cell formationPhysiol Genomics200729214916017244792
- AntonovASKolodgieFDMunnDHGerrityRGRegulation of macrophage foam cell formation by alphaVbeta3 integrin: potential role in human atherosclerosisAm J Pathol2004165124725815215180
- HoshigaMAlpersCESmithLLGiachelliCMSchwartzSMAlpha-v beta-3 integrin expression in normal and atherosclerotic arteryCirc Res1995776112911357586225
- BurteaCLaurentSMurariuOMolecular imaging of alpha v beta3 integrin expression in atherosclerotic plaques with a mimetic of RGD peptide grafted to Gd-DTPACardiovasc Res200878114815718174291
- ChenXContiPSMoatsRAIn vivo near-infrared fluorescence imaging of integrand alphavbeta3 in brain tumor xenograftsCancer Res200464218009801415520209
- ChenXLiuSHouYMicroPET imaging of breast cancer alphav-integrin expression with 64Cu-labeled dimeric RGD peptidesMol Imaging Biol20046535035915380745
- KlohsJGräfeMGrafKIn vivo imaging of the inflammatory receptor CD40 after cerebral ischemia using a fluorescent antibodyStroke200839102845285218635859
- O’MalleySMVavuranakisMNaghaviMKakadiarisIAIntravascular ultrasound-based imaging of vasa vasorum for the detection of vulnerable atherosclerotic plaqueMed Image Comput Comput Assist Interv20058Pt 134335116685864
- BaettaRSilvaFComparatoCPerivascular carotid collar placement induces neointima formation and outward arterial remodeling in mice independent of apolipoprotein E deficiency or Western-type diet feedingAtherosclerosis20071951e112e12417482195
- WinterPMMorawskiAMCaruthersSDMolecular imaging of angiogenesis in early-stage atherosclerosis with alpha(v) beta3-integrin-targeted nanoparticlesCirculation2003108182270227414557370
- WaldeckJHägerFHöltkeCFluorescence reflectance imaging of macrophage-rich atherosclerotic plaques using an alphavbeta3 integrin-targeted fluorochromeJ Nucl Med200849111845185118927332
- HoshigaMAlpersCESmithLLGiachelliCMSchwartzSMAlpha-v beta-3 integrin expression in normal and atherosclerotic arteryCirc Res1995776112911357586225
- SrivatsaSSFitzpatrickLATsaoPWSelective alpha v beta 3 integrin blockade potently limits neointimal hyperplasia and lumen stenosis following deep coronary arterial stent injury: evidence for the functional importance of integrin alpha v beta 3 and osteopontin expression during neointima formationCardiovasc Res19973634084289534862
- HanssonGKInflammation, atherosclerosis, and coronary artery diseaseN Engl J Med2005352161685169515843671
- ChengZWuYXiongZGambhirSSChenXNear-infrared fluorescent RGD peptides for optical imaging of integrin alphavbeta3 expression in living miceBioconjug Chem20051661433144116287239
- KovarJLJohnsonMAVolcheckWMChenJSimpsonMAHyaluronidase expression induces prostate tumor metastasis in an orthotopic mouse modelAm J Pathol200616941415142617003496
- SaamTHatsukamiTSTakayaNThe vulnerable, or high-risk, atherosclerotic plaque: noninvasive MR imaging for characterization and assessmentRadiology20072441647717581895
- MorrisJBOlzinskiARBernardREp38 MAPK inhibition reduces aortic ultrasmall superparamagnetic iron oxide uptake in a mouse model of atherosclerosis: MRI assessmentArterioscler Thromb Vasc Biol200828226527118162612
- DoumaKMegensRTvan ZandvoortMAOptical molecular imaging of atherosclerosis using nanoparticles: shedding new light on the darkness WileyInterdiscip Rev Nanomed Nanobiotechnol201134376388