Abstract
Introduction
Hydroxyapatite (HA) is the principal inorganic constituent of human bone. Due to its good biocompatibility and osteoconductivity, all kinds of HA particles were prepared by different methods. Numerous reports demonstrated that the properties of HA affected its biological effects.
Methods
Two kinds of nanohydroxyapatite with different sizes and crystallinities were obtained via a hydrothermal treatment method under different temperatures. It was found that at a temperature of 140°C, a rod-like crystal (n-HA1) with a diameter of 23 ± 5 nm, a length of 47 ± 14 nm, and crystallinity of 85% ± 5% was produced, while at a temperature of 80°C, a rod-like crystal (n-HA2) with a diameter of 16 ± 3 nm, a length of 40 ± 10 nm, and crystallinity of 65% ± 3% was produced. The influence of nanohydroxyapatite size and crystallinity on osteoblast viability was studied by MTT, scanning electron microscopy, and flow cytometry.
Results
n-HA1 gave a better biological response than n-HA2 in promoting cell growth and inhibiting cell apoptosis, and also exhibited much more active cell morphology. Alkaline phosphatase activity for both n-HA2 and n-HA1 was obviously higher than for the control, and no significant difference was found between n-HA1 and n-HA2. The same trend was observed on Western blotting for expression of type I collagen and osteopontin. In addition, it was found by transmission electron microscopy that large quantities of n-HA2 entered into the cell and damaged the cellular morphology. Release of tumor necrosis factor alpha from n-HA2 was markedly higher than from n-HA1, indicating that n-HA2 might trigger a severe inflammatory response.
Conclusion
This work indicates that not all nanohydroxyapatite should be considered a good biomaterial in future clinical applications.
Introduction
It is well known that bone mineral is made up of hydroxyapatite in the form of needle-like or rod-like shapes, and that hydroxyapatite crystals are extremely small, with an average length of 50 nm and width of 25 nm.Citation1,Citation2 As a desirable bone replacement material, hydroxyapatite, ie, Ca10(PO4)6(OH)2, with stoichiometric composition, has drawn great interest for use in the repair of bone defects and in coating on metal parts of prosthetic implants due to its excellent biocompatibility, bioactivity, and bone-bonding properties.Citation3–Citation6 Therefore, several methods have been used to prepare hydroxyapatite, including solid state reactions, plasma techniques, crystal growth under hydrothermal conditions, layer hydrolysis of other calcium phosphate salts, and the sol-gel route.Citation7–Citation14 Among these methods, hydrothermal synthesis has received more attention because of its well known inherent advantages, such as low energy consumption, high product purity, homogeneous composition, and better control over size and shape.
There are also numerous reports on nanosize hydroxyapatite and its biological effects. Tang et alCitation15 demonstrated that 20–40 nm apatite particles play an important role in biomineral formation. Shi et alCitation16 reported that sphere- like hydroxyapatite particles with diameters of 20 nm have better effects on promotion of cell growth and inhibition of cell apoptosis than those with diameters of 80 nm. Moreover, rod-like nanohydroxyapatite particles 20–30 nm in width and 50–80 nm in length support attachment and growth of human osteoblast-like cells.Citation17 However, there has been a lack of studies focusing on the biological properties of rod-like nanohydroxyapatite particles with different crystallinities and different sizes below 50 nm.
Therefore, in this study, a hydrothermal synthesis method was used to prepare two kinds of nanohydroxyapatite with different particle sizes below 50 nm and different crystallinities. The cytotoxicity and inflammatory response of bone-forming osteoblast cells to nanohydroxyapatite were investigated in order to monitor events during which nanohydroxyapatite was in contact or reacting with the surrounding biological environment. The biological properties of two kinds of nanohydroxyapatite were assessed using an osteoblast-like MG-63 and a macrophage U937 model.
Materials and methods
Preparation of nanohydroxyapatite
Two kinds of nanohydroxyapatite with different properties were prepared in our laboratory. n-HA1 and n-HA2 were synthesized by a chemical precipitation method. Briefly, calcium nitrate [Ca(NO3)2 · 4H2O] and diammonium phosphate [(NH4)2HPO4] were dissolved in deionized water separately according to a Ca/P molar ratio of 1.67/1. The pH of each solution was adjusted to 9–10 with ammonia solution. Ca(NO3)2 solution was then dropped into the solution of (NH4)2HPO4 under continuous stirring. When this reaction was completed, hydroxyapatite was kept at room temperature for 24 hours, and the precipitate was obtained after washing with deionized water four times. The chemicals were analytical grade and purchased from Sinopharm Chemical Reagent Co, Ltd, Shanghai, China.
In an autoclave, hydroxyapatite precipitation was treated hydrothermally at 140°C under 0.3 MPa for 4 hours, and precipitation of the other hydroxyapatite was treated hydrothermally at 80°C under 0.3 MPa for 4 hours, respectively. Hydroxyapatite obtained at 140°C was designated as n-HA1 and that at 80°C as n-HA2. The concentration of the slurry was determined by drying to a constant weight. After sterilizing by ultraviolet rays, the slurry was stored at 4°C. It was then diluted with Modified Eagle’s Medium/RPMI-1640 culture medium (Invitrogen, Paisley, UK) to 100 μg/mL prior to being fed to cells.
Characterization of nanohydroxyapatite
After being dried at room temperature, the morphology of the nanohydroxyapatite particles was examined using transmission electron microscopy (TEM, Tecnai F30, Philips, The Netherlands) with an accelerating voltage of 200 keV and the atom mol ratio of Ca to P was determined using energy dispersive x-ray spectroscopy. Crystal structure analysis of nanohydroxyapatite was carried out using x-ray diffractometry (D/max 2000, Rigaku, Japan) with Cu Kα radiation at 40 kV and 100 mA at room temperature, and the data were collected from 10° to 60° with a step size of 0.08° 2θ per second. The bands in nanohydroxyapatite were detected by Fourier transform infrared spectroscopy (Magna-IR 750, Nicolet, Thermo Fisher Scientific, Madison, WI), and Fourier transform infrared spectra were collected over the range of 4000–400 cm−1.
Cell culture
Human osteoblast-like MG-63 and human macrophage U937 cell lines (American Type Culture Collection, Manassas, VA) were used in this study. MG-63 cells were cultured in Modified Eagle’s Medium (Gibco, Carlsbad, CA) containing 10% fetal calf serum (Gibco), 100 μg/mL streptomycin (Amresco, Cleveland, OH) and 100 U/mL penicillin (Amresco) at 37°C in a humidified atmosphere of 5% CO2. U937 cells were used to evaluate cytokine synthesis. Cells were maintained in RPMI-1640 medium supplemented with 10% fetal calf serum, 2 mM glutamine,100 U/mL penicillin, and 100 μg/mL streptomycin at 37°C in a saturated 5% CO2 95% air atmosphere.
Cell viability assay
Viability of MG- 63 was assessed using the 3-(4, 5-dimethylthiazol- 2-yl)-2, 5-diphenyl tetrazolium bromide (MTT) assay. MG-63 cells were seeded at a density of 0.5 × 10⁴ per well in 96-well plates (Corning, NY). At 24 hours after seeding, the cells were rinsed with phosphate-buffered saline, and 200 μL n-HA1 or n-HA2 solution or 200 μL medium (as the control) was added to the cells. After incubating the cells in a humidified atmosphere with 5% CO2 at 37°C for 1, 3, and 5 days, respectively, sample solutions were removed and MTT was then added at a concentration of 0.5 mg/mL in medium for 4 hours at 37°C. At the end of the assay, the blue formazan reaction product was dissolved by adding 100 μL of 10% sodium dodecyl sulfate/0.01 M HCl to each well. The absorbance value was measured at 570 nm with a microplate reader (Model 680, Bio-Rad, Hercules, CA). Six specimens were tested for each incubation period, and each test was performed in triplicate. Results were reported as units of optical density (OD) and expressed as the mean ± standard deviation.
FE-SEM observation and apoptosis detection
The morphology of MG-63 cells cocultured with nanohydroxyapatite was observed using a field emission scanning electron microscope (FE-SEM, 1910FE, Amray Inc, Bedford, MA). All samples must be fixed in 10% formalin solution for one hour and then dehydrated using graded ethanol solutions before scanning electron microscope testing. Dehydrated samples were dried by a vacuum dryer before sputter-coating with gold using a sputter coater.
Cell apoptosis was analyzed by flow cytometry using a Annexin V-FITC apoptosis detection kit (Beyotime, Shanghai, China). MG-63 cells were cultured in 24-well plates at 5 × 10⁴ cells/mL for 5 days. Then cells were digested with 0.05% pancreatic enzyme for 3–5 minutes. The digested cells were washed with the collected culture medium, and then suspended in phosphate-buffered saline. Cells were stained with the apoptosis detection kit according to the manufacturer’s instructions before analysis by flow cytometry. Briefly, the cells from each sample were suspended in 195 mL of Annexin V-FITC binding buffer, and 5 mL of Annexin V-FITC. The cells were incubated at room temperature for 10 minutes. Each sample was then centrifuged at 1000 g for 5 minutes, suspended again in 190 mL of binding buffer and 10 mL of propidium iodide working solution was added. Then the samples were analyzed by a FACSCalibur (Becton Dickinson, Franklin Lakes, NJ) flow cytometry with at least 10,000 events recorded for each condition. The percentage of apoptotic cells was analyzed using Summit software 5.0. Histograms of DNA content (x-axis, propidium iodide fluorescence) versus counts (y-axis) were displayed.
Total intracellular protein content and alkaline phosphatase activity
This procedure was performed using a bicinchoninic acid protein assay reagent kit (Sigma-Aldrich, St Louis, MO).Citation18 In short, 25 μL aliquots of cell lysate were mixed with 200 μL of bicinchoninic acid working reagent containing cupric sulfate and bicinchoninic acid in microplates, and then incubated for 30 minutes at 37°C. The absorbance of the dye-protein complex solution was measured in a microplate reader at 570 nm. Bovine serum albumin was used to generate a standard curve.
To evaluate alkaline phosphatase activity, MG-63 cells at 1 × 10⁵ cells/mL were seeded in 24-well plates for 24 hours. At the end of the incubation period, cells were exposed to different nanohydroxyapatite solutions for 5 days. Without nanohydroxyapatite (control), cellular alkaline phosphatase activity was determined in terms of the initial rates of hydrolysis of p-nitrophenyl phosphate (Amresco) to p-nitrophenol. Briefly, cells were washed with phosphate-buffered saline and then lysed in 0.5 mL phosphate-buffered saline containing 0.1 M glycine, 1 mM MgCl2, and 0.05% Triton X-100 (Amresco). The lysate solution was incubated with p-nitrophenyl phosphate solution at 37°C for 30 minutes and stopped by the addition of 50 μL of 0.3 M NaOH. The production of p-nitrophenol was determined by the absorbance at 405 nm in a microplate reader. Alkaline phosphatase activity was normalized by total intracellular protein synthesis and expressed as nmol of p-nitrophenol per mg protein per minute.
Western blotting
The osteopontin and type I collagen (COLL-I) expression by MG-63 cells was analyzed using sodium dodecyl sulfate polyacrylamide gel electrophoresis (SDS-PAGE) and Western blotting after 5 days of culture. For blotting, cells were lysed in radioimmunoprecipitation assay (RIPA) buffer (Pierce, Rockford, IL) supplemented with a complete protease inhibitor cocktail (Roche Applied Science, Indianapolis, IN). Approximately 10–30 μg of protein was loaded on 10%–15% SDS-PAGE and transferred to an Immobilon-P membrane (Millipore Corporation, Bedford, MA). The membrane was blocked by 5% skim milk in TBS- Tween 20 (0.03%), and incubated with primary antibodies, ie, anti-osteopontin and anti-COLL-I (Chemicon International Incorporated, Temecula, CA). Blots were developed by chemiluminescence using Amersham ECL reagents (GE Healthcare, Little Chalfont, UK). GAPDH mRNA was used as the internal control for each set of experiments.
Quantitation of TNF-α by ELISA
Macrophages U937 were placed in 24-well plates (2.5 × 10⁴ cells/ mL) and incubated at 37°C for 24 hours. At the end of the incubation period, cells were exposed to different nanohydroxyapatite solutions and fresh RPMI-1640 for 18 hours. Tumor necrosis factor alpha (TNF-α) determination in cell culture supernatants was performed using commercially available enzyme-linked immunosorbent assay (ELISA) kits according to the manufacturer’s instructions (RapidBio Lab, West Hills, CA). The sensitivity of each kit was 10 pg/mL for TNF-α. Results are presented in pg/mL. Each group had subwells, and the experiments were repeated three times.
Immunofluorescence and cytoskeletal observation
MG-63 cells at 1 × 10⁴ cells/mL were cultured on cover slips at 37°C in a 5% CO2 humidified atmosphere. After 5 days, cells were washed with phosphate-buffered saline and fixed with 3% (w/v) paraformaldehyde in phosphate-buffered saline for 20 minutes at room temperature. The samples were then washed with phosphate-buffered saline and permeabilized at 4°C for 5 minutes, before being incubated with 1% bovine serum albumin/phosphate-buffered saline at 37°C for 5 minutes to block nonspecific binding. This was followed by adding 5 μg/mL rhodamine-phalloidin (Molecular Probes, Eugene, OR) to stain the actin of MG-63 cells for 20 minutes at 37°C. They were then rinsed and incubated for 10 minutes at room temperature with 10 μg/mL DAPI (Sigma-Aldrich). Samples were mounted in Vectorshield fluorescent mountant (Vector Laboratories, Peterborough, UK) and viewed by a Leica SP2 laser scanning confocal microscope.
TEM observation
TEM was carried out to visualize the intracellular internalization and localization of n-HA further. MG-63 cells were plated into 60 mm2 polystyrene dishes at a density of 2 × 10⁵ cells/mL, and allowed to attach for 24 hours. The cells were then exposed to the different nanohydroxyapatite solutions. After 5 days, the cells were rinsed with phosphate-buffered saline and fixed in 2% paraformaldehyde with 2.5% glutaraldehyde at 4°C for 2 hours. Fixed cells were rinsed three times in sodium phosphate buffer, and osmicated by incubating for one hour in 1% osmium tetroxide with 1.25% potassium ferrocyanide and 0.15 M sodium phosphate buffer. They were rinsed four times in deionized water, dehydrated using increasing concentrations of ethanol (30%, 50%, 75%, 100%, 10 minutes each), and embedded in epoxy resin. Thin sections (60–90 nm) were cut using a diamond knife, collected on 200 mesh copper grids, and stained with 4% aqueous uranyl acetate (Polysciences Inc, Northampton, UK) for 15 minutes, followed by Reynolds’ lead citrate for 7 minutes. Samples were viewed using TEM operating at 80 kV.
Statistical analysis
All quantitative data are expressed as the mean ± standard deviation. The differences between groups were evaluated by analysis of variance. The level of statistical significance was defined as P < 0.05.
Results
Characterization of n-HA
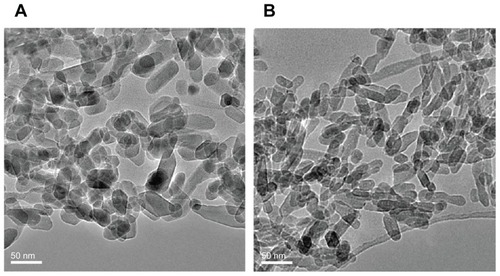
TEM micrographs of nanohydroxyapatite are shown in . No obvious differences in morphology were found between n-HA1 and n-HA2, which were composed of the same rod-like particles. The size of the nanohydroxyapatite was measured using an Image-Pro Plus 6.0 software. The results showed that the diameter of n-HA1 was 23 ± 5 nm and the length was 47 ± 14 nm, while the diameter of n-HA2 was 16 ± 3 nm and the length was 40 ± 10 nm.
Figure 1 Transmission electron microscopy of hydroxyapatite nanoparticles synthesized at (A) 140°C (n-HA1) and (B) 80°C (n-HA2).
Abbreviation: n-HA, nanohydroxyapatite.
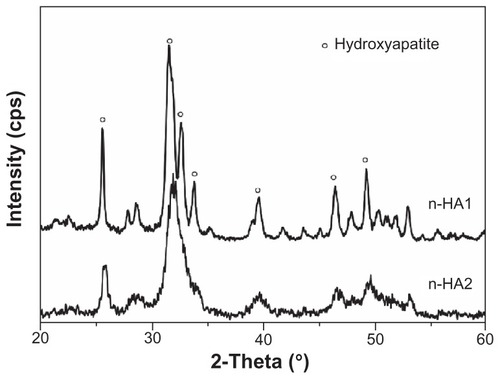
shows the x-ray diffractometry patterns for n-HA1 and n-HA2. Clearly, major hydroxyapatite peaks appeared in both n-HA1 and n-HA2 according to the standard x-ray diffractometry pattern of hydroxyapatite (JCPDS09-0432), such as (002), (211), (211), and (300) at 25.88, 31.78, 32.18, and 32.98 2θ. No other phases were detected. Moreover, the results showed that sharper diffraction peaks, a higher diffraction intensity, and a lower degree of dispersion were present in n-HA1, indicating that the crystallinity in n-HA1 was higher than in n-HA2. The crystallinity of nanohydroxyapatite was calculated using Jade 5.0 software. The results showed that the crystallinity of n-HA1 and n-HA2 was 85% ± 5% and 65% ± 3%, respectively.
Figure 2 X-ray diffraction patterns of n-HA1 and n-HA2.
Abbreviations: n-HA, nanohydroxyapatite; cps, counts per second.
Fourier transform infrared spectroscopy confirmed the presence of an apatite phase in n-HA1 and n-HA2, as shown in . Strong bands at 960 cm−1 and 1020–1120 cm−1 were observed for the PO4 group. The bands at 3570 cm−1 can be attributed to the presence of the OH group of hydroxyapatite, and the bands at 3435 cm−1 and 1640 cm−1 can also be detected for the adsorbed water.
Figure 3 Fourier transform infrared spectroscopic patterns of n-HA1 and n-HA2.
Abbreviation: n-HA, nanohydroxyapatite.
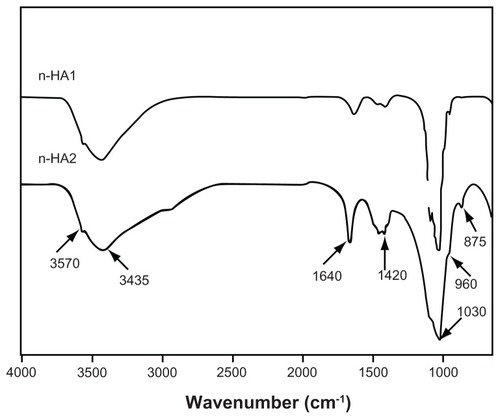
Importantly, the carbonate group was found at 1420 cm−1 and 875 cm−1 as shown in , which might be the result of CO2 in the atmosphere being dissolved in solution during preparation of n-HA. The peak intensity of the carbonate group suggested that there was a substitution of a phosphate group by a carbonate group during synthesis, and there were more substitutions in n-HA2 than in n-HA1. This is consistent with the x-ray diffractometry results showing higher crystallinity for n-HA1 than for n-HA2. The energy dispersive x-ray spectroscopy results showed that the Ca/P ratios for n-HA1 and n-HA2 were 1.65 ± 0.02 and 1.62 ± 0.03, respectively.
Cell viability and cell morphology
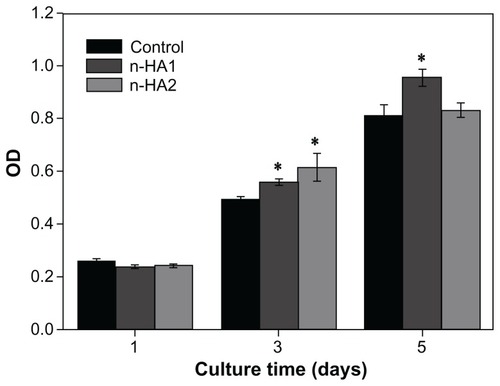
shows that the OD value increased with time when MG-63 cells were cocultured with n-HA1 and n-HA2, indicating that nanohydroxyapatite affected cell proliferation. Clearly, both n-HA1 and n-HA2 could improve the viability of osteoblasts. At 5 days, the OD value for n-HA1 was significantly higher than for n-HA2 and the controls (P < 0.05). This suggests that n-HA1 could promote the viability of MG-63 cells.
Figure 4 Viability of osteoblast cells responding to different nanohydroxyapatite particles at various time points by MTT analysis.
Note: *P < 0.05 compared with controls.
Abbreviations: MTT, 3-(4, 5-dimethylthiazol-2-yl)-2, 5-diphenyltetrazolium bromide; n-HA, nano-hydroxyapatite; OD, optical density.
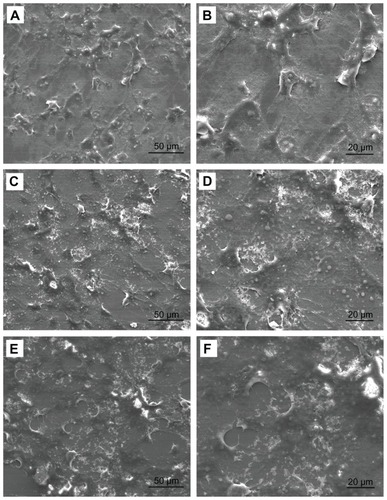
Cellular morphology was observed using FE-SEM to obtain qualitative information on MG-63 cells cocultured with n-HA. In the SEM images, MG-63 cells were polygonal or widespread shapes with fine filopodia and abundant surface folds in each group as shown in . There were some areas of confluent cells at 5 days, and fiber-like extracellular matrices were laid down by the MG-63 cells. Clusters of cells were observed in n-HA1. In contrast, spindle cells with fewer filopodia were observed in n-HA2 and controls.
Figure 5 Field emission scanning electron microscopic images of MG-63 cells cocultured with different nanohydroxyapatite particles for 5 days: (A and B) as controls; (C and D) n-HA1; (E and F) n-HA2.
Abbreviation: n-HA, nanohydroxyapatite.
Cytoskeletal observation
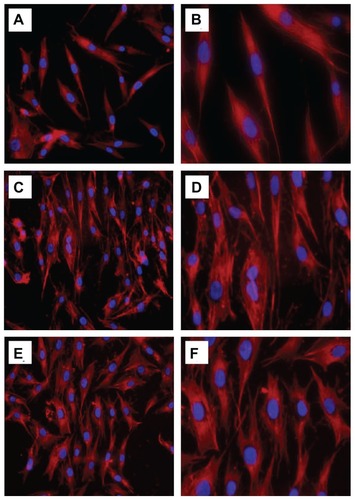
Cytoskeletal organization is generally determined by actin staining with fluorescence-labeled phalloidin, which is normally used to assess cell motility, cell spreading, and cell shape.Citation19 As shown in , the control cells showed a network of well formed stress fibers of normal filamentous morphology. The shape of the cells treated with n-HA1 showed no difference compared with controls, with clear longitudinal stress fibers as shown in . However, the cells exhibited a polygon-like shape after treatment with n-HA2. Moreover, at higher magnification, the actin cytoskeleton was more diffuse with less stress fiber formation in cells treated with n-HA2 compared with n-HA1.
Figure 6 Actin cytoskeletal organization (red, labelled with rhodamine-phalloidin, counterstained with DAPI for nuclei in blue) of MG-63 cells after incubation with n-HA1 and n-HA2 for 5 days: (A and B) control cells; (C and D) n-HA1; (E and F) n-HA2. Cells with the n-HA1 material tended to have a more organized actin cytoskeleton.
Abbreviation: n-HA, nanohydroxyapatite.
Cell apoptosis
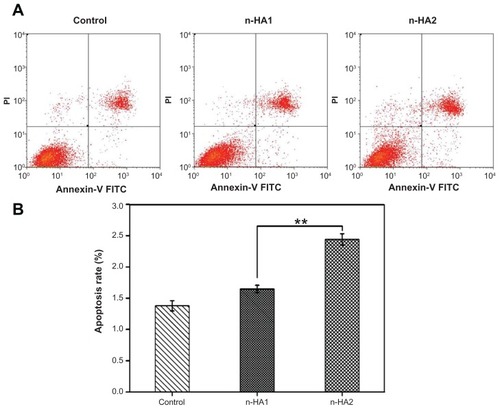
Apoptosis and death of MG-63 cells were detected further using flow cytometry, with Annexin V-FITC/propidium iodide double-staining of cells. When the MG-63 cells were treated with n-HA1 and n-HA2 for 5 days, significant changes were found between the two group. Typical figures for the flow cytometric analyses are shown in . The extent of apoptosis was quantitatively analyzed by Summit 5.0 software. The apoptosis rate of n-HA2 was measured to be 2.44% ± 0.09%, which was obviously higher than for n-HA1(1.65% ± 0.06%). The results suggest that there was a significant difference between n-HA1 and n-HA2 with regard to rate of apoptosis of MG-63 cells, as shown in (P < 0.01).
Figure 7 Flow cytometric analyses of MG-63 cells apoptosis after treatment with n-HA1 and n-HA2 for 5 days. (A) Typical figures for flow cytometric analyses of apoptotic cells (x-axis, Annexin V-FITC) versus (y-axis, propidium iodide fluorescence). (B) Percentages of apoptotic cells. The percentage of cells was calculated using Summit 5.0 software.
Notes: Data are presented as the mean ± standard deviation of three separate experiments (n = 4). **P < 0.01.
Abbreviations: Annexin-V FITC, Annexin-V fluorescein isothiocyanate; n-HA, nanohydroxyapatite.
Alkaline phosphatase activity and protein expression
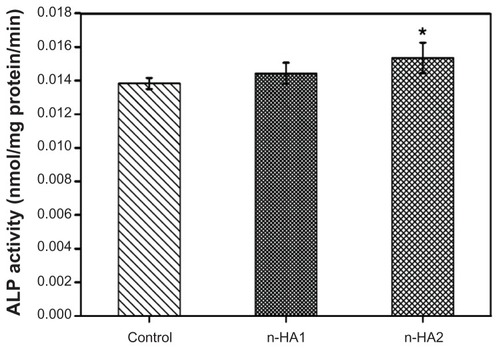
Cell differentiation was assessed in terms of alkaline phosphatase activity of MG-63 cells cocultured with n-HA1 and n-HA2 (without material as controls) at 5 days as shown in . It is found that alkaline phosphatase activity of cells treated with n-HA1 and n-HA2 was high compared with controls, and there was a significant difference between n-HA2 and controls (P < 0.05). However, no significant difference was detected between n-HA1 and n-HA2.
Figure 8 Alkaline phosphatase activity of MG-63 cells after incubation with n-HA1 and n-HA2 for 5 days.
Note: *P < 0.05 compared with control.
Abbreviations: ALP, alkaline phosphatase; n-HA, nanohydroxyapatite.
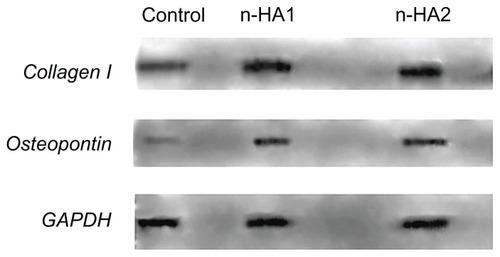
shows the expression of COLL-I and osteopontin by MG-63 cells after coculture with n-HA1 and n-HA2 for 5 days. Expression of GAPDH as the positive control was at the same level in all groups, while the level of COLL-I and osteopontin expression after MG-63 cells cocultured with n-HA1 and n-HA2 was higher than for the controls. However, no significant difference between the n-HA1 and n-HA2 groups was observed.
Figure 9 Collagen I and osteopontin synthesis by MG-63 cells cultured with the control, n-HA1, and n-HA2 were determined by Western blotting. Similar results were obtained in four separate experiments.
Abbreviation: n-HA, nanohydroxyapatite.
Effects of nanohydroxyapatite on TNF-α production
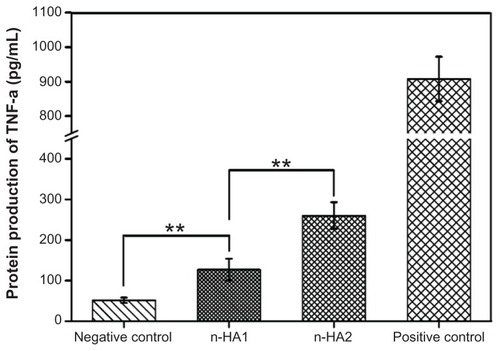
In order to investigate how nanohydroxyapatite modulated TNF-α synthesis, macrophages were incubated with both n-HA1 and n-HA2 for 18 hours, and zymosan particles were used as the positive control. As shown in , TNF-α protein production by macrophages alone (negative control) was low at about 100 pg/mL. However, addition of nanohydroxyapatite modified TNF-α expression. When macrophages were exposed to n-HA1, TNF-α expression was more than twice that of the controls. It is interesting to note that TNF-α release in n-HA2 was distinctly higher than in n-HA1, indicating that n-HA2 might trigger a severe inflammatory response.
Figure 10 TNF-α protein production by the human macrophage U937 exposed to nanohydroxyapatite over 18 hours.
Notes: Data are presented as the mean ± standard deviation of three separate experiments (n = 3). **P < 0.01.
Abbreviations: TNF-α, tumor necrosis factor alpha; n-HA, nanohydroxyapatite.
Interaction of nanohydroxyapatite with MG-63 cells
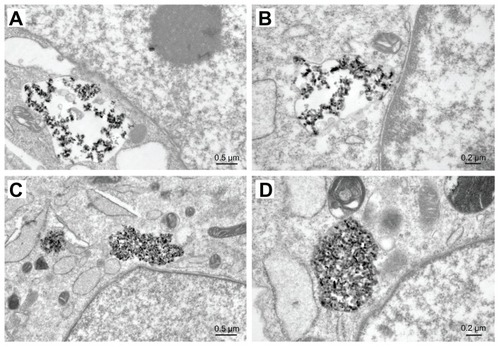
TEM images of MG-63 cells in n-HA1 showed a typical ultrastructure characterized by a well preserved plasma membrane, a nucleus with uniformly dispersed chromatin and a clear nucleolus, a cytoplasm containing randomly distributed organelles, and electron-dense granules, as shown in . However, for cells in n-HA2, morphological changes were observed, such as swollen mitochondria, a deformed nucleus, and condensed chromatin. TEM images clearly showed that the nanohydroxyapatite dissolved as a function of time within MG-63 cells. Dissolution of nanohydroxyapatite occurred progressively within lysosomes as shown in . After their initial uptake into phagolyso-somes, n-HA1 was dispersed (), while n-HA2 became more densely packed, and a proportion of the particles started to dissolve, as shown in .
Figure 11 Transmission electron microscopic images of MG-63 cells exposed to n-HA1 and n-HA2 for 5 days. (A) n-HA1 was close to the nuclear envelope, but did not enter into the cell nucleus. (B) n-HA2 lead to a change in nuclear morphology.
Abbreviations: n-HA, nanohydroxyapatite; N, nucleus.
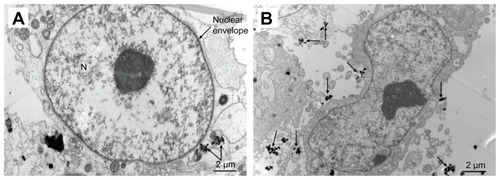
Figure 12 Dissolution of n-HA1 (A) and n-HA2 (C) in MG-63 cells containing lysosomes. After phagocytosis, the particles were scattered and retained their original size and shape within phagosomes. n-HA2 was compacted very tightly and a proportion of the particles began to dissolve. The images in (B and D) represent closer observation.
Abbreviation: n-HA, nanohydroxyapatite.
Discussion
Hydrothermal synthesis methods have been widely used to prepare nanosized inorganic materials.Citation20–Citation22 In this study, rod-like nanohydroxyapatite with an average diameter of 23 ± 5 nm or 16 ± 3 nm were obtained using simple heating in water. Homogeneous nanohydroxyapatite with different sizes and crystallinities were used to investigate the effects of nanohydroxyapatite on cell responses. Because synthetic nanohydroxyapatite is usually used as a bone implant biomaterial for surgical treatment of bone defects, osteoblast- like MG-63 and human macrophage U937 were selected as model cells in which to study the biological properties of n-HA.
The results of the MTT assay () showed that both n-HA1 and n-HA2 could promote MG-63 cell viability with time, indicating that nanohydroxyapatite had good cytocompatibility. After 3 days of culture, no obvious difference in OD value was found between n-HA1 and n-HA2 for MG-63 cells. However, at 5 days, it was observed that the OD value for n-HA1 was obvious higher than for n-HA2, indicating that n-HA1 promoted more cell proliferation than n-HA2.
Apoptosis is responsible for the decrease in cell proliferation induced by biomaterials.Citation23,Citation24 Also known as programmed cell death, apoptosis is a normal component of the development and health of multicellular organisms. A variety of stimuli can trigger the release of intracellular apoptotic signals by damaged cells, like heat, radiation, nutrient deprivation, viral infection, hypoxia, and increased intracellular calcium concentration,Citation25 all of which cause damage to the cell membrane. According to our flow cytometric results (), the cell apoptosis rate in n-HA2 was higher than in n-HA1 and controls, indicating that n-HA2 had some negative effects on MG-63 cells. The most likely reason is a high content of intracellular calcium. This hypothesis is supported by our TEM observations, in that more n-HA2 was found in cells and a portion of it was dissolved by lysosomes. Some researchers have suggested that increases in intracellular calcium may promote apoptosis.Citation26 In addition, apoptotic cells displayed distinctive morphology during the apoptotic process. As can be seen from the cytoskeleton, n-HA2 led to an adverse effect whereby the cell shape was changed.
The quantity of TNF-α released from macrophages in the presence of nanohydroxyapatite was investigated because TNF induction is one of the theories regarding direct initiation of apoptotic mechanisms. TNF-α is a cytokine produced mainly by activated macrophages, and is the major extrinsic mediator of binary hipaloptic apoptosis. Most cells have two receptors for TNF, ie, TNF-R1 and TNF-R2. Binding of TNF to TNF-R1 has been shown to initiate the pathway that leads to caspase activation via the intermediate membrane protein, TNF receptor-associated death domain.Citation27 Binding of this receptor can also lead indirectly to activation of transcription factors involved in cell survival and inflammatory responses. Citation28 The present results () show that more TNF-α was produced by macrophages in the presence of n-HA2. Given the link between TNF and apoptosis, it is understandable why n-HA2 induces higher apoptosis rate.
Differentiation of osteoblasts is also commonly used to investigate the effects of biomaterials on cellular responses. Differentiating osteoblasts are known to synthesize and secrete type I collagen, alkaline phosphatase, and additional noncollagenous extracellular bone matrix proteins, such as osteonectin, osteocalcin, osteopontin, and bone sialoprotein.Citation29,Citation30 These bone matrix proteins have proven to be particularly useful as osteogenic markers. The results () indicate that both n-HA1 and n-HA2 could improve alkaline phosphatase activity more than controls. The effects of n-HA2 on cells may derive from the fact that n-HA2 has lower crystallinity. Maxian et alCitation31 reported that alkaline phosphatase could be enhanced by hydroxyapatite with low crystallinity compared with high crystallinity in a rat calvarial bone cell culture system, and hydroxyapatite with low crystallinity showed greater calcium release than hydroxyapatite with high crystallinity. On the other hand, Matsuoka et alCitation32 reported that increased extracellular ionized calcium concentration in the culture medium by release from apatite-containing and wollastonite-containing glass ceramics enhanced alkaline phosphatase activity, and promoted osteogenic differentiation in ROS17/2.8 cells.
Both n-HA1 and n-HA2 showed significantly higher COLL-1 and osteopontin expression than controls, which is in agreement with previous studies in which calcium phosphate could promote protein synthesis of osteoblasts and facilitate repair of hard tissue injury.Citation33 However, there was no difference between n-HA1 and n-HA2. This could be due to selection of an inappropriate time to test for expression of COLL-I and osteopontin. As is well known, osteoblasts of differentiation-maturation appear to follow an ordered temporal sequence, ie, acquisition and increase in alkaline phosphatase activity, increase in COLL-I synthesis, acquisition of expression of several noncollagenous bone matrix proteins, such as osteopontin, and deposition and subsequent mineralization of these matrix components to form bone.Citation34 Therefore, selecting an appropriate time for testing would be important when examining the influence of such materials on cell function.
In this study, TEM was used to investigate whether n-HA1 and n-HA2 could enter into cells. The results () show that both n-HA1 and n-HA2 entered into cells, and were close to the nuclear envelope, but did not enter into the nucleus. In short, this study demonstrates that nanohydroxyapatite particles with different sizes and crystallinities, when interacted with osteoblast-like MG-63 or human macrophage U937, can trigger different biological effects, especially in terms of osteoblastic proliferation, actin cytoskeletal morphology, osteoblastic microstructure, and production of TNF-α by macrophages.
Conclusion
In this study, nanohydroxyapatite particles with different sizes and crystallinities were synthesized under different reaction temperatures, and their cellular biological responses to osteoblast-like cells were evaluated. Rod-like n-HA1 with a diameter of 23 ± 5 nm, a length of 47 ± 14 nm, and crystallinity of 85% ± 5% was produced at 140°C, while rod-like n-HA2 with a diameter of 16 ± 3 nm, a length of 40 ± 10 nm, and crystallinity of 65% ± 3% was produced at 80°C. The results demonstrate that n-HA1 can promote cell proliferation, inhibit cell apoptosis, and induce less inflammatory activity by macrophages. However, n-HA1 did not show distinct advantages in cell differentiation, which could be ascribed to the fact that the time point chosen was not optimal for MG-63 cell differentiation. Furthermore, it was found that a great deal of n-HA2 entered into the cells, and had obvious effects on cell morphology, reflected in changes in the cytoskeleton. In conclusion, n-HA1 was more conducive to proliferation of MG-63 osteoblasts than was n-HA2.
Acknowledgments
This work was supported by the State Key Development Program for Basic Research of China (grant 2007CB936103), Fundamental Research Funds for the Central Universities, Peking University 985 grant, the National Natural Science Foundation of China (30970720), and Key Medical Program of Science and Technology Development of Shanghai (09411954900).
Disclosure
The authors report no conflicts of interest in this work.
References
- MuruganRRamakrishnaSDevelopment of nanocomposites for bone graftingCompos Sci Technol20056523852406
- Vallet-RegiMArcos NavarreteDABiomimetic nanoceramics in clinical use: from materials to applicationsRSC Nanoscience and Nanotechnology2008185
- HenchLLBioceramics: from concept to clinicJ Am Ceram Soc19917414871510
- WebsterTJErgunCDoremusRHSiegelRWBiziosREnhanced functions of osteoblasts on nanophase ceramicsBiomaterials2000211803181010905463
- SuchanekWYoshimuraMProcessing and proper ties of hydroxyapatite- based biomaterials for use as hard tissue replacement implantsJ Mater Res19981384117
- HenchLLBioceramicsJ Am Ceram Soc19988117051728
- FazanFShahidaKBNFabrication of synthetic apatites by solid-state reactionsMed J Malaysia200459697015468823
- YangCYYangCWChenLREffect of vacuum post-heat treatment of plasma-sprayed hydroxyapatite coatings on their in vitro and in vivo biological responsesJ Med Biol Eng200929296302
- HahnBDLeeJMParkDSEnhanced bioactivity and biocompatibility of nanostructured hydroxyapatite coating by hydrothermal annealingThin Solid Films201151980858090
- GuoYPYaoYBNingCQGuoYJChuLFFabrication of mesoporous carbonated hydroxyapatite microspheres by hydrothermal methodMater Lett20116522052208
- SuchanekWLShukPByrappaKRimanRETenHuisenKSJanasVFMechanochemical-hydrothermal synthesis of carbonated apatite powders at room temperatureBio Materials200223699710
- TanakaHIhataDPhase transformation of calcium phenyl phosphate in calcium hydroxyapatite using alkaline phosphatase at body temperatureMater Res Bull201045103108
- TuckLAstalaRReidJWSayerMStottMJDissolution and re-crystallization processes in multiphase silicon stabilized tricalcium phosphateJ Mater Sci Mater Med20081991792717665127
- KuriakoseTAKalkuraSNPalanichamyMArivuoliDDierksKBocelliGSynthesis of stoichiometric nano crystalline hydroxyapatite by ethanol-based sol-gel technique at low temperatureJ Cryst Growth2004263517523
- TangRKWangLJOrmeCABonsteinTBushPJNancollasGHDissolution at the nanoscale: self-preservation of biomineralsAngew Chem Int Ed20044326972701
- ShiZLHuangXCaiYRTangRKYangDSSize effect of hydroxyapatite nanoparticles on proliferation and apoptosis of osteoblast-like cellsActa Biomater2009533834518753024
- HuangJBestSMBonfieldWIn vitro assessment of the biological response to nano-sized hydroxyapatiteJ Mater Sci Mater Med20041544144515332614
- SmithPKKrohnRIHermansonGTMeasurement of protein using bicinchoninic acidAnal Biochem198515076853843705
- SaundersRSzymczykKHShapiroIMAdamsCSMatrix regulation of skeletal cell apoptosis III: mechanism of ion pair-induced apoptosisJ Cell Biochem200710070371517006955
- ArunaSTTiroshSZabanANanosize rutile titania particle synthesis via a hydrothermal method without mineralizersJ Mater Chem20001023882391
- LimGKWangJNgSCGanLMFormation of nanocrystalline hydroxyapatite in nonionic surfactant emulsionsLangmuir19991574727477
- GeorgiouPKolokotronisKSimitzisJSynthesis of ZnO nanostructures by hydrothermal methodJ Nano Res20096157168
- DavidALobnerDIn vitro cytotoxicity of orthodontic archwires in cortical cell culturesEur J Orthod20042642142615366387
- CimpanMRMatreRCresseyLIThe effect of heat- and auto-polymerized denture base polymers on clonogenicity, apoptosis, and necrosis in fibroblasts: denture base polymers induce apoptosis and necrosisActa Odontol Scand20005821722811144873
- MattsonMPChanSLCalcium orchestrates apoptosisNat Cell Biol200351041104314647298
- YuSPCanzonieroLMChoiDWIon homeostasis and apoptosisCurr Opin Cell Biol20011340541111454444
- ChenGGoeddelDVTNF-R1 signaling: a beautiful pathwayScience20022961634163512040173
- McCombRBBowersGNPosenSAlkaline PhosphataseNew York, NYPlenum Press1979
- OwenTAAronowMShalhoubVProgressive development of the rat osteoblast phenotype in vitro: reciprocal relationships in expression of genes associated with osteoblast proliferation and differentiation during formation of the bone extracellular matrixJ Cell Physiol19901434204301694181
- AubinJEAdvances in the osteoblast lineageBiochem Cell Biol19987689991010392704
- MaxianSHStefanoTDMelicanMCTikuMLZawadskyJPBone cell behavior on matrigel-coated Ca/P coatings of varying crystallinitiesJ Biomed Mater Res1998401711799549611
- MatsuokaHAkiyamaHOkadaYIn vitro analysis of the stimulation of bone formation by highly bioactive apatite- and wollastonite-containing glass-ceramicJ Biomed Mater Res19994717618810449628
- JungGYParkYJHanJSEffects of HA released calcium ion on osteoblast differentiationJ Mater Sci Mater Med2010211649165420162336
- LiuFMalavalLAubinJEThe mature osteoblast phenotype is characterized by extensive plasticityExp Cell Res1997232971059141626