 ?Mathematical formulae have been encoded as MathML and are displayed in this HTML version using MathJax in order to improve their display. Uncheck the box to turn MathJax off. This feature requires Javascript. Click on a formula to zoom.
Abstract
Tracking cells after therapeutic transplantation is imperative for evaluation of implanted cell fate and function. In this study, ultrasmall superparamagnetic iron oxide nanoparticles (USPIO NPs) were surface functionalized with water-soluble chitosan, a cationic polysaccharide that mediates enhanced endocytic uptake, endosomal escape into the cytosol, and subsequent long-term retention of nanoparticles. NP surface and chitosan were independently fluorescently labeled. Our NPs enable NP trafficking studies and determination of fate beyond uptake by fluorescence microscopy as well as tracking of labeled cells as localized regions of hypointensity in T2*-weighted magnetic resonance imaging (MRI) images. Adult rat neural stem cells (NSCs) were labeled with NPs, and assessment of NSC proliferation rates and differentiation potential revealed no significant differences between labeled and unlabeled NSCs. Significantly enhanced uptake of chitosan NPs in comparison to native NPs was confirmed by transmission electron microscopy, nuclear magnetic resonance (NMR) spectroscopy and in vitro cellular MRI at 11.7 Tesla. While only negligible fractions of native NPs enter cells, chitosan NPs appear within membranous vesicles within 2 hours of exposure. Additionally, chitosan-functionalized NPs escaped from membrane-bound vesicles within days, circumventing NP endo-lysosomal trafficking and exocytosis and hence enabling long-term tracking of labeled cells. Finally, our labeling strategy does not contain any NSC-specific reagents. To demonstrate general applicability across a variety of primary and immortalized cell types, embryonic mouse NSCs, mouse embryonic stem cells, HEK 293 kidney cells, and HeLa cervical cancer cells were additionally exposed to chitosan-USPIO NPs and exhibited similarly efficient loading as verified by NMR relaxometry. Our efficient and versatile labeling technology can support cell tracking with close to single cell resolution by MRI in vitro, for example, in complex tissue models not optically accessible by confocal or multi-photon fluorescence microscopy, and potentially in vivo, for example, in animal models of human disease or injury.
With the emergence of cell-based approaches to medical therapies spanning enzyme replacement and stem cell-based tissue repair, the ability to track living cells has proven imperative. For example, neural stem cells (NSCs) – multipotent neural precursors of the brain, capable of self renewing, homing, and differentiating into neurons and gliaCitation1–Citation3 – have opened up new avenues toward neural cell replacement therapies for neurodegenerative disease since their discovery within the mammalian brain.Citation4–Citation6 Recently, several groups have reported on progress toward treatment of diseases and disorders, including multiple sclerosis,Citation7,Citation8 Parkinson’s disease,Citation9,Citation10 and traumatic central nervous system injuryCitation11,Citation12 with transplanted NSCs. However, data from these animal trials and almost all others have been collected after necropsy of the recipient animals, ie, there is no data available regarding the route or rate of migration of cells during the first critical days after implantation. For example, Pastori et al recently observed through in vitro experimentation with isolated brains and subsequent immunohistochemical analysis of brain slices that arterially perfused NSCs migrated to but did not breach the barrier of ischemic injury in a disease model for stroke.Citation13 In addition to such short-term experimentation in vitro, magnetic labeling of NSCs and tracking by magnetic resonance imaging (MRI) could yield valuable, long-term, in vivo data for example on when and how the migrating NSCs arrive at the site of ischemic injury and what behavior causes their arrested migration before settling into the adjacent injured tissue. Long-term tracking of transplanted NSCs will open entirely new avenues to studying disease mechanisms and developing therapeutic approaches.
Labeling cells with a sufficiently high intracellular density of ultrasmall superparamagentic iron oxide nanoparticles (USPIO NPs) with superior relaxivityCitation14,Citation15 (192.0 mM−1 [Fe] s−1, from Supplementary Figure 1) enables NSC tracking as localized regions of signal hypointensity in T2*-weighted MRI images. Iron oxide generates large local magnetic field gradients that generate a phase incoherence of the surrounding signal. This “blooming effect” enables single cells to be detected as easily identifiable, relatively larger regions of signal hypointensity at resolutions beneath the single-cell scale; the effect can be up to 50-fold larger than the iron deposit or tens to hundreds of microns. The challenge, however, remains to efficiently induce cellular uptake and long-term cellular retention of paramagnetic particles by cells.
In previous studies superparamagnetic iron-oxide nanoparticles (SPIO) were used to label macrophages, enabling cellular MRI-based identification of organ rejection in animal models.Citation15–Citation18 Conveniently, macrophages phagocytose micronsized particles from their surroundings, and so labeling of these particular cells proved straightforward. Immortalized cell lines have been successfully labeled using synthetic transfection reagents, such as lipofectamineCitation19 and polyethylene imine (PEI);Citation20 however, such reagents are unacceptably cytotoxic at even low concentrations to a variety of primary somatic and stem cell types, limiting their utility for labeling of such cells. Surface conjugation of small molecules, such as cholera toxin B, and biologically active oligopeptides, such as arginine–glycine–aspartic acid (RGD), to nanoparticles has also yielded high rates of endocytic cellular uptake;Citation21,Citation22 however, trafficking through endo-lysosomal pathways beyond uptake causes these particles to be rapidly evacuated from cells.Citation21 Furthermore, engagement of specific cell surface receptors by these active molecules, ie, surface gangliosides by cholera toxin BCitation21 and a dozen known integrins by RGD,Citation23 not only enables cell labeling but also effects cell fate, which may be undesirable for the mechanistic studies such labeling is meant to support.
Here, we present a potentially universal method for efficient magnetic labeling of mammalian cells utilizing the naturally derived, biocompatible, polyelectrolyte chitosan. Previously, complexation of chitosan and plasmid DNA to form chitosan/ DNA nanoparticle gene carriers was employed to achieve efficient cellular transfection, both in vitro and in vivo, as described in a seminal publication from Kam Leong and colleagues. By inducing primarily clathrin-mediated endosomal uptake of these NPs and subsequent charge-induced endosomal escape intracellulary, nuclear uptake of delivered DNA by proliferating cells and subsequent expression of delivered genes was made possible.Citation24–Citation26 Our methods for magnetic cell labeling based on chitosan-conjugated iron-oxide nanoparticles is similarly characterized by rapid endosomal nanoparticle uptake, subsequent endosomal escape, and corresponding long-term cytosolic retention. Our approach in particular is to surface functionalize ultrasmall (~5 nm) SPIO NPs with water soluble chitosan – deacetylated chitin from crustacean shells. Chitosan is a linear polysaccharide of β-(1-4)-linked D-glucosamine (deacetylated) and N-acetyl-D-glucosamine that is polycationicCitation27,Citation28 and spontaneously deposits on the negatively charged carboxylated surface of a USPIO NP. This physical association is then strengthened by chemical cross-linking using carbodiimide chemistry to link primary amines on the chitosan backbone to carboxyl groups on the nanoparticle surface via an amide linkage. This surface modification with positively charged chitosan promotes nanoparticle attachment to negatively charged domains on the outer leaflet of the cell membrane, enhancing nanoparticle uptake by endocytosis.Citation25,Citation26 We applied this method to labeling and tracking of neural stem cells (a cell type that is both of tremendous therapeutic potential and particularly difficult to label without negatively effecting viability or function) as well as four other mammalian cell types, indicating general applicability of our approach.
Methods
Chitosan–USPIO NP synthesis
Aminated-USPIO surface conjugation with AlexaFluor 555
In order to attach the amine-reactive AlexaFluor 555 dye to the carboxylated surface of our nanopaticles (USPIO, Ocean Nanotech), a Schmidt reaction-driven conversion of ~5% of the NP surface carboxylic acid groups to primary amines was undertaken by reacting carboxyl groups with sodium azide in an aqueous sulfuric acid solution. The surface-aminated particles were then combined with a molar excess of amine-reactive dye, yielding nanoparticles of uniform, controllable, surface fluorescence. In detail, 0.5 mL of partially aminated NPs at 3.5 mg/mL with 1 μL of 1 mg/10μL AlexaFluor 555 dye in DMSO was incubated at room temperature overnight. The unlabeled fluorescent dye and DMSO were removed by filtration using a 300-kDa spin column, centrifuged for 5 minutes at 3000 rpm. The labeled NP suspension was then washed similarly in a spin column with phosphate-buffered saline (PBS) two more times, and NPs were recovered by gentle pipetting in PBS followed by transfer into a 1.5-mL Eppendorf tube for storage.
Chitosan conjugation with AlexaFluor 633
Chitosan was labeled with a targeted ratio of about five fluorescent molecules per water-soluble chitosan–glutamate salt molecule (NovaMatrix), leaving a majority of primary amines free for surface complexation of chitosan with the negatively charged, similarly fluorescently labeled, nanoparticle surface. In detail, 0.7 mL of chitosan stock (1 wt/vol% Protosan UPG213, 40,000–200,000 molecular weight [MW], Pronova Biopolymer) was incubated with 1 μL of 1 μg/μL AlexaFluor 633 dye in DMSO stock solution at room temperature overnight. The solution was then dialyzed (14 kDa MWCO Pierce Snakeskin® membrane) against running deionized water for 24 hours, then transferred from the dialysis membrane to 50 mL Falcon tubes and flash frozen in liquid nitrogen. The fluorescently labeled chitosan was then recovered by lyophilization until a dry fibrous solid was achieved.
Carbodiimide-based conjugation of USPIO NPs and chitosan
The targeted molar ratio of chitosan molecules to carboxylated iron oxide NPs chosen was 5:1 such that each nanoparticle should be surface conjugated to approximately five chitosan molecules, affording a high degree of surface coverage. In order to achieve this ratio with a 175,000-kDa chitosan glutamate salt and 5 nm NPs, 0.2 mL of AlexaFluor 555-labeled NP stock (at 3.5 × 10⁻⁹ mol NPs) was conjugated to 0.7 mL AlexaFluor 633-labeled chitosan stock (1.75 × 10⁻⁸ mol chitosan) via standard carbodiimide chemistry to conjugate carboxylic acid groups on the NP surface with randomly distributed primary amines on D-glucosamine residues along the chitosan backbone. Stock solutions of 25 mg/mL each of EDC (Pierce) and sulfo-NHS (Thermo Scientific) were prepared in 0.1 M MES buffer prior to conjugation. To prepare the carboxylated nanoparticles for amine conjugation, 16 μL of EDC stock and 44 μl of sulfo-NHS stock were combined in 0.2 mL of NP suspension. The mixture was incubated for 30 minutes at room temperature, rocking gently on an orbital shaker. Then, 0.7 mL of dissolved chitosan stock was added to the nanoparticle suspension, and the solution was placed again on an orbital shaker and the reaction allowed to proceed for 2 hours at room temperature. Free chitosan and other reagents were removed from the nanoparticles by centrifugation in spin columns (300 kDa, Pierce) for 5 minutes at 3000 rpm in a benchtop microcentrifuge (Eppendorf). The flow through was discarded, and the retained nanoparticles were washed within the spin columns 5 × with PBS. Finally, the total resuspension volume of PBS was increased to a total of 500 μL per column. The suspensions from the spin columns were then combined and stored at 4°C.
NSC culture and labeling with USPIO NPs
Adult rat NSCs were cultivated in neurobasal media with B27 supplement (Chemicon) with 20 ng/mL of FGF-2 (Invitrogen) for phenotype maintenance; NSCs were seeded on poly-L-onithine/laminin-coated tissue culture polystyrene (TCPS) vessels (either T25 flasks for expansion or 24-well plates for experimentation). Every third day, 50% of culture media was replaced with fresh media. For performance of differentiation experiments, replacement media was no longer supplemented with FGF–2. For experimentation, NSCs were trypsinized and centrifuged at 300 g for 5 minutes to produce a stable cell pellet, and supernatant media was aspirated away. Cells were washed once with PBS, followed by vigorous pipetting to break up any cell clusters. NSCs were centrifuged again, supernatant PBS discarded, and NSCs resuspended in 1 mL PBS at 5 × 10⁴ cells/mL and with 50 μL of the chitosan–USPIO NP stock solution added to the cells (for a concentration of 30 μg/mL, amount of chitosan–USPIO NP solution was adjusted for other loading concentrations). NSCs were then incubated for 2 hours in suspension within the same centrifuge tube at 37°C in a sterile culture incubator. NSCs were then centrifuged again and washed twice with PBS, centrifuged between washes to remove as many nanoparticles remaining in the supernatant PBS as possible. Supernatant fluid was then removed after a final washing step, and labeled NSCs were resuspended in complete media and cultured in poly-L-ornithine/lamin-coated flasks.
Transmission electron microscopy sample preparation
Roughly 1 million NSCs were prepared for each imaged sample as described above for cells treated with chitosan–USPIO NP or unmodified NP solution at 0, 7.5, 15, 30, and 60 μg/mL loading concentrations for 30 minutes each. NSCs were then prepared for transmission electron microscopy (TEM) by fixation with 2% glutaraldehyde in PBS. Fixed cells were washed three times with PBS and then treated with 1% OsO4 in PBS for contrast enhancement of cellular features. Cells were then washed with distilled water and dehydrated using increasing concentrations of ethanol. Cells were then infiltrated overnight with a 1:1 mixture of epon–araldite and propylene oxide, desiccated, sectioned (100 nm) with a DDK diamond knife on a Reichert–Jung Ultracut E ultramicrotome, and stained with uranyl acetate and lead citrate for contrast enhancement. A Hitachi 7100 transmission electron microscope operating at 75 keV coupled with an AMT Advantage 10 CCD camera system and National Institutes of Health image software was used to acquire images of the sections.
Preparation of NSCs for nuclear magnetic resonance spectroscopy and MRI imaging
NSCs treated with chitosan–USPIO NP or unmodified NP solution at 0, 7.5, 15, 30, and 60 μg/mL loading concentrations were prepared as described above and seeded at 5 × 10⁵ NSCs/mL in a 2 wt/vol% ultra-low melting temperature agarose-in-PBS solution (SeaPrep Agarose; New England Biotech) to mimic in vitro the water-rich environment within brain tissue. Cell suspensions were transferred to 5-mm diameter nuclear magnetic resonance (NMR) tubes (for relaxometry) or to 1.5-mm diameter glass capillary tubes (for MRI imaging) and incubated for 30 min at room temperature to gel the agarose prior to imaging. NSCs in NMR tubes were subjected to relaxometry measurements using a Bruker Minispec (0.47 T) system to measure the transverse relaxation time (T2). NSCs in capillary tubes were subsequently imaged at high resolution using a Bruker Avance DRX 11.7 Tesla microimaging system equipped with a four-turn transverse RF coil, using a T2*-weighted gradient echo. The following parameters were used: TR (repetition time) = 1000 ms, TE (echo time) = 6 ms, slice thickness = 100 μm, field of view = 2.5 mm, and in-plane resolution = 39 μm (64 × 64 matrix).
Immunocytochemical staining of cells
Supernatant media was aspirated away from cells in culture. Cells were then washed twice with PBS, fixed in 4% paraformaldehyde (PFA; Electron Microscopy Sciences, Hatfield, PA) in PBS at room temperature for 45 minutes and simultaneously blocked and permeabilized using Tris-buffered saline (TBS) with 5% donkey serum (Jackson Immunoresearch, West Grove, PA) and 0.25% Triton X-100 (Sigma) for 60 minutes. Primary antibody solutions were prepared in TBS with Triton X-100 but without serum (TBS+). Blocking/permeabilization solution was aspirated away and replaced with primary antibody solution and allowed to incubate overnight at 4°C. Primary antibody solution was aspirated away and samples washed 3 × with TBS+. Secondary antibodies were prepared similarly in TBS+ and incubated for 60 minutes at room temperature. Samples were then washed again 3× with TBS+, and the nuclei stained with DAPI. Primary antibodies were used against MAP2 (neuronal marker, rabbit, Abcam, 1:500 dilution), GFAP (astrocyte marker, mouse, Abcam, 1:1000 dilution), and Nestin (NSC marker, rabbit, Abcam, 1:1000 dilution). Corresponding secondary antibodies were used to label the primary antibodies – DyLight 488-conjugated goat anti-rabbit immunoglobulin (Ig)G antibody (Jackson Immunoresearch, 1:250 dilution) and DyLight 488-conjugated goat anti-mouse IgG antibody (Jackson Immunoresearch, 1:250 dilution). Fluorescence imaging was performed on a Leica TCS SP5 confocal fluorescence microscope.
Results and discussion
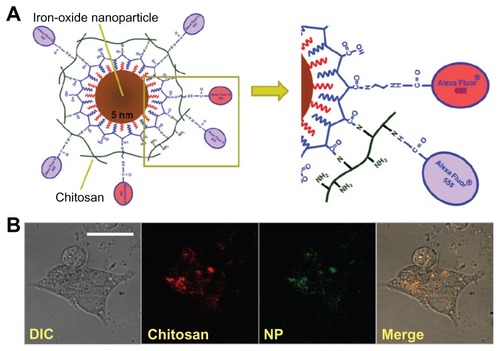
Chitosan–USPIO NPs were synthesized as described above and shown in , with the chitosan and nanoparticle surfaces independently fluorescently labeled with amine reactive AlexaFluor 555 and 633 carboxylic acid succinimidyl esters (Invitrogen), respectively, for multicolor tracking of uptaken particles. The apparent sizes and zeta potentials of the constituents and chitosan–USPIO NPs, as measured by dynamic light scattering, are given in Supplementary Figure 2, yielding a final apparent NP diameter of roughly 120 nm, well within the range of permissable sizes for endocytic uptake. Double fluorescent labeling of chitosan and NP surface enables fluorescence-based tracking of each component independently to study intracellular chitosan– USPIO NP trafficking with time. For example, within the cell, chitosan may be enzymatically cleaved from the particle surface, and so beyond uptake, chitosan and NPs may be trafficked dissimilarly.
Figure 1 Chitosan–USPIO NP design and confocal fluorescence imaging of labeled cells. (A) Schematic diagram of chitosan/iron oxide nanoparticle conjugate (chitosan–USPIO NP). The fractionally aminated nanoparticle surface is labeled with an amine reactive AlexaFluor 633 fluorescent dye. Chitosan is similarly labeled with an Alexa Fluor® 555 dye and conjugated to the nanoparticle surface via carbodiimide chemistry. (B) DIC and confocal fluorescence micrographs of fluorescent chitosan– USPIO NPs loaded at low concentration (1 μg/mL) into NSCs in adherent culture on laminin-coated coverslips.
Note: The two fluorescent channels overlay and the particles appear to cluster within the cell, outside of the nucleus, 2 hours after cell labeling (scale bar 50 μm).
Abbreviations: USPIO NPs, ultrasmall superparamagnetic iron oxide nanoparticles; DIC, Differential Interference Contrast; NSCs, neural stem cells.
Confocal microscopy initially revealed the presence of chitosan–USPIO NPs within NSCs incubated with these particles, with overlapping fluorescence emission for the labeled chitosan and NPs at the earliest time points (). For a more detailed analysis over time, 2 hours after labeling, each labeled component was simultaneously but independently subjected to tracking by time-lapse, confocal, fluorescence imaging, with quantification of integrated mean fluorescence intensity within a single focal plane within cells (Supplementary Figure 3). These measurements showed that USPIO NP mean fluorescence intensity changed markedly over small time scales (Supplementary Figure 3, bottom graph), suggesting the movement of fluorescent packets into and out of the plane of imaging (ie, nanoparticles in membranous vesicles). In contrast, chitosan fluorescence intensity (Supplementary Figure 3, top graph) did not display as much variability over small time scales, suggesting that chitosan is present in a more distributed way inside and, more importantly, also outside of vesicles, with some chitosan detaching from the NP surface and escaping from membranous vesicles over hours. Detectable chitosan escape seems to foreshadow NP endosomal escape, with some chitosan making its way out of the vesicle at early time points but not enough to hinder later chitosan–USPIO NP escape, as discussed in detail further below.
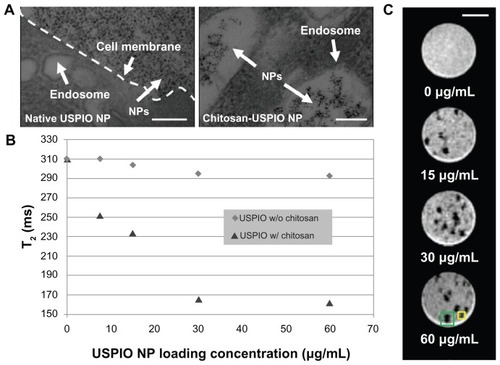
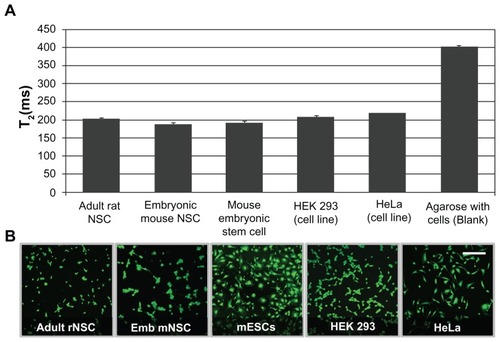
In order to characterize further chitosan–USPIO NP uptake in comparison to native USPIO NP uptake, TEM imaging, NMR relaxometry, and MRI imaging were applied. NSCs were treated with chitosan-modified and unmodified NPs over a range of concentrations spanning 0–60 μg/mL. TEM revealed that chitosan–USPIO NP uptake was achieved after incubation in as low as 7.5 μg/mL suspension of chitosan–USPIO NPs, with these nanoparticles visible exclusively within endosomes following uptake. In contrast, particles were not appreciably visible in cells treated with suspensions of native USPIO NPs, although they were visible in abundance outside of these cells close to the cell membrane (). In order to demonstrate the difference, the TEM sample treated with native USPIO NPs shown in was not subjected to washing steps for removal of NPs that were not uptaken by cells. Similarly, NMR relaxometry was utilized to measure the T2 of properly washed samples at various native and chitosan-modified USPIO NP concentrations. In these experiments, shorter T2 indicates a higher USPIO NP content and implies improved imaging contrast by T2*-weighted cellular MRI (Supplementary Figure 1). With NSCs, NMR spectroscopy indicated little appreciable uptake at any concentration of native NPs, consistent with TEM data. However, significant uptake of chitosan-modified USPIO NPs was observed, with the extent of nanoparticle uptake, within the range of 0–30 μg/mL, proving strongly incubation dose dependent (). Above 30 μg/mL, the additional increase in uptake of chitosan-modified USPIO NPs was severely diminished, likely indicating a surface saturation condition for the attaching nanoparticles. Finally, NSCs prepared similarly were seeded in a hydrated, soft, agarose gel and were imaged at high resolution using an 11.7 Tesla microimaging system with a 100-μm slice thickness, 2.5-mm field of view, and 39-μm in-plane resolution. As shown in , individual NSCs and small NSC clusters were visible over a broad range of labeling concentrations, spanning 15–60 μg/mL, providing proof of principle for chitosan– USPIO NP-enabled imaging at a resolution approaching the single-cell scale.
Figure 2 TEM, NMR spectroscopy and cellular MRI applied to NSCs treated with native as well as chitosan–USPIO NPs demonstrate chitosan-enhanced endocytic NP uptake. (A) Transmission electron micrographs of cells exposed to native NPs and chitosan–USPIO NPs. Without chitosan, few NPs appear within the cell; however, with chitosan, NPs appear within membranous vesicles within 2 hours of NP exposure at 15 μg/mL (scale bars 100 nm). (B) NMR transverse relaxation measurements (n = 3) reveal a loading dose dependence of chitosan–USPIO NP uptake from 0 to 30 μg/mL, above which a saturation condition appears to dominate with little gain in uptake with increased loading dose. (C) T2*-weighted cellular MRI (11.7 T) images of chitosan–USPIO NP-labeled single NSCs (yellow box) and small NSC clusters (neurospheres; green box) within 2 wt% agarose-in-PBS gels.
Note: Cells are apparent at each concentration as localized regions of signal hypointensity (scale bar 500 μm).
Abbreviations: TEM, transmission electron microscopy; NMR, nuclear magnetic resonance; MRI, magnetic resonance imaging; NSCs, neural stem cells; USPIO NPs, ultrasmall superparamagnetic iron oxide nanoparticles; PBS, phosphate-buffered saline.
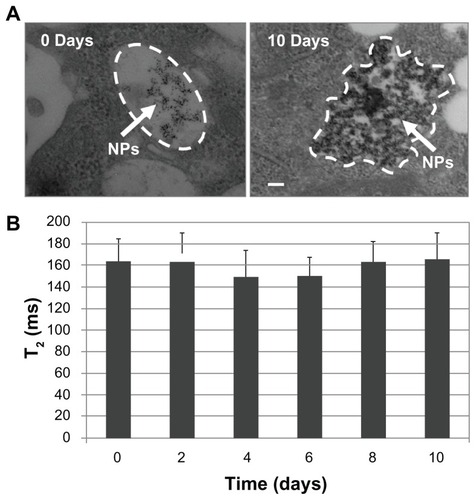
Furthermore, NSCs containing NPs were maintained under sterile culture conditions for 10 days and subjected to TEM and NMR relaxation studies over this period to evaluate NP retention. TEM showed that uptaken particles were initially contained within endocytic (membranous) vesicles (, left). However, between the day of uptake and day 10 post uptake, many particles achieved endosomal escape. These particles were observed within larger aggregates, free within the cytoplasm (, right) where they resided for several days after. This endosomal escape and corresponding long-term retention is supported by NMR relaxometry data (), offering an explanation for how particles remain in cells for many days beyond uptake without being rapidly trafficked through the endo-lysosomal pathways leading to exocytosis. For NMR relaxometry measurements, labeled NSCs were kept in culture until the day of measurement, trypsinized, centrifuged, and washed two times to remove potentially secreted NPs and then embedded in agarose gel in NMR tubes for T2 measurements as reported in .
Figure 3 TEM and NMR relaxometry confirm endosomal escape of chitosan- USPIO NPs and their long-term retention by NSCs. (A) Transmission electron micrographs of cells containing chitosan-USPIO NPs on day 0 and 10 of culture. On day 0, NPs are apparent within membranous vesicles within the cell; however, on day 10, NPs are found in irregularly shaped clusters within the cytosol (ie, outside of vesicles), appearing to have achieved endosomal escape, bypassing rapid lysosomal trafficking out of the cell (scale bar 50 nm). (B) NMR relaxometry measurements (mean ± SD, n = 3) of NSCs containing chitosan–USPIO NPs (loading dose 15 μg/mL) taken at 2-day intervals confirm the presence of NPs at concentrations comparable to those just after loading over 10 days of culture, indicating NP retention for at least this period.
Abbreviations: TEM, transmission electron microscopy; NMR, nuclear magnetic resonance; USPIO NPs, ultrasmall superparamagnetic iron oxide nanoparticles; NSCs, neural stem cells.
In this context, endosomal escape is likely achieved due to a combination of increasing chitosan charge density within the endosome as acidification proceeds and also a reduction in endosome compartmental volume from membrane recycling. By calculation, using Katchalsky’s equation relating chitosan amino-group pKa,Citation27 environmental pH, and charge density (1 − α):
an 85% deacytelated chitosan with pKa = 6.5 realizes its highest charge density at roughly pH 5 (Supplementary Figure 4), achieved in the late endosome, corresponding to the stage of smallest endosomal volume.Citation29,Citation30 At the highest chitosan charge density and smallest endosomal compartmental volume, it is presumable that escape occurs during or before the late endosome stage by (1) membrane rupture due to internal charge repulsion and (2) osmotic swelling of the vesicle via the “proton sponge effect” within roughly 24 hours of uptake.Citation30 Escaped particles have then avoided trafficking through lysosomal pathways and remain in the cytosol for at least 10 days (), enabling cell tracking over the same period.
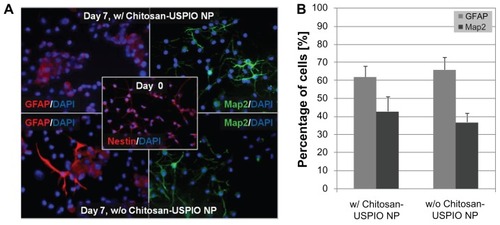
After demonstrating efficient labeling of NSCs with these nanoparticles, cellular viability, expansion rate, and differentiation potential were assessed for NSCs exposed to our chitosan–USPIO NPs as well as for untreated control NSCs in order to evaluate if labeling with chitosan–USPIO NPs has any negative impact on NSC fate. Live/dead viability assay (CalceinAM/EtBr; Invitrogen) 12 hours, as well as 1 day and 10 days after loading (Supplementary Figure 5), revealed no quantifiable cytotoxicity for the chitosan–USPIO NPs. Proliferation rates were determined using WST-1 assays for NSCs labeled with 30 μg/mL chitosan–USPIO NPs and unlabeled NSCs. The proliferation rate for NSCs exposed to chitosan–USPIO NPs was determined to be 24.7 ± 3.1 hours, which was not significantly different from the proliferation rate of unlabeled NSCs of 21.7 ± 2.5 hours (n = 3). Similarly, the differentiation potential (determined as fractions of MAP2+ neurons and GFAP+ glial cells by immunostaining) were comparable for cells treated with chitosan–USPIO NPs and untreated controls (). These data indicate that USPIO NP labeling does not negatively affect cellular proliferation or differentiation; however, additional future studies characterizing the genomic-level influence of these particles on labeled cells are warranted.
Figure 4 Indirect immunofluorescence staining of NSCs and NSC-derived cells for stem cell and differentiation markers (cells either labeled with 15 μg/mL chitosan–USPIO NPs or unlabeled as controls). (A) NSC differentiation is unaffected by chitosan–USPIO labeling. Immunofluorescence staining reveals abundant cells positive for Nestin (NSC marker) on Day 0 and indistinguishable cell fractions positive for MAP2 (neuronal marker) or GFAP (astroglial marker) on Day 7 of NSC culture in differentiation media (NSC media, without growth factors, with fetal calf serum and retinoic acid). (B) Quantification of immunostaining for MAP2- and GFAP-positive cell fractions illustrates comparable results for NSCs with and without chitosan–USPIO NPs (n = 3 samples).
Abbreviations: NSCs, neural stem cells; USPIO NPs, ultrasmall superparamagnetic iron oxide nanoparticles.
Finally, as our labeling technique does not involve any NSC-specific methodology, we tested the general applicability of this labeling strategy using a variety of primary and immortalized cell types. Adult rat hippocampal NSCs, mouse cortical NSCs, mouse embryonic stem cells, HEK 293 kidney cells, and HeLa cervical cancer cells were exposed to chitosan–USPIO NPs at 5 × 10⁴ cells per cell type. All cells were labeled at a chitosan–USPIO NP concentration of 15 μg/mL for 2 hours, washed as described, and then transferred to 10-mm NMR tubes for relaxometry measurements or seeded in a 24-well plate for live/dead assessment. Based on measured T2 values (), NP loading efficiency was similar for each sample of each cell type, indicating broad applicability of our labeling scheme. Similarly, the live/dead viability assay 2 hours after loading revealed no quantifiable cytotoxicity for the chitosan– USPIO NPs, irrespective of cell type (). These data support chitosan functionalization as a compelling choice for efficient NP delivery to NSCs and also potentially a wide variety of other primary and immortalized cell types.
Figure 5 NMR relaxometry measurements and live/dead (CalceinAM/EtBr) fluorescence staining of primary and immortalized cell types (all cells labeled with 15 μg/mL chitosan– USPIO NPs). (A) NMR relaxometry measurements of rat hippocampal NSCs, mouse cortical NSCs, mouse embryonic stem cells, HEK 293 kidney cells, and HeLa cervical cancer cells, 12 hours after loading and washing indicated comparably efficient labeling with NPs for each of the cell types. (B) Live/dead (CalceinAM/EtBr) staining of cells 12 hours after loading showed no significant cytotoxic effect on cells, irrespective of cell type, with cells of each type exhibiting characteristic morphologies (scale bar 50 μm).
Abbreviations: NMR, nuclear magnetic resonance; NSCs, neural stem cells; USPIO NPs, ultrasmall superparamagnetic iron oxide nanoparticles.
Conclusion
In conclusion, chitosan–USPIO NPs offer an efficient approach for magnetic labeling of cells, enabling cellular MRI-based tracking at the single-cell scale in vitro and potentially also in vivo over extended periods of time. TEM and NMR relaxometry confirmed endosomal chitosan–NP uptake, subsequent endosomal escape, and cytosolic retention by NSCs over a broad range of chitosan–NP loading concentrations. NSC viability and differentiation potential were unaffected by the labeling process, and cellular MRI demonstrated detection of single cells and small clusters of cells containing chitosan–NPs at close to single cell resolution. Additionally, a variety of primary and immortalized cell types were similarly labeled with comparable high efficiencies, with each sample exhibiting high viability and cellular morphologies characteristic of the cell line. These data support the notion that chitosan–USPIO NPs may be used as a general approach to efficiently magnetically label cells, with tremendous promise for development and evaluation of cellular therapies in in vitro tissue models as well as animal models of human disease.
Acknowledgments
The authors thank the Molecular Biosensors and Imaging Center for access to cell culture facilities, the Philip and Marsha Dowd Seed Fund, Pittsburgh Life Sciences Greenhouse, the Pittsburgh NMR Center (NIH P41 EB001977), and the National Science Foundation (CAREER Award: 0748062) for support.
Disclosure
The authors report no conflicts of interest in this work.
Supplementary figures
Figure S1 Chitosan–USPIO NPs exhibit superior T2 relaxivity (192.0 mM−1 (Fe) s−1) from 0 to 0.22 mM Fe.
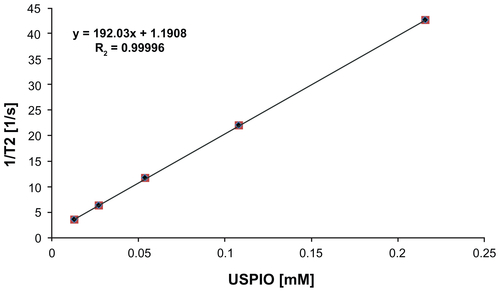
Figure S2 Dynamic light scattering and zeta potential measurements (Zetasizer Nano ZS, Malvern Instruments) for chitosan, USPIO NPs, and chitosan–USPIO NPs. (A) Apparent diameter distributions of NPs and NP constituents are measured in PBS, at concentrations presented in materials and methods for chitosan–USPIO NP synthesis. (B) Mean apparent diameter and zeta potential for chitosan, USPIO NPs, and chitosan–USPIO NPs show an increase in apparent NP size after chitosan conjugation and show a significant change to a positive value for zeta potential.

Figure S3 Mean fluorescence intensity of a confocal optical section for chitosan (red) and NP (green) fluorescence channels over time.
Notes: Chitosan mean fluorescence intensity changes markedly over small time scales, indicating fluorescent parcels entering and leaving the plane of imaging (ie, nanoparticles in membranous vesicles). Chitosan fluorescence intensity does not display such variability over small time scales, suggesting that chitosan is distributed more uniformly, also outside of vesicles, detaching and escaping with time from the NP surface (scale bar 10 μm).
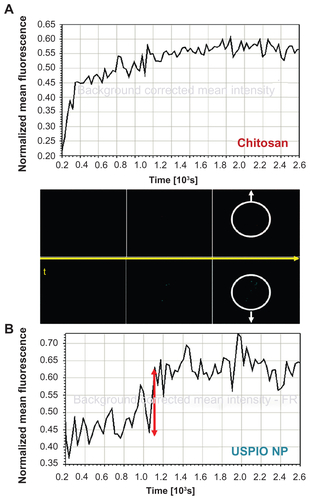
Figure S4 Increase in chitosan charge with decreasing pH.
Note: Fraction of charged amino groups (1 − α) on 85% deacytelated chitosan with
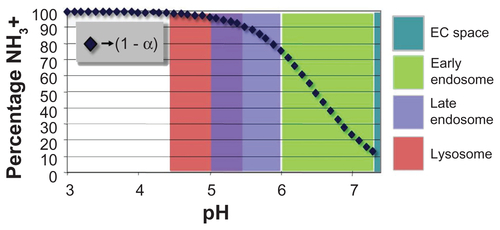
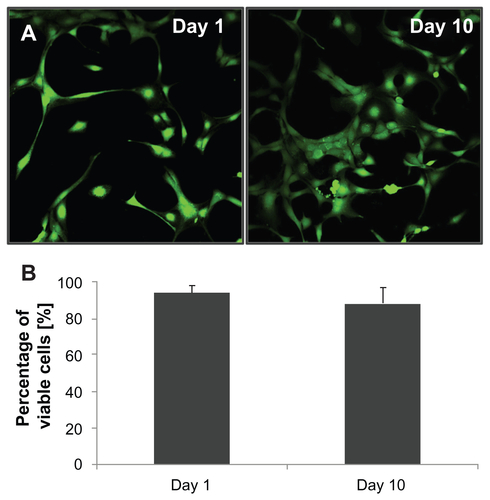
Figure S5 Live/dead® cell viability assay for NSCs after treatment with chitosan– UPSIO NPs on Day 1 (24 hours after treatment) and Day 10. (A) Calcein-AM staining for live cells confirms a typical, adherent, NSC morphology on each day. (B) Quantification of living cell fraction was performed on Day 1 and Day 10 and revealed a high viable cell fraction with no significant difference between time points.
References
- DoetschFCailleILimDAGarcia-VerdugoJMAlvarez-BuyllaASubventricular zone astrocytes are neural stem cells in the adult mammalian brainCell199997670371610380923
- GageFHMammalian neural stem cellsScience200028754571433143810688783
- LoisCGarcia-VerdugoJMAlvarez-BuyllaAChain migration of neuronal precursorsScience199627152519789818584933
- ReynoldsBAWeissSGeneration of neurons and astrocytes from isolated cells of the adult mammalian central nervous systemScience19922555052170717101553558
- PalmerTDTakahashiJGageFHThe adult rat hippocampus contains primordial neural stem cellsMol Cell Neurosci1997863894049143557
- ErikssonPSPerfilievaEBjork-ErikssonTNeurogenesis in the adult human hippocampusNat Med1998411131313179809557
- PluchinoSQuattriniABrambillaEInjection of adult neurospheres induces recovery in a chronic model of multiple sclerosisNature2003422693368869412700753
- YandavaBDBillinghurstLLSnyderEY“Global” cell replacement is feasible via neural stem cell transplantation: evidence from the dysmyelinated shiverer mouse brainProc Natl Acad Sci U S A199996127029703410359833
- BjorklundALindvallOCell replacement therapies for central nervous system disordersNat Neurosci20003653754410816308
- BjugstadKBTengYDRedmondDEJrHuman neural stem cells migrate along the nigrostriatal pathway in a primate model of Parkinson’s diseaseExp Neurol2008211236236918394605
- ParkKITengYDSnyderEYThe injured brain interacts reciprocally with neural stem cells supported by scaffolds to reconstitute lost tissueNat Biotechnol200220111111111712379868
- TengYDLavikEBQuXFunctional recovery following traumatic spinal cord injury mediated by a unique polymer scaffold seeded with neural stem cellsProc Natl Acad Sci U S A20029953024302911867737
- PastoriCLibrizziLBreschiGLArterially perfused neurosphere-derived cells distribute outside the ischemic core in a model of transient focal ischemia and reperfusion in vitroPLoS ONE200837e275418648648
- BjornerudAJohanssonLThe utility of superparamagnetic contrast agents in MRI: theoretical consideration and applications in the cardiovascular systemNMR Biomed200417746547715526351
- WuYLYeQFoleyLMIn situ labeling of immune cells with iron oxide particles: an approach to detect organ rejection by cellular MRIProc Natl Acad Sci U S A200610361852185716443687
- DoddSJWilliamsMSuhanJPWilliamsDSKoretskyAPHoCDetection of single mammalian cells by high-resolution magnetic resonance imagingBiophys J1999761 Pt 11031099876127
- KannoSLeePCDoddSJWilliamsMGriffithBPHoCA novel approach with magnetic resonance imaging used for the detection of lung allograft rejectionJ Thorac Cardiovasc Surg2000120592393411044319
- YeQYangDWilliamsMIn vivo detection of acute rat renal allograft rejection by MRI with USPIO particlesKidney Int20026131124113511849467
- ArbabASYocumGTWilsonLBComparison of transfection agents in forming complexes with ferumoxides, cell labeling efficiency, and cellular viabilityMol Imaging200431243215142409
- JanjicJMSrinivasMKadayakkaraDKAhrensETSelf-delivering nanoemulsions for dual fluorine-19 MRI and fluorescence detectionJ Am Chem Soc200813092832284118266363
- ChakrabortySKFitzpatrickJAPhillippiJACholera toxin B conjugated quantum dots for live cell labelingNano Lett2007792618262617663586
- ShahBSClarkPAMoioliEKStroscioMAMaoJJLabeling of mesenchymal stem cells by bioconjugated quantum dotsNano Lett20077103071307917887799
- RuoslahtiERGD and other recognition sequences for integrinsAnnu Rev Cell Dev Biol1996126977158970741
- RoyKMaoHQHuangSKLeongKWOral gene delivery with chitosan – DNA nanoparticles generates immunologic protection in a murine model of peanut allergyNat Med19995438739110202926
- MaoHQRoyKTroung-LeVLChitosan-DNA nanoparticles as gene carriers: synthesis, characterization and transfection efficiencyJ Control Release200170339942111182210
- CorsiKChellatFYahiaLFernandesJCMesenchymal stem cells, MG63 and HEK293 transfection using chitosan-DNA nanoparticlesBiomaterials20032471255126412527266
- StrandSPTommeraasKVarumKMOstgaardKElectrophoretic light scattering studies of chitosans with different degrees of N-acetylationBiomacromolecules2001241310131411777408
- SorlierPDenuziereAVitonCDomardARelation between the degree of acetylation and the electrostatic properties of chitin and chitosanBiomacromolecules20012376577211710030
- MurphyRFMaturation models for endosome and lysosome biogenesisTrends Cell Biol199114778214731781
- StorrieBEndosomes and Lysosomes: A dynamic relationship1StorrieBaMRFElsevier1993216