 ?Mathematical formulae have been encoded as MathML and are displayed in this HTML version using MathJax in order to improve their display. Uncheck the box to turn MathJax off. This feature requires Javascript. Click on a formula to zoom.
Abstract
Nonexcitable cell types, fibroblasts of heart muscle or astrocytes, are well known for their spontaneous Ca2+ oscillations. On the other hand, murine fibroblast (L929) cells are known to be deficient in cell–cell adhesive proteins and therefore lack gap junctions for cellular communication. However, these cells exhibit a unique property of collectively synchronized and spontaneous oscillation, as revealed by real-time monitoring of cells cultured on a 250-μm diameter microelectrode for more than 3 days using an electrical cell-substrate impedance-sensing system (ECIS). Live-cell imaging is a widely used technique for oscillation detection, but it has limitations relating to cellular physiological environment maintenance for microscopic analysis and for prolonged periods of study. The present research emphasizes an electrical-sensing technique (ECIS) capable of overcoming the most important issues inherent in live-cell imaging systems for the detection of L929 cellular spontaneous and synchronized oscillation in real-time for longer periods. Possible mechanisms involved in L929 oscillation were elucidated to be periodic extension/contraction of lamellipodia continued as blebbing, which is produced by signals from the actomyosin complex initiated by connexin hemichannel opening and adenosine triphosphate (ATP) release. By applying the connexin hemichannel inhibitor, flufenamic acid, the hindrance of ATP release and calcium transients were analyzed to elucidate this hypothesis.
Introduction
Spontaneous oscillations in biological systems have been elaborately studied. Oscillations in yeast cells,Citation1 amoebae Dictyostelium discoideumCitation2 and pancreatic isletsCitation3 were studied for their regulatory action. Furthermore, spontaneous Ca2+ oscillation regulates neuronal cell growth, axon outgrowth, and differentiation.Citation4 In addition to neuronal cells, cultured cardiac myocytes oscillate synchronously and spontaneously upon changes in several physiological conditions, including extracellular Ca2+ or adenosine triphosphate (ATP) concentration.Citation5 Synchronized oscillation was also studied in nonexcitable cells for the regulation of mucociliary clearance in the epithelia of airways or for the initiation and directed migration of human astrocytoma cells as a wound-healing model.Citation6
Generally, in most cellular systems, calcium plays an active role as a signaling molecule for synchronized oscillation. Gap junctions comprised of two connexin hemichannels are intercellular communication platforms that support the direct transfer of molecules such as Ca2+ between the cytosols of neighboring cells.Citation7 The present group studied mouse fibroblast cells (L929) that are reported to be deficient in gap junctions, although these cells express connexin-43 in their plasma membranes.Citation8 L929 cells fall under the category of nonoscillatory cells, which have been studied after biochemical treatment for the elucidation of several oscillatory phenomena. For example, nocodazole treatment can depolymerize microtubules, resulting in shape oscillations of L929 cells and nucleus-less cell fragments.Citation9
Live cell imaging is commonly used by researchers to study dynamics or physiological or phenotypical changes in single cells using fluorescent markers to detect particular biomolecules of interest.Citation10 Live-cell microscopy possesses various advantages, including automated monitoring of cell behavior for various time periods with comparatively less amount of sample required compared with other conventional methods such as electrophoretic mobility shift assay or Western blotting. However for cell imaging, cells of interest should be grown in an optimized manner for microscopic analysis. Further, the maintenance of cellular physiological environments is desired for keeping cells stable throughout imaging experiments. Microscopic analysis can only study a small number of cells, and interpretation of single cell behavior has to be done to understand population-based behavior. In most cases, cellular population shows distinctive behaviors that cannot be comparable with the results of collective single cell behavior. Oscillation is one of these population-based behaviors that must be analyzed on group of cells.
Electric cell-substrate impedance-sensing (ECIS) is an emerging bioimpedance technique for the quantification of cellular adhesion, proliferation, and other cellular behaviors such as oscillation. When cells are grown on a small gold electrode of an ECIS chip, the cell membranes acts as insulators to resist current flow across the cell layer; and thereby impedance increases. Change in impedance of an ECIS system reflects the behavior of cells on an electrode. The size of the electrode is normally 250 microns in diameter and has on average about 100 cells attached, which in turn determines the collective behavior of the cellular population. This method is noninvasive as the alternating current (AC) is below 0.010 V. The most important advantage of an ECIS system over other oscillation detection methods is that it can analyze cellular behavior in real-time for more than 3 days without any special requirements relating to the cellular environment. Using this instrument, cell behaviors such as attachment, cytotoxicity, proliferation, motility, wounding and migration, angiogenesis, cell invasion, barrier function, and signal transduction can be analyzed. Further, it has been used successfully to study calcium oscillation in bradykinin-stimulated Madin–Darby canine kidney (MDCK) cells.Citation11
In this study, an ECIS system was used to evaluate a unique property of gap junction-deficient L929 cells that spontaneously start synchronous oscillation. This study suggests various possible mechanisms in accordance with the impedance fluctuations observed during L929 synchronous oscillation. Those mechanisms were elucidated by applying specific inhibitors and analysis by calcium imaging or ATP quantification.
Material and methods
Mouse fibroblast cells (L929) were cultured in culture medium composed of Dulbecco’s modified Eagle’s medium (DMEM) containing 10% fetal bovine serum (FBS), 100 U/mL of penicillin, 100 μg/mL of streptomycin, and 1 mM sodium pyruvate under a humidified atmosphere at 37°C and 5% CO2. For oscillation analysis using the ECIS system, cells were taken from subconfluent cultures about 48 hours after passage. The cells were washed with phosphate-buffered saline (PBS), trypsinized, and centrifuged to collect the cell pellet. The density of the cell pellet was measured using trypan blue and a standard hemocytometer. The cell suspension was adjusted to total number of 9 × 10⁵ cells, and the final cell concentration in each well was 105 cells. L929 cells were also grown on glass Petri dishes separately for microscopic analysis.
The ECIS software, electrode array (eight-well, one-electrode array; 8 W1E), and lock-in amplifier for the oscillation experiments were purchased from Applied Biophysics (Troy, NY). An 8 W1E array is composed of eight wells each containing a single 250 μm-diameter gold electrode. The eight wells of the 8 W1E array were rinsed with serum-free culture medium. The single circular detection electrode in each well is linked with a common counter electrode. For better understanding, the photograph of ECIS 8W1E array was provided in the supporting information (supplementary data, Figure S1). For the experiments, counter and detection electrodes were connected to a lock-in amplifier of the ECIS system, and a 1 V alternating current (AC) was applied through a 1 MΩ resistor. ECIS system works simply based on Ohm’s law where the applied AC current (I) and the resulting voltage (V) across the electrodes of the ECIS system provide the impedance (Z).
The impedance, the AC equivalent to resistance, is the parameter used to study cellular behavior. The electrolytes-containing culture medium conducts current between detection and counter electrodes. After all prerequisites for ECIS instrumentation were met, 105 L929 cells were added to each well of the ECIS array. The final volume of each well was adjusted to 400 μL with culture medium. Cells adhering on the detection electrode interfere with the current flow, which in turn is measured as impedance. The impedance of each well was measured continuously at 16 kHz for 78 hours, and the data were analyzed using the ECIS software.
Vero cells (African green monkey kidney epithelial cells) were cultured similarly to L929 cells and were studied in the ECIS system for comparison purposes. Of the eight wells of the ECIS array, three wells were seeded with vero cells, three wells with L929 cells, and two wells with cell-free culture medium were analyzed. For better understanding, the results of the single wells, each with L929 cells, vero cells, and cell-free medium are presented in this paper. Other results are provided in the supplementary data (Figure S2).
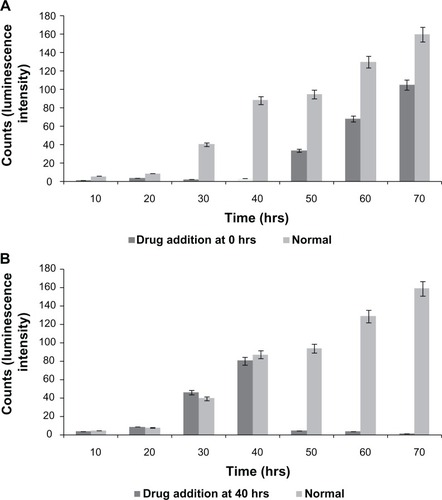
Flufenamic acid (FFA) is a drug that has the potency to inhibit connexin hemichannels and therefore inhibition of connexin-43-based cellular communication.Citation12 FFA was prepared in 100 μM concentration and added to the L929 cultures at different time periods (0 and 40 hours). For calcium imaging and ATP quantification, L929 cells were cultured on 24-well tissue culture plates. In parallel, cellular oscillation behavior with drug was monitored using the ECIS system. Before Ca2+ imaging, L929 cells were cultured with 10 μM Fura-AM molecular probe (Sigma-Aldrich, St Louis, MO) for 1 hour at 37°C. Then the Images were obtained at different time intervals (20, 40, 50, and 70 hours with and without FFA) using fluorescence microscope with excitation wavelength of 330–350 nm. Quantitative analysis of ATP was done by utilizing adenosine 5′-triphosphate (ATP) bioluminescent assay kit and a luminometer. For ATP analysis, at specific time intervals (10, 20, 30, 40, 50, 60, and 70 hours with or without FFA), supernatant of the culture were collected and used for luminescence analysis using standard procedure for ATP assay kit.
Results and discussion
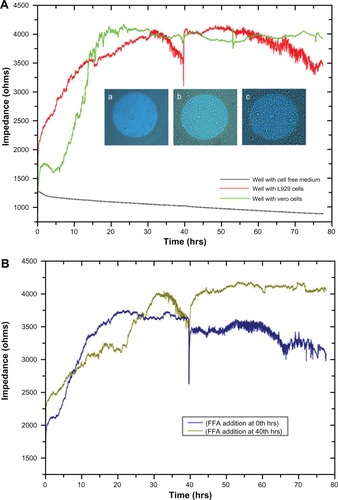
As the L929 and vero cells attached to the substratum, ie, to the detection microelectrode, the current flow between the counter and detection electrodes is impeded, which results in increased impedance. shows increased impedance from 1500 Ω to approximately 4000 Ω with respect to cellular attachment and spreading in the first 15 hours. Optical microscopic images of the gold microelectrode of the ECIS array and cell spreading over the electrode at different time periods are shown in the inset. No significant increase in impedance was observed after 15 hours until 30 hours, which indicates cell confluency in the ECIS wells and the electrodes. There is no more space on the electrode for the cells to proliferate and thereby no increase in impedance was observed. From 30 hours, L929 cells showed regular fluctuations in impedance until 40 hours. In addition, impedance was shown to collectively decrease. However, vero cells did not show any huge impedance fluctuations as observed in L929 cells. Instead, they had the same impedance level throughout the experiment even after the addition of culture medium at different time periods after 40, 54, and 75 hours. Right after the addition of culture medium to the wells with both types of cells, an impedance drop occurred; which is probably due to the disturbances of the cells and a change in temperature. After the addition of culture medium at 40 hours to the ECIS wells containing L929 cells, synchronized oscillation was disturbed and the cells remained attached firmly to the electrode, which caused the impedance to rise back to the original position. L929 cells started synchronizing their oscillatory behavior spontaneously at 50 hours, which lasted throughout the experiment. A decline in collective impedance was also observed from 55 hours until the completion of the experiment, which was similar to the oscillation from 30 to 40 hours. In the case of the well with cell-free medium, the impedance of 1250 Ω at the starting point gradually declined to 900 Ω at the end of the experiment. This gradual decline is caused by the minute deposition of electrolytes and proteins from the culture medium on the detection electrode, which impedes the current flow between detection and counter electrodes. However the decline is really small, with about 350 Ω throughout the experiment, which is negligible when compared to the decline observed for the L929 cellular oscillatory decline within 10 hours (30 to 40 hours) and 20 hours (55 to 75 hours). The so-called impedance fluctuations in L929 cells are believed to be due to spontaneous and synchronous oscillation of the cells, as they appear without addition of oscillation-inducing drugs. It has been reported that oscillation of nonmuscle L929 fibroblast cells can be induced through microtubule depolarization using nocodazole treatment.Citation13 It is also known that periodic and rhythmic oscillations are a special characteristic of a few cell types such as cardiomyocytes and astrocytes.Citation5,Citation14 Interestingly, the present research observed spontaneous and rhythmic oscillation of nonmuscle fibroblast cells through continuous real-time monitoring of cellular behavior using an ECIS system. Based on the theory reported by Giaever and Keese,Citation15 it was suggested that these large, periodic impedance fluctuations cannot be observed if the individual cells on the electrode oscillate randomly. This rhythmic oscillation can only occur if most of the cells, but maybe not all, on the electrode are moving together. This implies that there should be some interesting unknown communication mechanism between gap junction-deficient L929 fibroblast cells.
Figure 1 (A) Impedance measurement graph of cells grown on ECIS wells from 0 to 78 hrs. Inset shows the optical microscopic images of cells on circular detecting microelectrodes of ECIS wells, in which the images were taken (a) once after the cell addition, (b) after 10 hrs, and (c) after 15 hrs. (B) Impedance measurement of L929 cells with connexin hemichannel inhibitor (FFA).
Abbreviations: ECIS, electric cell-substrate impedance-sensing system; FFA, flufenamic acid.
Giannone’s group elucidated the periodic contraction and extension of lamellipodia in mouse embryonic fibroblasts with respect to an actin-based signaling mechanism.Citation16 The present results demonstrate a similar kind of lamellipodia extension and retraction of L929 cells, as shown in inverse microscopic images taken at 30 minute intervals from 30 hours (; white arrows). This results in the oscillatory motion as shown near 30 hours in an impedance curve (). Microscopic analysis of cells cultured on glass Petri dishes coincides with the oscillatory behavior of cells cultured on gold electrode of ECIS system. This further shows that there is no significant variation in cellular behavior with respect to glass or gold substrate. The power spectrum results shown in (red curve) demonstrate that L929 cell oscillation during the time period from 30 to 40 hours was in the frequency range from 0.1 to 20 Hz. The fast Fourier transform (FFT) with log frequency data shows a clear peak from ∼log 0.5 to ∼log 1.5, which is approximately equivalent to 10 cycles/second (Supplementary data, Figure S3, S4). On the other hand, vero cells had no impact on the power spectrum analysis as seen in (green curve). A maximum power of 400 occurred at 0.1 to 10 Hz for L929 cells, and it approached zero at higher frequencies. These results coincide well with Shahapure et al,Citation17 who found that the biological events of lamellipodia have a frequency up to 10 Hz. The time-frequency spectrum shown in from 30 to 40 hours further supports the above hypothesis. The frequency of oscillation increased with time. At around 40 hours, a maximum frequency of about 10 Hz was observed.
Figure 2 Inverse microscopic images of cells grown on Petri dishes taken at different time periods. A–I are images taken at 30, 30.5, 31, 55, 55.5, 56, 70, 70.5, and 71 hrs, respectively.
Notes: White arrows showing examples of lamellipodium extension and contraction, black arrows indicate retraction of lamellipodium to form approximately round shape, and block arrows show some examples of blebbing activity of L929 cells.
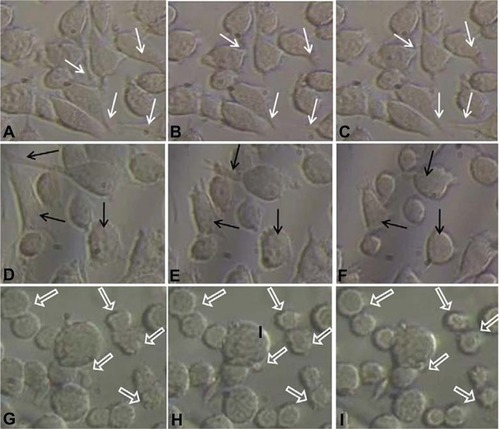
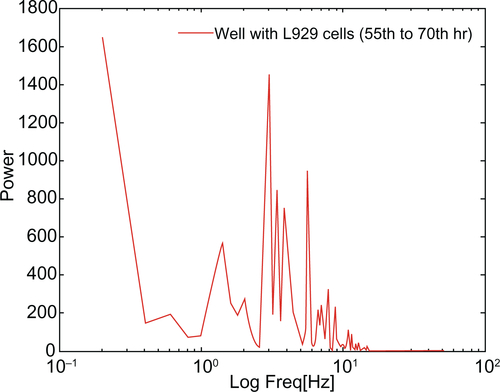
Figure 3 (A) Power spectrum analysis of L929 cellular oscillation compared to vero cells at different time periods from (a) 30 to 40 hrs and (b) 55 to 70 hrs. (B) Time-frequency plots for cellular oscillation. (a) L929 cells (b) vero cells.
Note: Black circles show oscillation frequencies.
Abbreviations: ATP, adenosine triphosphate; ECIS, electrical cell-substrate impedance-sensing system.
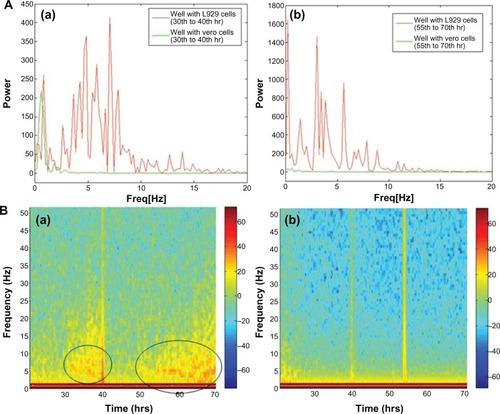
However, during periodic and synchronized oscillation of L929 cells between 30 and 40 hours and between 50 and 78 hours, a collective decrease in impedance was observed. The probable reason for this decline in impedance can be attributed to increased current flow between the counter and detection electrodes due to loosening of cell-substrate adhesion. In other words, cells spread over the electrodes lost their adhesion and compactness, which caused increased current flow between the electrodes resulting in decreased impedance. show the inverse microscopic images of L929 cells taken at 30 minute intervals starting from 55 hours. The images show that the spread cells completely retracted to form an approximate round shape with blebbing activity. (black arrows) clearly shows L929 cellular blebbing activity. In addition, the power spectrum analysis from 55 to 70 hours shows the same oscillation frequency of about 10 Hz (). However, the maximum power spectral value increased from 400 between 30 to 40 hours to 1600 between 55 to 70 hours. Ultimately, the results demonstrate that lamellipodia oscillation continued into blebbing oscillation with high power. The time-frequency spectrum shown in from 55 to 70 hours further supports the above hypothesis. On the other hand, the time-frequency spectrum for vero cells in confirms the absence of spontaneous and synchronous oscillation. Therefore, L929 fibroblast cellular oscillation seems to be a unique behavior when compared with other cell types such as epithelial cells.
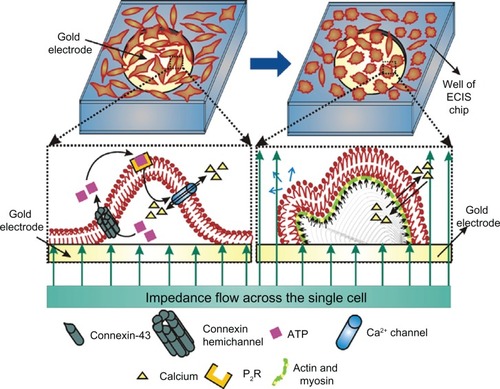
Furthermore, the production of the so-called retraction force could be initiated by the polarization/depolarization of actomyosin of fibroblast cells. This coincides well with a previous study, where the report shows that actin-bound complex-mediated signals are transported through the tip to the lamellipodium base, which in turn produces the traction/retraction force for extension/contraction, respectively.Citation16 Propagation and synchronization of calcium waves or other types of cellular oscillation is normally associated with gap junctions. Connexin-43, a protein normally present in myoblasts, has a major role in gap junction formation when composed into connexons.Citation18,Citation19 When connexin-43 phosphorylated to P1 and P2 forms, it formed a gap junction that regulates the intercellular transport of small molecules such as calcium ions. Later studies have confirmed that L929 cells lack phosphorylation of connexin-43 to the P1 and P2 forms, which in turn leads to gap junction deficiency.Citation20 However, it was elucidated a decade ago that forced expression of connexin-43 in gap junction-deficient cells, including C6 glioma, HeLa cells, and HEK293 cells, activates ATP release through connexin-43 hemichannels to the extracellular space, which in turn induces calcium wave propagation and synchronization.Citation21
summarizes the hypothesized mechanism for L929 cellular oscillations. Since L929 cells are unable to phosphorylate connexin-43 into the P1 and/or P2 forms, they remain as an unphosphorylated connexin hemichannel in plasma membrane. Meanwhile, the hemichannel opens during the cellular motility phase. ATP released through connexin hemichannel binds with the purinergic receptor (P2R), which in turn induces Ca2+ transients. Due to the Ca2+ transients, actin/myosin polarizes and depolarizes, exerting actomyosin contraction and leading to lamellipodium oscillation, which is continued as blebbing.
Figure 4 L929 cellular oscillatory mechanism and relationship with cellular blebbing motility.
Note: Small black arrows along the plasma membrane indicate cellular oscillatory movement and blue arrow indicates blebbing motility.
Abbreviations: ATP, adenosine triphosphate; ECIS, electric cell-substrate impedance-sensing system.
To elucidate the above hypothesis, FFA, a connexin hemichannel inhibitor has been used to show the hindrance of connexin hemichannel mediated release of ATP and Ca2+ transients. demonstrates the L929 cellular oscillation behavior monitored on a ECIS system with respect to the treatment of FFA at 0 and 40 hours. When FFA is added at 0 hours, inhibition of connexin hemichannel opening resulted in inhibition of ATP release, and Ca2+ transients mediated polarization of the actin/myosin complex. The absence of contraction of actomyosin and therefore absence of lamellipodium oscillation was observed. However, the removal of drug and addition of fresh culture medium to the cells at 40 hours triggers the beginning of oscillations similar to the behavior of normal cells in (red curve). FFA addition at 40 hours () shows the inhibition of cellular synchronous oscillation until 78 hours. Whereas, the oscillation similar to the normal cells in (red curve) was observed until the drug addition. These results were further verified by Ca2+ flux analysis by calcium imaging. shows the calcium imaging of L929 cells before and after treatment with FFA. Calcium imaging of normal cells shows highest calcium flux at 40 and 70 hours, which supports the above hypothesis. Addition of FFA either at 0 or 40 hours inhibited the calcium flux and occurrence of oscillation happens immediately after drug washout and replenishment with fresh media. In addition, ATP release involved in subsequent calcium flow across the cell membrane was also measured with ATP bioluminescent assay (). In normal cells without drug treatment, a high amount of ATP release from the cells was observed during 40 and 70 hours with respect to the connexin hemichannel opening. Connexin hemichannel inhibitor FFA inhibits the release of ATP from the cells treated at 0 hours and 40 hours. These results on ATP release via connexin hemichannel coincide well with calcium imaging. An on–off phenomenon of oscillation was obtained with the help of the connexin hemichannel inhibitor, FFA. The use of positive control such as culturing cardiomyocytes or astrocytes would provide better understanding as they are known for their synchronous and spontaneous oscillation. Also, the possibility of release of small molecules other than ATP through connexin hemichannels may have some impact on cellular communication in L929 cells. Therefore, detailed experiments are in progress to further elucidate the above described hypothesis for gap junction-deficient L929 cellular spontaneous and synchronous oscillation.
Figure 5 Fluorescent imaging of calcium flux from L929 cells without drug (FFA) and with drug at different time periods (0 hrs and 40 hrs).
Abbreviation: FFA, flufenamic acid.
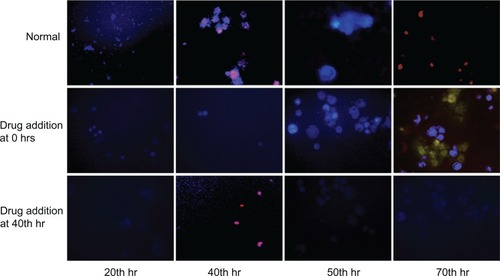
Figure 6 Quantitative analysis of ATP release from L929 cells without drug (FFA) and with drug at different time period (A) at 0 hrs (B) at 40 hrs.
Abbreviations: ATP, adenosine triphosphate; FFA, flufenamic acid.
Conclusion
In summary, the ECIS system acts as an efficient tool for the analysis of cellular behavior and in particular of cellular oscillations with real-time, continuous, and long-term monitoring ability. The present paper elucidates several possible mechanisms by which L929 fibroblast cells oscillate during their culture period using the ECIS system. Those probable causes are discussed such that the periodic extension/contraction of lamellipodia of L929 cells might be produced by traction/retraction forces initiated by signals from the actomyosin complex. In addition, these actomyosin signals are possibly interconnected with connexin hemichannel opening and ATP release. Though the hypothesis was developed by correlating the preliminary calcium-imaging and ATP quantification results obtained in the present research with previous reports, complete elucidation is required to unravel unknown mechanisms. Overall, the present research found unique dynamics for L929 fibroblast cells. Spontaneous, long-lasting L929 cellular oscillation phenomena can be a simple model for various dynamic assessments of cancer cells, cardiomyocytes, and/or neuronal cell behavior based on the ECIS system.
Acknowledgements
This work was supported by the WCU Program (R33-2010-000-10067-0) of the Korean Ministry of Education and Science Technology and by the Industrial Strategic Technology Development Program(10035197) funded by the Ministry of Knowledge Economy (MKE, Korea).
Disclosure
The authors report no conflicts of interest in this work.
Supplementary figures
Figure S1 Photograph of eight-well one-electrode (8W1E) ECIS chip.
Note: Right image is the magnification of single well showing the circular detection electrode at the center and common counter electrode.
Abbreviation: ECIS, electric cell-substrate impedance-sensing system.
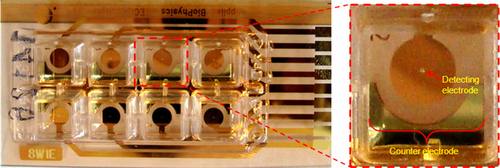
Figure S2 The whole experiment was repeated thrice and here are the results obtained for two experiments with L929, vero cell, and cell-free medium on a ECIS system.
Note: These results show the consistency of L929 cellular oscillation.
Abbreviation: ECIS, electric cell-substrate impedance-sensing system.
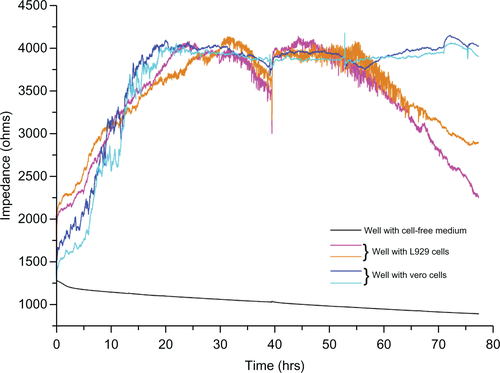
Figure S3 FFT analysis with log frequency of L929 cellular oscillation obtained from ECIS system between 30 to 40 hours.
Abbreviations: ECIS, electric cell-substrate impedance-sensing system; FFT, fast Fourier transform.
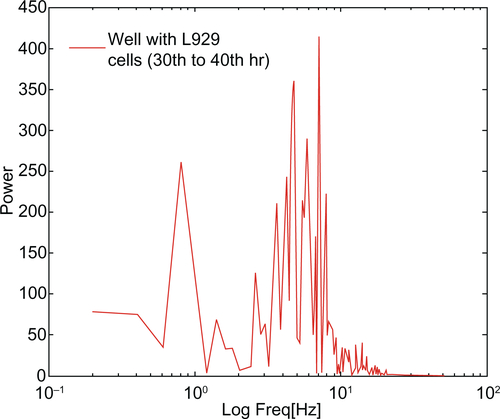
Figure S4 FFT analysis with log frequency of L929 cellular oscillation obtained from ECIS system between 55 to 70 hours.
Abbreviations: ECIS, electric cell-substrate impedance-sensing system; FFT, fast Fourier transform.
References
- DanøSSørensenPGHynneFQuantitative characterization of cell synchronization in yeastNature199940232032210580506
- GregorTFujimotoKMasakiNSawaiSThe onset of collective behavior in social amoebaeScience20103281021102520413456
- BenningerRKPZhangMHeadWSSatinLSPistonDWGap junction coupling and calcium waves in the pancreatic isletBiophys J2008955048506118805925
- TangFDentEWKalilKSpontaneous calcium transients in developing cortical neurons regulate axon outgrowthJ Neurosci20032392793612574421
- NakayamaYKawaharaKHachiroTYamauchiYYoneyamaMPossible involvement of ATP-purinoceptor signalling in the intercellular synchronization of intracellular Ca2+ oscillation in cultured cardiac myocytesBio Systems200790179187
- EvansJHSandersonMJIntracellular calcium oscillations induced by ATP in airway epithelial cellsAm J Phys1999277L30L41
- BeyerECPaulDLGoodenoughDAConnexin family of gap junction proteinsJ Membrane Biol19901161871942167375
- PittsJDJunctional communication and cellular growth controlFeldmanJGilulaNBPittsJDIntercellular Junctions and SynapsesLondon, UKChapman and Hall19786379
- PaluchEPielMProstJBornensMSykesCCortical actomyosin breakage triggers shape oscillations in cells and cell fragmentsBiophys J20058972473315879479
- Geva-ZatorskyNRosenfeldNItzkovitzSOscillations and variability in the p53 systemMol Syst Biol20062113
- De BlasioBFRøttingenJASandKLGiaeverIIversenJGGlobal, synchronous oscillations in cytosolic calcium and adherence in bradykinin-stimulated Madin-Darby canine kidney cellsActa Physiol Scand200418033534615030375
- ZhangYMcBrideDWJrHamillOPIon selectivity of a membrane conductance activated by removal of extracellular calcium in Xenopus oocytesJ Physiol (Lond)19985087637769518731
- PletjushkinaOJRajfurZPomorskiPOliverTNVasilievJMJacobsonKAInduction of cortical oscillations in spreading cells by depolymerization of microtubulesCell Motil Cytoskeleton20014823524411276073
- KanemaruKOkuboYHiroseKIinoMRegulation of neurite growth by spontaneous Ca2+ oscillations in astrocytesJ Neurosci2007278957896617699677
- GiaeverIKeeseCRMicromotion of mammalian cells measured electricallyProc Natl Acad Sci U S A199188789679001881923
- GiannoneGDubin-ThalerBJDo’bereinerHKiefferNBresnickARSheetzMPPeriodic lamellipodial contractions correlate with rearward actin wavesCell200411643144315016377
- ShahapureRDifatoFLaioAForce generation in lamellipodia is a probabilistic process with fast growth and retraction eventsBiophys J20109897998820303855
- CiofaniGRicottiLDantiSInvestigation of interactions between poly-l-lysine-coated boron nitride nanotubes and C2C12 cells: up-take, cytocompatibility, and differentiationInt J Nanomedicine2010528529820463944
- El OakleyRYacoubMHSuzukiKOverexpression of connexin 43 in skeletal myoblasts: Relevance to cell transplantation to the heartJ Thorac Cardiovasc Surg2001122475976611581610
- MusilLSCunninghamBAEdelmanGMGoodenoughDADifferential phosphorylation of the gap junction protein connexin 43 in junctional communication-competent and -deficient cell linesJ Cell Biol1990111207720882172261
- CotrinaMLLinJHAlves-RodriguesAConnexins regulate calcium signaling by controlling ATP releaseProc Natl Acad Sci U S A19989515735157409861039