Abstract
Quantum dots (QDs) are fluorescent semiconductor nanocrystals that have the potential for major advancements in the field of nanomedicine through their unique photophysical properties. They can potentially be used as fluorescent probes for various biomedical imaging applications, including cancer localization, detection of micrometastasis, image guided surgery, and targeted drug delivery. Their main limitation is toxicity, which requires a biologically compatible surface coating to shield the toxic core from the surrounding environment. However, this leads to an increase in QD size that may lead to problems of excretion and systemic sequestration. We describe a one pot synthesis, characterization, and in vitro cytotoxicity of a novel polyhedral oligomeric silsesquioxane (POSS)-coated CdTe-cored QD using mercaptosuccinic acid (MSA) and D-cysteine as stabilizing agents. Characterization was performed using transmission electron microscopy Fourier transform infrared spectroscopy, and photoluminescence studies. POSS-coated QDs demonstrated high colloidal stability and enhanced photostability on high degrees of ultraviolet (UV) excitation compared to QDs coated with MSA and D-cysteine alone (P value < 0.05). In vitro toxicity studies showed that both POSS and MSA-QDs were significantly less toxic than ionized salts of Cd+2 and Te−2. Confocal microscopy confirmed high brightness of POSS-QDs in cells at both 1 and 24 hours, indicating that these QDs are rapidly taken up by cells and remain photostable in a biological environment. We therefore conclude that a POSS coating confers biological compatibility, photostability, and colloidal stability while retaining the small size and unique photophysical properties of the QDs. The amphiphilic nature of the coating allows solubility in aqueous solutions and rapid transfer across cell membranes, enabling the use of lower concentrations of the QDs for an overall reduced toxicity particularly for prolonged live cell and in vivo imaging applications.
Video abstract
Point your SmartPhone at the code above. If you have a QR code reader the video abstract will appear. Or use:
Introduction
Nanomaterials have dimensional analogies similar to physiological molecules such as proteins and nucleic acidsCitation1 and therefore have been exploited in various biomedical applications, such as tissue engineering, biosensing, medical diagnostics, and therapeutics. At nanoscale sizes, the properties of bulk matter change considerably, giving nanomaterials superior mechanical, thermal, electrical, magnetic, and optical properties that can be exploited extensively in the field of biomedicine. Of the many nanomaterials, particles < 100 nm in diameter are defined as nanoparticles and are of considerable interest to the biomedical scientist. Nanoparticles may be conjugated to biological molecules and incorporated into drug carrier systems, mechanical scaffolds for tissue engineering, and use as contrast agents for in vivo real time imaging applications.Citation2–Citation6
Quantum dots (QDs) are fluorescent nanoparticles of semiconductor material with unique photophysical properties that give them significant advantages over organic dyes and proteins commonly used in biomedical imaging.Citation7 QDs can be size tuned to emit at variable wavelengths ranging all the way from the ultraviolet UV to the near infrared (NIR). Having a broad absorption and narrow emission spectrum, they can be used for multiplexed imaging as differently colored QDs can be excited by the same wavelength of lightCitation1,Citation8,Citation9 provided this wavelength is less than their absorption onset. The QD surface carries free reactive groups that allow biofuctionalization for their targeted delivery. These properties, along with their higher sensitivity, quantum yields, photostability, chemical stability, molar extinction coefficients, and slow decay rates make them ideal probes for real time, long term, and multimodal biomedical imaging.
The most commonly synthesized QDs are based on cadmium salts (eg, cadmium telluride and cadmium selenide), which are coated by a material of a higher band gap, eg, zinc sulphide or cadmium sulphide.Citation10,Citation11 Furthermore, most QDs are organically synthesized and are insoluble in aqueous media, which makes them inapplicable to biological scenarios. Although QDs can now be aqueously synthesized, their toxicity limits their biomedical application. QD toxicity is multifactorial and is determined by their physiochemical properties, including composition of the core, size, surface charge, concentration, surface chemistry, bioactivity, oxidative, photolytic and mechanical stability, as well as their environmental interactions.Citation12 The main mechanism of toxicity is the release of free divalent cadmium ions into the surrounding environment through the effects of core oxidation due to the surface coating, which is inadequate or unstable to shield the core from the surrounding oxidative environment. However, the surface coating increases QD size and leads to sequestration in organs of the reticuloendothelial system, including the liver and spleen as they are too large for renal excretion.Citation13 The liver is the main target of cadmium toxicity, and since larger QDs accumulate in the liver, this effect is likely to be accentuated.
Over the last decade, QD toxicity and surface coatings to render them biologically compatible have been intensively researched. Various materials have been used to protect the QD core from the effects of an oxidative biological environment,Citation9,Citation14,Citation15 but there are problems of toxicity of the surface coating itself, which is prone to instability and biodegradation. Moreover, surface coating may lead to an overall increase in QD size, which relies on the method of coating, including ligand exchange or ligand capping. Ligand exchange leads to smaller particles that can be applied to biosensing applications but entail a certain amount of loss of QD fluorescence. Alternatively, ligand capping coats the QDs with its surrounding surface groups, which leads to a larger hydrodynamic diameter but also the retention of its unique photophysical properties.Citation15 QDs coated by this technique can be applied to various diagnostic applications determined by their eventual size.
We demonstrate the application of polyhedral oligomeric silsesquioxane (POSS) as a novel surface coating for QDs. POSS is a cyclical silsesquioxane with a stoichiometric formula (SiO1.5)Citation8 and is the smallest of the silica nanoparticles with a size of 1.5 nmCitation16 (). We have previously integrated POSS as a nanocomposite into a synthetic polymer polycarbonate urea urethane and used it for biomedical tissue engineering applications, such as vascular grafts, heart valves, nerve graftsCitation15,Citation17–Citation26 and more recently as a nasolacrimal duct and a tracheal graft, which have successfully been implanted into patients. POSS imparts properties of antithrombogenicity, biocompatibility, non-immunogenicity, and increased surface area to promote endothelialization. We have also used the emulsion form of this novel nanocomposite polymer to coat QDs.Citation27 POSS-PCU emulsion-coated QDs were biocompatible and more photostable than mercaptoundecanoic acid (MUA)-coated QDs but have a hydrodynamic diameter of ~33 nm. In this paper, we describe the application of a novel POSS coating to mercaptosuccinic acid (MSA) and D-Cysteine stabilized CdTe core QDs synthesized by modification of a simple one pot aqueous synthesis as previously described.Citation6,Citation28 MSA achieves dispersibility and pH stability while D-cysteine acts as an anti-oxidant and adds both NH2 and –COOH groups for biofunctionalization. POSS imparts properties of colloidal stability, photostability, and amphiphillicity, allowing high intracellular uptake and lower concentrations of the QDs to be used for overall enhanced biocompatibility.
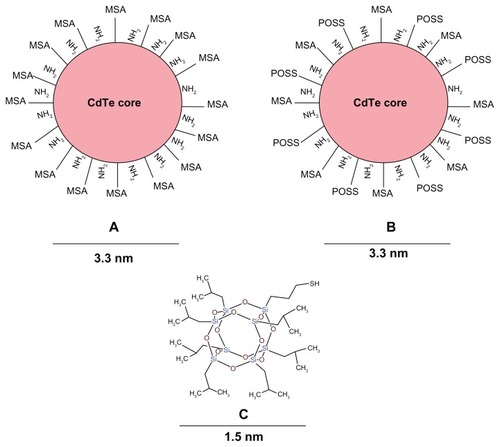
Figure 1 Structure of QDs and M-POSS.
Notes: (A) MSA-QDs; (B) POSS-QDs; (C) M-POSS. MSA-QDs have ample surface COOH groups to allow solubility and stability. POSS-QDs have both hydrophobic and hydrophilic surface groups, giving them amphiphilic properties. Structure of M-POSS (C) shows a caged structure with predominant Si-O-Si and surface Si-C bonds. R groups promote solubility in organic solvents and thiol (-SH) group binds to QD core metal surface.
Abbreviations: QD, quantum dots; M-POSS, mercaptopropylisobutyl-polyhedral oligomeric silsesquioxane; MSA-QDs, mercaptosuccinic acid quantum dots; POSS-QDs, polyhedral oligomeric silsesquioxane quantum dots.
Materials and methods
Materials
Sodium borohydride (NaBH4, 98%), sodium tellurite (Na2TeO3 99.8%), cadmium chloride (CdCl2), MSA, D-cysteine (99.5%) and mercaptopropylisobutyl-POSS (M-POSS) were purchased from Sigma-Aldrich Chemicals (St Louis, MO). All chemicals were used as obtained without further purification. Dulbecco’s modified eagle’s medium (DMEM + 4.5 g/l glucose), fetal bovine serum (FBS) and penicillin/ streptomycin, Trypsin/EDTA, and phosphate-buffered saline (PBS) were purchased from GIBCO/Invitrogen (UK). CellTitre-Blue® viability assay was purchased from Promega (Madison, WI, USA).
Synthesis and coating of CdTe QDs
Briefly, borate-citrate acid-buffer solution was prepared using 15 mM sodium borate (Na2B4O7) and 15 mM citric acid and then pH adjusted with 1 M HCL or 1 M NaOH. The precursor solution was prepared using cadmium chloride (CdCl2, 1 mM) and sodium tellurite (Na2TeO3, 0.25 mM), to which 0.1 mM of thiolated D-cysteine and 1 mM MSA was added. The materials were mixed in a single-necked flask immersed in ice and containing 50 mL of the buffer solution. After 5 minutes of vigorous stirring, 20 mg of sodium borohydride (NaBH4) powder was added, and the reaction was allowed to proceed for another 5 minutes before attaching the flask to a condenser and refluxing at 100°C under open-air conditions for approximately 6 hours. The emission color of the QDs could be controlled by altering reflux time. The QDs were purified from the suspension by centrifugation with an equal volume of ethanol for 20 mins. The QDs obtained were MSA/D-cysteine-coated and referred to as MSA-QDs.
Synthesis of POSS-coated CdTe QDs
Mercaptopropylisobutyl-POSS was first dissolved in tetrahydrofuran (THF) and then added to the precursor solution at a concentration of 0.1 mM along with 0.1 mM of D-cysteine and 1 mM solution of MSA. The solution was refluxed for the same period of time as the MSA-QDs. The QDs were purified with centrifugation with an equal volume of THF. The POSS/MSA/D-cysteine-coated QDs obtained were referred to as POSS-QDs. The final QD concentrations were calculated from the dry weight, and the QDs were suspended in PBS.
Characterization studies
Photoluminescence spectra were obtained using a fluorescence emission spectroscope USB 2000+ (Ocean Optics, Dunedin, FL) using a quartz cuvette with a 1 cm path length and an aqueous solvent (deionized water or PBS) as a reference. QD samples were illuminated with a LED beam at 375 nm. Photostability of POSS and MSA QDs was assessed by exposing equal concentrations of QDs to continuous UV excitation at 375 nm for 2 hours, and emission intensity was recorded at sequential intervals. The emission intensities were normalized before comparison. The shape and size of the different QDs cores were assessed using transmission electron microscopy. A drop of QD samples was mounted on to a Piloform (TAAB)-coated G300HS copper electron microscopy grid (Gilder) and allowed to air dry. The grids were examined with a CM120 (Philips) transmission electron microscope at 3.0 × 10⁵ magnification. Fourier transform infrared spectra were obtained on a Jasco FT/IR 4200 spectrometer equipped with a diamond attenuated total reflectance accessory (Diamond MIRacle ATR, Pike Technologies, US). Spectra were produced from an average of 20 scans at 4 cm−1 resolution over a range of 600 cm−1 to 4000 cm−1 wavenumbers. For POSS and MSA-QDs, aqueous samples were run against a background generated from PBS solution. Dry MSA powder and M-POSS were run again against a background of air.
Cell culture
Hep G2 cells were supplied at passage number 50 from the Liver Group at the Centre for Hepatology, Department of Medicine, Royal Free Hospital and Medical School, University College London. Once received, the media was changed to Dulbecco’s modified eagle’s medium (DMEM + 4.5 g/l glucose) and supplemented with fetal bovine serum (FBS, 10%) and penicillin/streptomycin (1%), which was then replaced a few times during a period of 1 week to 10 days. Part of the supply was cryopreserved for future use, and the rest was maintained ready for use as needed. The cells were seeded into flasks and cultured at 37°C and 5% CO2 under aseptic conditions. Cells were grown to 90% confluence before being used for routine passaging and in vitro toxicity experiments.
Cell viability studies
Serial dilutions (0, 1.5, 5, 10, and 15 μg/mL) of CdCl2, Na2TeO3, and different QDs were prepared using PBS and media, whereby the volume of DMEM was kept constant. HepG2 cells were seeded into 96-well plates at a density of 2 × 10⁴ cells per well, and allowed to settle for 24 hours at 37°C in an incubator with 5% CO2. After this period, the media was removed. The cells were thoroughly washed with PBS and then exposed to serial dilutions of the CdCl2, Na2TeO3 and three different types of QDs, and then incubated at 37°C in 5% CO2 for 1 and 24 hours. After this period, the cells were thoroughly washed with PBS, and the QD dilutions were replaced with DMEM. Twenty μl of the CellTitre-Blue® dye was then added to each well and incubated for further 4 hours at 37°C in 5% CO2. All tests were conducted in triplicate. Cells not exposed to any QD dilution (0 μg/100 μl) served as a negative control and those exposed to ionized Cd+2 and Te−2 served as positive controls for toxicity.
Confocal microscopy to assess cell morphology and QD stability
For confocal microscopy, cells were plated in flat-bottomed glass 96-well plates and exposed to QD dilutions as above. They were washed with PBS, fixed with gluteraldehyde, and examined using an EC-1 confocal microscope from Nikon. Each respective image was optimized by averaging 10 scans per image.
Statistical analysis
Statistical analysis was performed using Prism software and one-way ANOVA with the Dunnett and Bonferroni multiple comparison test and paired t test.
Results
Synthesis
The CdTe core QDs were synthesized by a previously described one pot aqueous method based on the reaction between CdCl2 and Na2TeO3 in a borate-citrate buffer.Citation6,Citation27 Bao et al were the first to describe a one pot aqueous synthesis of L-cysteine capped CdTe nanocrystals using sodium tellurite as a Tellurium source.Citation28 The same group adapted this technique to demonstrate the synthesis of highly luminescent MSA capped CdTe QDs.Citation6 We made minor modifications to this protocol with respect to the coating materials to yield two different types of QDs coated with MSA and D-cysteine (referred to as MSA-QDs) and mercaptopropylisobutyl- POSS (M-POSS), MSA and D-cysteine (referred to as POSS-QDs) ().
The synthesis of MSA-QDs involved preparing a precursor solution by mixing cadmium chloride, sodium tellurite, MSA, and D-cysteine in a borate citrate buffer. When sodium borohydride was added, the color of the growth solution instantly turned a light green. On heating the mixture at 100°C for 1 hour, the color darkened to a deep green and eventually to brown at the end of 6 hours. By altering the reflux time, QD emission of the desired wavelength could be achieved with bluish fluorescence (450 nm) at the end of 1 h, yellow (550 nm) at 4 h and red (635 nm) at 6 h. Reflux times of greater than 6 h led to the solution becoming unstable with evidence of aggregation and loss of fluorescence. It is likely that prolonged heating may lead to breakdown of the thiol groups to form a CdS shell initially followed by oxidation of the cysteine residues to cystine with formation of a disulphide bond. MSA QDs were purified after centrifugation with equal amounts of isopropanol and resuspended readily in PBS. However, the MSA-QDs lacked colloidal stability as they fell out of solution under prolonged standing in refrigeration within a few days.
For the synthesis of POSS-QDs, Mercaptopropylisobutyl- POSS (M-POSS) was dissolved in tetrahydrofuran to make a 0.1 mM solution. This was added to the precursor solution, including cadmium chloride, sodium tellurite, MSA, and D-cysteine in 50 mL of buffer solution in a single-necked flask immersed in ice and subjected to vigorous stirring in a homogenizer. The initial temperature of the flask was kept low to prevent initiation of the reaction prior to addition of all the materials. As an organic solvent was added to the aqueous solution, vigorous stirring was required to form a homogenous mixture. After addition of the reducing agent, sodium borohydride, the reaction proceeded as previously. At the end of 6 hours, a brown colored solution was obtained with some precipitates of free POSS present in the base of the flask. POSS-QDs emitting at 630 nm were purified with centrifugation with an equal amount of tetrahydrofuran to remove any unreacted M-POSS. They readily suspended in PBS and remained colloidally stable on prolonged standing at 4°C in refrigeration for months. Successful coating of the QDs was later confirmed by Fourier transform infrared spectroscopy (FTIR) analysis.
Characterization studies
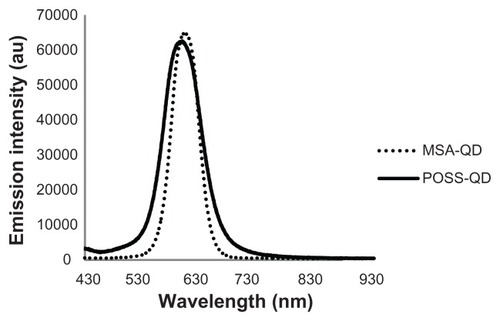
The core diameter, shape, and degree of dispersion of the QDs were assessed using transmission electron microscopy (). Both QDs were spherical in shape and had a mean core diameter of 3.3 nm. MSA-QDs appeared to be marginally better dispersed than POSS-QDs. Photoluminescence studies showed that MSA-QDs emitted at 635 nm, whereas POSS- QDs showed a marginal blue shift in emission at 630 nm ().
Figure 2 Transmission electron microscopy.
Notes: (A) POSS-QDs; (B) MSA-QDs. The core sizes of CdTe in (A) and (B) are 3.3 nm. Both QDs (A and B) were well dispersed, although some darker areas in A may reflect free POSS. Scale bars represent 20 nm. Magnification × 300,000.
Abbreviations: POSS-QDs, polyhedral oligomeric silsesquioxane quantum dots; MSA-QDs, mercaptosuccinic acid quantum dots; QDs, quantum dots; POSS, polyhedral oligomeric silsesquioxane.
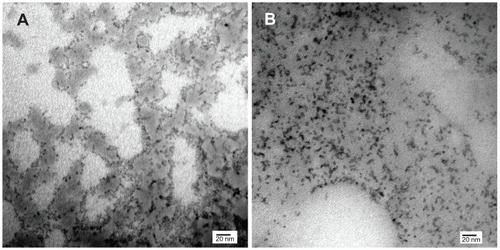
Figure 3 Fluorescence emission spectra of POSS and MSA-QDs.
Notes: POSS-QDs emit at 630 nm and MSA-QDs at 635 nm. There is no significant difference in the peak emission wavelength of both QDs, although POSS-QDs have a slightly broader FWHM compared to MSA-QDs.
Abbreviations: POSS, polyhedral oligomeric silsesquioxane; MSA-QDs, mercaptosuccinic acid quantum dots; POSS-QDs, polyhedral oligomeric silsesquioxane quantum dots; QDs, quantum dots.
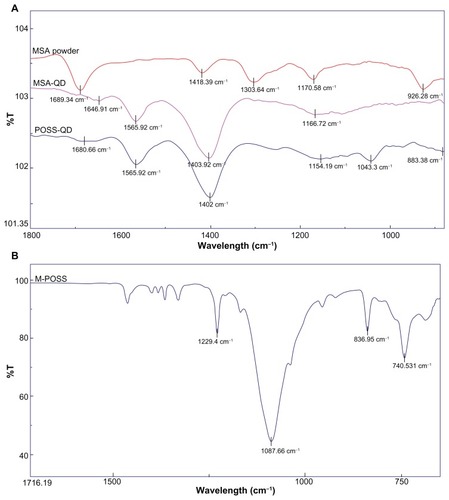
The FTIR spectra of dry MSA powder, MSA-QDs, POSS-QDs, and M POSS are shown in . Both MSA and POSS-QDs show prominent peaks at 1565 cm−1 and 1402 cm−1, which correspond to strong asymmetric and symmetric stretching vibrations of amino acid cysteine, respectively. The peak as 1402 cm−1 (MSA-QDs) and 1403 cm−1 (POSS-QDs) is strongest at it also receives some contribution from weak deformation of O-H groups from the MSA (1418 cm−1). MSA-QDs show a slight shift in the peak at 1646 cm−1 from 1689 cm−1 in the MSA powder caused by carbonyl stretching vibrations, indicating that MSA has bonded to the QD surface. POSS-QDs show a new peak at 1043 cm−1 from variable strong stretching vibrations of the Si-O-Si bonds in the POSS nanocages. The FTIR spectrum of M-POSS indicates a strong peak at 1080 cm−1 from the Si-O-Si bonding of the POSS nanocages. The shift in this peak from 1080 cm−1 in M-POSS to 1043 cm−1 in POSS-QDs indicates that the POSS has bonded to the QD surface. Both POSS and MSA QDs have cysteine residues and MSA groups, which relate to the similarity of their FTIR spectra, except for the POSS peak that occurs at 1043 cm−1 and a slightly more prominent broad peak at 1154 cm−1 in POSS-QDs caused by skeletal vibrations of alkyl C-C groups from the isobutyl alkyl groups on the POSS nanocages.
Figure 4 FTIR spectra of dry MSA powder, MSA-QDs, POSS-QDs and M-POSS.
Notes: (A) POSS and MSA-QDs show common peaks at 1402 cm−1 and 1565 cm−1 from strong symmetric and asymmetric vibrations of the amino acid cysteine. However, POSS-QDs show a new peak at 1043 cm−1 that corresponds to stretching vibrations from Si-O-Si bonds in POSS; (B) M-POSS demonstrates a prominent peak at 1087 cm−1 from Si-O-Si bonds that shifts to a 1043 cm−1 on the POSS-QDs indicating that POSS has bonded to the QD surface.
Abbreviations: FTIR, Fourier transform infrared spectroscopy; MSA, mercaptosuccinic acid; MSA-QDs, mercaptosuccinic acid quantum dots; POSS-QDs, polyhedral oligomeric silsesquioxane quantum dots; M-POSS, Mercaptopropylisobutyl-polyhedral oligomeric silsesquioxane; POSS, polyhedral oligomeric silsesquioxane; QDs, quantum dots.
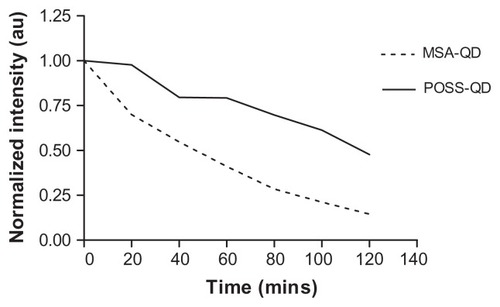
POSS-QDs were more resistant to photo-oxidation on exposure to high degrees of UV illumination compared to MSA-QDs (P-value < 0.05) (). Although both types of QDs photo-degraded over the period of exposure, the rate of decline of the emission intensity of POSS-QDs was considerably less than MSA-QDs. POSS-QDs remained photostable for the initial 20 minutes of UV exposure and lost 25% of their emission intensity over a period of 1 hour. In comparison, MSA-QDs lost >25% of their emission intensity in the first 20 minutes and >50% after the first hour of exposure.
Figure 5 Photostabilty of POSS and MSA-QDs.
Notes: On exposure to UV illumination for 2 hours, POSS-QDs undergo photo-oxidation at a much slower rate showing significantly enhanced photostability compared to MSA-QDs. P value < 0.05.
Abbreviations: POSS, polyhedral oligomeric silsesquioxane; MSA-QDs, mercaptosuccinic acid quantum dots; POSS-QDs, polyhedral oligomeric silsesquioxane quantum dots.
Cell viability studies
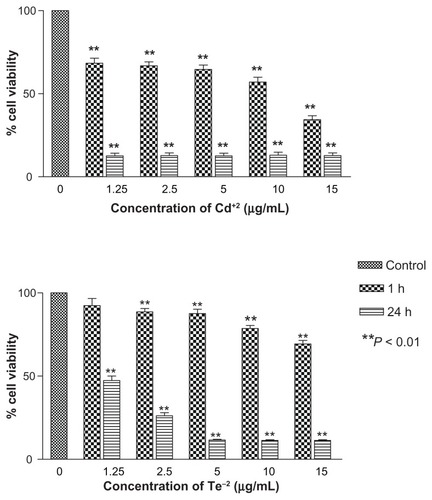
In vitro toxicity of individual heavy metals of CdCl2 and Na2TeO3 was carried out to establish the toxicity of free divalent Cd+2 and Te−2 ions, which was compared with toxicity of the two different types of QDs. Both tellurium and cadmium individually demonstrated significant time and concentration dependent cytotoxicity (). Cadmium toxicity was more pronounced even at low concentration of 1.25 μg/mL at 1 hour (P-value < 0.01). At 24 h exposure, all concentrations of cadmium showed less than 10% cell viability versus tellurium, which showed a similar effect at 5 μg/mL.
Figure 6 In vitro toxicity of ionized Cd+2 and Te−2 to Hep G2 cells.
Notes: Both metals have profound toxicities, with cadmium being toxic at all concentrations at 1 and 24 hours compared with tellurium, which is toxic at all concentrations except 1.25 μg/mL at 1 hour. **P < 0.01.
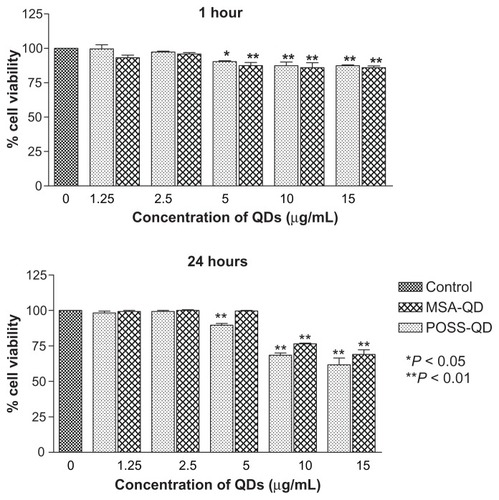
Hep G2 cells exposed to MSA and POSS-QDs showed no significant evidence of toxicity at concentrations of 2.5 μg/mL at both 1 h and 24 h of exposure (). At the end of 1 h, the first signs of toxicity appeared at 5 μg/mL even though both POSS and MSA-QDs maintained greater than 85% cell viability at all concentrations up to 15 μg/mL. There was no significant difference in toxicity between the two QDs at 1 h of exposure. At 24 h, POSS- QDs showed significantly reduced cell viability at 5 μg/mL compared to MSA-QDs (P-value < 0.01) even though they maintained a cell viability of ~90%. The slightly greater cell viability of both POSS and MSA QDs at 24 h compared to 1 h, at 5 μg/mL indicates that both QDs do not affect the multiplication potential of cells at this concentration. At higher concentrations of ≥10 μg/mL both POSS and MSA QDs were toxic at 24 h (P-value < 0.01). Although there was no significant difference in cell viability between the two QDs at higher concentrations, MSA-QDs showed marginally higher cell viability (~70%) compared to POSS-QDs (~65%) at the highest concentration of 15 μg/mL ().
Figure 7 In vitro toxicity of POSS and MSA-QDs to Hep G2 cells.
Notes: Different concentrations of QDs were compared to the control group. Both POSS and MSA-QDs are biocompatible at 2.5 μg/mL at 1 and 24 hours. POSS-QDs show lower cell viability at 5 μg/mL at 24 hours compared to MSA-QDs, although there is no significant difference in cell viability between the 2 QDs at higher concentrations of 10 and 15 μg/mL. *P < 0.05; **P < 0.01.
Abbreviations: POSS, polyhedral oligomeric silsesquioxane; MSA-QDs, mercaptosuccinic acid quantum dots; QDs, quantum dots; POSS-QDs, polyhedral oligomeric silsesquioxane quantum dots.
Cellular morphology
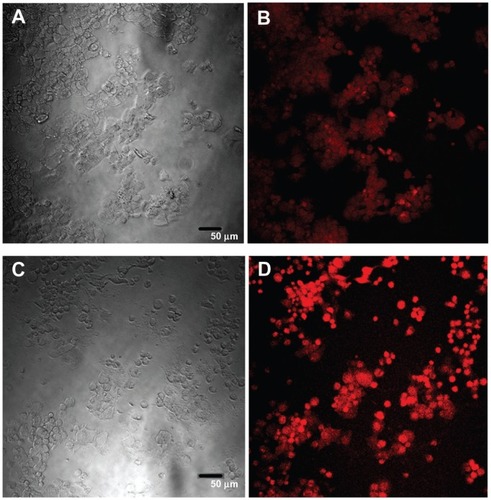
Confocal images of HepG2 cells exposed to the highest QD concentration (15 μg/mL) were taken to demonstrate changes in cell morphology and uptake of QDs after 1 and 24 hours of exposure ( and , respectively). At 1 hour post incubation, there was no visible difference in morphology between cells exposed to POSS and MSA-QDs. However, at 24 hours post incubation, cells exposed to Cd+2 displayed marked evidence of cell death with loss of cellular architecture and evidence of cellular break down. POSS and MSA QDs exhibited distinctly higher cell numbers and intracellular fluorescence. The fluorescence of POSS-QDs was more predominant at both 1 and 24 hours.
Figure 8 Confocal images of HepG2 cells incubated with QDs for 1 hour. (A) Differential interference contrast (DIC) image of cells incubated with MSA-QDs; (B) Fluorescent image of A; (C) DIC image of cells incubated with POSS-QDs; (D) Fluorescence image of C; POSS-QDs (D) appear more brightly fluorescent than MSA-QDs (B) at 1 hour.
Notes: The images are pseudo-colored. The scale bar is set to 50 μm.
Abbreviations: QD, quantum dots; MSA-QDs, mercaptosuccinic acid quantum dots; POSS-QDs, polyhedral oligomeric silsesquioxane quantum dots.
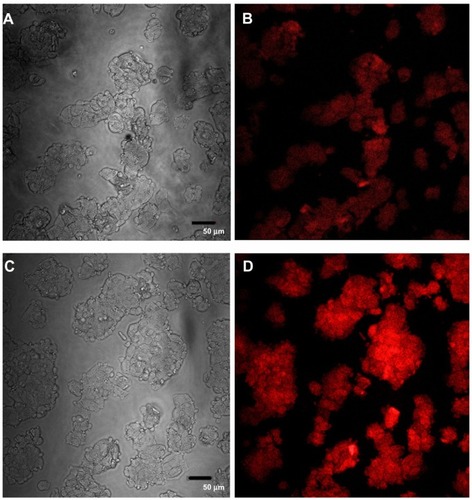
Figure 9 Confocal images of HepG2 cells incubated with QDs for 24 hours.
Notes: (A) differential interference contrast (DIC) Image of cells exposed to MSA-QDs; (B) Fluorescent image of A; (C) DIC image of cells exposed to POSS-QDs (D) Fluorescence image of C. Both POSS and MSA-QDs maintain high cellular numbers and intracellular fluorescence indicating uptake of QDs. POSS-QDs (D) appear brighter than MSA-QDs (C).
Abbreviations: QD, quantum dots; MSA-QDs, mercaptosuccinic acid quantum dots; POSS-QDs, polyhedral oligomeric silsesquioxane quantum dots; POSS, polyhedral oligomeric silsesquioxane.
Discussion
The synthesis of highly luminescent MSA and L-cysteine capped CdTe QDs has previously been described.Citation6,Citation28 We modified the same technique to apply a POSS coating and replaced the conventionally used L-cysteine with its enantiomer D-cysteine. L-cysteine is a small amino acid present in the human body and susceptible to degradation by physiological proteases. As D-cysteine is resistant to such degradation,Citation29 we hypothesized that it would provide superior protection to the QD core in a biological environment while retaining the advantages of the L-cysteine molecule. D-cysteine has both NH2 and COOH groups, which solubilize the QDs and provide free reactive groups for the attachment of biomolecules. We did not investigate the effects of pH, molar ratios, and reaction temperature on QD synthesis. Our aim was to apply a novel POSS coating to MSA and D-cysteine stabilized CdTe core QDs and establish its effect on their eventual biocompatibility and QD photophysical properties.
Both POSS and MSA-QDS were monodispersed with a core diameter of 3.3 nm on a transmission electron microscopy (TEM) although MSA-QDs showed marginally better dispersibility than POSS-QDs (). TEM does not assess the hydrodynamic diameter of QDs as the soft organic coating is not electron dense and therefore invisible. The MSA-QDs are compact as both MSA and cysteine residues are fairly small. Previous DLS studies to evaluate the hydrodynamic diameter of L-cysteine capped CdTe/ZnTe QDs suggested that cysteine adds 0.3–0.5 nm to the original QD size,Citation30 keeping the overall size of the QDs fairly small. POSS is a small molecule with a diameter of only 1.5 nm including R groups. We speculate that because it replaces some of the MSA groups on the QDs surface, it does not significantly alter the overall hydrodynamic (HD) diameter compared to MSA QDs. The MSA coating provides 2 carbonyl groups that enhance miscibility and dispersibility as evident on TEM. However, after prolonged standing, the MSA-QDs appear to fall out of solution as compared to the POSS-QDs that maintain dispersibility and colloidal stability for prolonged periods of time.
POSS-QDs have all three residues on their surface, including D-cysteine, MSA, and M-POSS. The ratio of D-cysteine and POSS is very low compared to MSA (1:1:10, respectively), which serves as the main stabilizing agent. The POSS cage is ~1.5 nm in diameter,Citation16 and on its own is extremely hydrophobic. In the presence of MSA and D-Cysteine, it imparts amphiphilic properties to the QD. POSS is a robust molecule that has been incorporated into various polymers to protect the underlying surface from the effects of oxygen plasma.Citation16 It is likely that the POSS coating confers prolonged colloidal stability through reducing QD aggregation and maximally shielding the core from the oxidative effects of air and light.
Photoluminescence studies showed that MSA-QDs emitted at 635 nm while POSS-QDs showed a marginal blue shift in emission at 630 nm (). A possible explanation of this effect may be the initial loss of few atoms from the QD surface during the process of ligand exchange as M-POSS replaces some MSA groups on the QD surface. This phenomenon is a well-established sequele of ligand exchange reaction, which is one of the mechanisms of coating QDs for aqueous solubility.Citation15 Most commercially available QDs have a core/shell structure with a surface coating for solubility. Although both POSS and MSA-QDs emit at red wavelengths, they are core QDs without a shell and with small molecule thiol surface coating, which keeps the overall size of the QDs smaller than core/shell or core/shell/shell structures. The small size is a beneficial feature, particularly for various biosensing applications that track the movement of individual molecules within cells. Moreover, smaller particles are less likely to be taken up and accumulate in the reticuloendothelial system and more likely to be excreted by the kidneys.Citation13 Studies have proven the direct association between long-term retention of large cadmium-based QDs in the liver and its associated toxicity.Citation31
The photostability of both POSS and MSA-QDs was assessed using prolonged UV excitation using a high powered lamp. POSS-QDs have significantly higher photostability after two hours of UV exposure (). Although the degree of UV excitation used in this experiment was very high and unlikely to be replicated in a biological environment, it gave an indication of the photochemical stability of the different coatings in extreme oxidative environments. The relative protective effect of POSS in retarding UV induced photooxidation may be related to the inherent structure of the POSS molecule. The Si-O bonds in the POSS structure are most resistant to breakdown compared to the Si-C bonds. In extreme exposures to oxidative environments, all the bonds may break down except the Si-O bond, which may form SiO2 and protect the underlying QD from the effects of UV. This phenomenon has been demonstrated when POSS has been integrated as a nanocomposite in polymers for surface coatingsCitation32 and exposed to oxygen plasma. The SiO2 layer may prevent the loss of excitons, leading to enhanced photostability of POSS-QDs.
Previous studies have demonstrated that a QD concentration of only 10 μg/mL was toxic to HepG2 cells.Citation33–Citation35 The cytotoxicity of cadmium based core QDs lacking a ZnS shell has also been well established.Citation36 Because our QDs lacked a ZnS coat, we used 15 μg/mL as the highest concentration to evaluate cytotoxicity. It can be assumed that a surface coating that nullifies or reduces QD core toxicity would yield much greater biocompatibility with core/shell QDs. Core QDs may also be a more sensitive tool to assess QD toxicity because the slightest instability or breakdown of the surface coating would lead to an immediate oxidation of the core, manifesting as enhanced toxicity or photochemical instability.
The marginally lower cell viability on exposure to POSS- QDs compared to MSA QDs () can be explained by the possibility that POSS-QDs are rapidly taken up by the cells as evidenced by the brighter photoluminescence of cells on confocal microscopy at both 1 and 24 hr ( and ). The ideal method of confirming a high intracellular uptake would be a TEM that would allow counting the number of particles within the cells or determining the intracellular cadmium content through inductively coupled plasma mass spectroscopy of cell lysates. Quantification of fluorescence may not be ideal in this situation as the POSS-QDs are significantly more photostable than MSA-QDs, and the brighter fluorescence may just be an indicator of photostability. However, we speculate that POSS-QDs have a surface coating with both hydrophobic and hydrophilic moieties, giving them amphiphilic properties, which may allow rapid intracellular uptake across the lipophilic cell membranes leading to slightly higher toxicity compared to MSA-QDs at concentrations ≥ 5 μg/mL at 24 h. In a recent report, Su et alCitation37 demonstrated that the cytotoxicity of QDs cannot be solely attributed to the release of free Cd2+ ions but is actually determined by the number of QDs ingested by the cell. Our results correlate with those of previous studies showing concentration and time dependent toxicity of QDs.Citation12,Citation14,Citation35
At one hour post-incubation, both POSS and MSA QDs were taken up by the cells and localized to the cytoplasm. The main mechanism of intracellular delivery of QDs is endocytic uptake, which is likely to be the mechanism by which both QDs were taken up. However, this method is very non-specific and leads to aggregation of QDs in vesicles and a non-uniform cytoplasmic distribution. QD sequestration into vesicles may also be a barrier to various clinical applications, eg, QD-bioconjugates as drug-delivery systems, since intracellular delivery requires the QD-drug complex to be freely available for interactions. Trapped QDs, however, cannot reach the intended target and thus render the system futile. Other methods of QD uptake by cells include techniques such as microporation and microinjection of QDsCitation38,Citation39 into individual cells, which appears to be the only means of homogeneous intracellular QD delivery to date. However, the major drawback of this technique is the single cell approach, which makes it a laborious process and thus precludes large-scale applications.
A major finding of our study was that the degree of QD fluorescence in cells was considerably higher for the POSS-QDs compared to the MSA-QDs, particularly at 1 h post incubation. It is possible that the mechanism of QD uptake for POSS-QDs differs from MSA QDs such that the former are rapidly taken up by pathways other than nonspecific endocytosis, leading to increased QD concentration within the cells and higher intracellular fluorescence. It has been previously demonstrated that QD uptake by cells can be enhanced by conjugating the QDs to cationic lipids or peptidesCitation39–Citation42 or amphiphilic proteins.Citation43 Cationic lipid-capped QD delivery into tumor cells was successfully demonstrated by Voura et alCitation40 as was peptide-mediated delivery of QDs into Chinese hamster ovarian cells.Citation42 Cationic POSS conjugated to BODIPY was seen to be taken up by cells with a uniform cytoplasmic distribution.Citation44 Although the M-POSS used to coat our QDs is not the cationic form, it is likely that the amphiphillicity that it imparts to the QD structure has a role in its increased intracellular uptake across the lipophilic cell membranes. At 24 hours post incubation, a significant rise in fluorescence of both POSS and MSA QDs could be detected due to increased intracellular uptake over time. However, POSS-QDs fluoresced more brightly compared to MSA-QDs owing to their relatively higher photostability on exposure to oxidative environments.
Our study demonstrates the application of a novel POSS nanoparticle as coating for QDs for biological application. We used CdTe cored QDs without a ZnS shell. It has been established that a QD coating of a higher band gap material removes surface defects and retains excitons, thus leading to prolonged photostability, higher quantum yield, and enhanced biocompatibility.Citation45–Citation48 However, QD toxicity is not eliminated as ZnS-coated QDs do show concentration dependent increase in toxicity.Citation38 Aqueous solubility still requires further coating of the ZnS shell with materials such as MSA, PEG, dihydrolipoic acid, silica, dendrimers, amphiphilic polymers, phospholipids micelles, etc. for biological application.Citation9,Citation15,Citation49,Citation50 This significantly increases the size of the coated QDs (15–100 nm), leading to problems of excretion and QD sequestration into the organs of the RES, apart from significant limitation to their biological applications. We used POSS, MSA and D-Cysteine to coat QDs in an attempt to achieve solubility with the MSA ligand, and biocompatibility and stability through the POSS coating while retaining the small QD size. Although the toxicity of POSS and MSA-QDs is comparable, POSS QDs show marginally lower cell viability compared to MSA-QDs at 5 μg/mL. This is unlikely to be caused by the surface coating itself as the biocompatibility of POSS has been well established. Furthermore, the enhanced photostability of the POSS-QDs compared to MSA-QDs indicates that the POSS coating adequately shields the core from the effects of photochemical oxidation. Therefore, the most likely explanation for this effect is the higher cellular uptake of POSS- QDs, which leads to reduced cell viability. This particular property, in addition to enhanced photostability, may allow lower concentrations of POSS-QDs to be used for various biological applications, such as long term in vitro and in vivo imaging applications like single particle tracking and stem cell tracking as well as various biosensing applications that rely on a small QD size.
Conclusion
We have demonstrated that the novel POSS coating confers photostability, colloidal stability, and biocompatibility on MSA and D-cysteine stabilized CdTe core QDs. Although the biocompatibility of POSS-QDs is comparable to MSA-QDs, the POSS coating imparts amphiphillicity to the QD surface, allowing rapid intracellular uptake and brighter fluorescence, which eventually leads to lower concentrations of QDs required for use. POSS-QDs retain surface reactive groups for bioconjugation, which along with their small size, confers numerous advantages for use in various biomedical applications. The POSS molecule is known to confer anti-thrombogenic properties when incorporated in polymer nanocomposites for vascular grafts.Citation26 Few studies have examined the hemocompatibility of QDs, which is essential prior to any consideration for in vivo and clinical application. It is likely that the POSS coating may impart similar properties to QDs, but further testing is required to establish this effect. Future experiments to investigate in vivo biodistribution and toxicity of POSS-coated QDs are now in progress to move them one step closer to clinical application.
Acknowledgments
We would like to acknowledge the financial support of The Sebba Trust, UK for the development of QDs for detection of breast cancer and an MRC research grant on POSS-PCU.
Disclosure
The authors report no conflicts of interest in this work.
References
- GaoXChanWCNieSQuantum-dot nanocrystals for ultrasensitive biological labeling and multicolor optical encodingJ Biomed Opt2002753253712421118
- CurtisAWilkinsonCNantotechniques and approaches in biotechnologyTrends Biotechnol2001199710111179802
- GrefRMinamitakeYPeracchiaMTTrubetskoyVTorchilinVLangerRBiodegradable long-circulating polymeric nanospheresScience1994263160016038128245
- WeisslederRA clearer vision for in vivo imagingNat Biotechnol20011931631711283581
- FrangioniJVIn vivo near-infrared fluorescence imagingCurr Opin Chem Biol2003762663414580568
- YingELiDGuoSDongSWangJSynthesis and bio-imaging application of highly luminescent mercaptosuccinic acid-coated CdTe nanocrystalsPLoS One20083e222218493618
- BruchezMMoronneMGinPWeissSAlivisatosAPSemiconductor nanocrystals as fluorescent biological labelsScience1998281201320169748157
- AlivisatosAPSemiconductor clusters, nanocrystals, and quantum dotsScience1996271933937
- SmithAMDuanHRhynerMNRuanGNieSA systematic examination of surface coatings on the optical and chemical properties of semiconductor quantum dotsPhys Chem Chem Phys200683895390319817050
- AndersonREChanWCWSystematic investigation of preparing biocompatible, single, and small ZnS-capped CdSe quantum dots with amphiphilic polymersACS Nano200821341135219206301
- TsayJMPflughoefftMBentolilaLAWeissSHybrid approach to the synthesis of highly Luminescent CdTe/ZnS and CdHgTe/ZnS nanocrystalsJ Am Chem Soc20041261926192714971912
- HardmanRA toxicologic review of quantum dots: toxicity depends on physicochemical and environmental factorsEnviron Health Perspect200611416517216451849
- ChoiHSIpeBIMisraPLeeJHBawendiMGFrangioniJVTissue- and organ-selective biodistribution of NIR fluorescent quantum dotsNano Lett200992354235919422261
- ShioharaAHoshinoAHanakiKSuzukiKYamamotoKOn the cytotoxicity caused by quantum dotsMicrobiol Immunol20044866967515383704
- HezingerAFETessmarJGopferichAPolymer coating of quantum dots: a powerful tool toward diagnostics and sensoricsBiopharmaceutics200868138152
- LiGZWangLCNiHLPittmanCUPolyhedral oligomeric silsesquioxane (POSS) polymers and copolymers: A reviewJ Inorg Organomet Polym200111123154
- GhanbariHKidaneAGBurriesciGRameshBDarbyshireASeifalianAMThe anti-calcification potential of a silsesquioxane nanocomposite polymer under in vitro conditions: potential material for synthetic leaflet heart valveActa Biomater201064249426020601232
- KannanRYSalesKMSalacinskiHJButlerPESeifalianAMEndothelialisation of poly (carbonate-siloxane-urea) urethaneMed J Malaysia200459Suppl B10710815468841
- KannanRYSalesKMSalacinskiHJButlerPESeifalianAMCytotoxicity analysis of poly (carbonate-siloxane-urea) urethaneMed J Malaysia200459Suppl B9910015468837
- KannanRYSalacinskiHJButlerPEHamiltonGSeifalianAMCurrent status of prosthetic bypass grafts: a reviewJ Biomed Mater Res B Appl Biomater20057457058115889440
- KannanRYSalacinskiHJButlerPESeifalianAMPolyhedral oligomeric silsesquioxane nanocomposites: the next generation material for biomedical applicationsAcc Chem Res20053887988416285710
- KannanRYSalacinskiHJSalesKButlerPSeifalianAMThe roles of tissue engineering and vascularization in the development of microvascular networks: a reviewBiomaterials2005261857187515576160
- KannanRYSalacinskiHJSalesKMButlerPESeifalianAMThe endothelialization of polyhedral oligomeric silsesquioxane nanocomposites: an in vitro studyCell Biochem Biophys20064512913616757813
- KannanRYSalacinskiHJOdlyhaMButlerPESeifalianAMThe degradative resistance of polyhedral oligomeric silsesquioxane nanocore integrated polyurethanes: an in vitro studyBiomaterials2006271971197916253324
- KannanRYSalacinskiHJGhanaviJESilsesquioxane nanocomposites as tissue implantsPlast Reconstr Surg20071191653166217440337
- KannanRYSalacinskiHJDe GrootJThe antithrombogenic potential of a polyhedral oligomeric silsesquioxane (POSS) nanocompositeBiomacromolecules2006721522316398518
- GhanbariHde MelASeifalianAMCardiovascular application of polyhedral oligomeric silsesquioxane nanomaterials: a glimpse into prospective horizonsInt J Nanomedicine2011677578621589645
- BaoHWangEDongSOne-pot synthesis of CdTe nanocrystals and shape control of luminescent CdTe-cystine nanocompositesSmall2006247648017193069
- HongSYOhJELeeKHEffect of d-amino acid substitution on the stability, the secondary structure, and the activity of membrane-active peptideBiochem Pharmacol1999581775178010571252
- LawWCYongKTRoyIAqueous-phase synthesis of highly luminescent CdTe/ZnTe core/shell quantum dots optimized for targeted bioimagingSmall200951302131019242947
- RikansLEYamanoTMechanisms of cadmium-mediated acute hepatotoxicityJ Biochem Mol Toxicol20001411011710630425
- WuJMatherPTPOSS polymers: physical properties and biomaterials applicationsPolym Rev2009492563
- DerfusAMChenAAMinDHRuoslahtiEBhatiaSNTargeted quantum dot conjugates for siRNA deliveryBioconjug Chem2007181391139617630789
- LovricJChoSJWinnikFMMaysingerDUnmodified cadmium telluride quantum dots induce reactive oxygen species formation leading to multiple organelle damage and cell deathChem Biol2005121227123416298302
- LovricJBazziHSCuieYFortinGRWinnikFMMaysingerDDifferences in subcellular distribution and toxicity of green and red emitting CdTe quantum dotsJ Mol Med20058337738515688234
- SuYHeYLuHThe cytotoxicity of cadmium based, aqueous phase-synthesized, quantum dots and its modulation by surface coatingBiomaterials200930192518848354
- SuYHuMFanCThe cytotoxicity of CdTe quantum dots and the relative contributions from released cadmium ions and nanoparticle propertiesBiomaterials2010314829483420346495
- DubertretBSkouridesPNorrisDJNoireauxVBrivanlouAHLibchaberAIn vivo imaging of quantum dots encapsulated in phospholipid micellesScience20022981759176212459582
- DerfusAMChanWCBhatiaSIntracellular delivery of quantum dots for live cell labeling and organelle trackingAdv Mater200416961966
- GaoXCuiYLevensonRMChungLWNieSIn vivo cancer targeting and imaging with semiconductor quantum dotsNat Biotechnol20042296997615258594
- VouraEBJaiswalJKMattoussiHSimonSMTracking metastatic tumor cell extravasation with quantum dot nanocrystals and fluorescence emission-scanning microscopyNat Med20041099399815334072
- MattheakisLCDiasJMChoiYJOptical coding of mammalian cells using semiconductor quantum dotsAnal Biochem200432720020815051536
- ChanWCNieSQuantum dot bioconjugates for ultrasensitive nonisotopic detectionScience1998281201620189748158
- McCuskerCCarrollJBRotelloVMCationic polyhedral oligomeric silsesquioxane (POSS) units as carriers for drug delivery processesChem Commun (Camb)200599699815719094
- ChoSJMaysingerDJainMRoderBHackbarthSWinnikFMLong-term exposure to CdTe quantum dots causes functional impairments in live cellsLangmuir2007231974198017279683
- MaJChenJYZhangYPhotochemical instability of thiol-capped CdTe quantum dots in aqueous solution and living cells: process and mechanismJ Phys Chem B2007111120121201617887665
- ZhangYChenWZhangJLiuJChenGPopeCIn vitro and in vivo toxicity of CdTe nanoparticlesJ Nanosci Nanotechnol2007749750317450785
- WangHQZhangHLLiXQWangJHHuangZLZhaoYDSolubilization and bioconjugation of QDs and their application in cell imagingJ Biomed Mater Res A20088683384118041709
- XieRKolbULiJBascheTMewsASynthesis and characterization of highly luminescent CdSe-core CdS/Zn0.5Cd0.5S/ZnS multishell nanocrystalsJ Am Chem Soc20051277480748815898798
- ZhangHSunPLiuCL-Cysteine capped CdTeGÇôCdS coreGÇôshell quantum dots: preparation, characterization and immuno-labeling of HeLa cellsLuminescence201126869220017130