Abstract
Background
For a safe ‘in vivo’ biomedical utilization of nanoparticles, it is essential to assess not only biocompatibility, but also the potential to trigger unwanted side effects at both cellular and tissue levels. Mastocytes (cells having secretory granules containing cytokines, vasoactive amine, and proteases) play a pivotal role in the immune and inflammatory responses against exogenous toxins. Mastocytes are also recruited in the tumor stroma and are involved in tumor vascularization and growth.
Aim and methods
In this work, mastocyte-like rat basophilic leukemia (RBL) cells were used to investigate whether carboxyl-modified 30 nm polystyrene (PS) nanoparticles (NPs) and naked mesoporous silica (MPS) 10 nm NPs are able to label the secretory inflammatory granules, and possibly induce exocytosis of these granules. Uptake, cellular retention and localization of fluorescent NPs were analyzed by cytofluorometry and microscope imaging.
Results
Our findings were that: (1) secretory granules of mastocytes are accessible by NPs via endocytosis; (2) PS and MPS silica NPs label two distinct subpopulations of inflammatory granules in RBL mastocytes; and (3) PS NPs induce calcium-dependent exocytosis of inflammatory granules.
Conclusion
These findings highlight the value of NPs for live imaging of inflammatory processes, and also have important implications for the clinical use of PS-based NPs, due to their potential to trigger the unwanted activation of mastocytes.
Introduction
Nanoparticle labeling is a rapidly emerging area in the field of nanotheranostic sciences, ie, the application of nanotechnology to the areas of medical therapy and diagnosis by creating powerful tools enabling the targeted delivery of drug therapies and imaging tracers.Citation1–Citation4 The in vivo biomedical application of such NPs however, raises several issues regarding their tolerability, intracellular effects, systemic reactions and overall toxicity. The extent of NP toxicity essentially depends on such variables as size, type of material, and surface charge, and is proportional to the dose and time of exposure, as well as the actual concentration of NPs within critical cellular compartments.Citation5–Citation7 At the cellular level, the NPs’ toxicity may result from the generation of free radicals, or the disruption of organelle integrity (eg, by inducing leakage of proapoptotic molecules from lysosomes or mitochondria), or by affecting the plasma membrane permeability (eg, by inducing calcium ion entry).Citation8–Citation11
At the tissue and organ levels, toxicity may arise following NP-induced stimulation of the immune and inflammatory cells.Citation12–Citation14 This tissue immune-inflammatory reaction is orchestrated by resident mastocytes, through the release of vasoactive amines, cytokines, and proteolytic enzymes.Citation15,Citation16 These substances are packaged within lysosome-like granules that translocate to the periphery of the mastocyte, and fuse with the plasma membrane upon stimulation of IgE receptors or other stimuli effectively inducing an influx of calcium ions.Citation17
Mastocytes are involved not only in allergic and inflammatory diseases, but also play a pivotal role in tumor vascularization and growth.Citation18–Citation20 NPs with the ability to label and trace the exocytosis of inflammatory secretory granules would therefore be useful to monitor mastocyte activation during an inflammatory response. In addition, given the desired utilization of NPs in the detection of cancer and its therapy, it is also prudent to explore the possibility of being able to detect and monitor the unwanted activation of mastocytes infiltrating the tumor stroma. In this work each of these issues was addressed.
As a ‘sensitive’ cell model we utilized mastocyte-like rat basophilic leukemic (RBL) cells, a widely used ‘in vitro’ cell model to study the inflammatory response to allergic stimuli.Citation21 RBL cells possess two types of inflammatory granules that share the same biogenetic pathway with lysosomes.Citation22,Citation23 Upon stimulation, a rapid influx of calcium ions enables the fusion of these organelles with the plasma membrane, and the release in the extracellular environment of lysosomal proteases, vasoactive substances and inflammatory cytokines.Citation23,Citation24 The RBL cell model has already been successfully used in studies of endocytosis and cellular labeling with NPs.Citation25–Citation27 RBL cells represent a valuable cellular model system to address the two questions posed in the present study: (1) do NPs trigger an inflammatory response, ie, the calcium-dependent secretion of mastocyte granules? And (2) can NPs be used to label, and possibly discriminate between different internal secretory, lysosome-like compartments of mastocytes?
To monitor the active exocytosis of inflammatory granules in RBL cells, two types of fluorescent NPs were employed that differ in chemical composition, surface charge, and size: (1) mesoporous silica (MPS) material, of 10 ± 5 nm in diameter, with no surface-charged functional group, and doped with IRIS-3 dye, emitting red fluorescence; and (2) polystyrene (PS) material, of 30 ± 10 nm in diameter, carboxyl-modified with a negative surface charge, and embedded with the FITC dye, emitting green fluorescence. Mesoporous, silica-based NPs are emerging as valuable nanocarriers of therapeutic and diagnostic tracers due to their unique pore architecture, which enables them to host macromolecules such as complex dyes and pharmaceuticals, with the added bonus that silica is considered to be nontoxic and biodegradable.Citation28–Citation31 The physical and chemical characteristics of the MPS NPs used in the present study have been previously described.Citation27 PS NPs are also being evaluated for drug delivery and cellular imaging.Citation32–Citation34 The potential of MPS NPs to induce the release of inflammatory cytokines by macrophages has been recently investigated.Citation30 Similarly, in a recent study, amorphous silica NPs were shown to induce the release of inflammatory cytokines by endothelial cells.Citation35
Whether and how MPS and PS NPs interact with and activate mastocytes is not known. We addressed these issues in cultured RBL mastocytes. The main findings here reported are: (1) MPS and PS NPs showed different efficiency of intracellular retention: while the former were well tolerated for long time, the latter were promptly expelled in a calcium-dependent fashion; and (2) MPS and PS NPs engaged in different endocytic routes and finally accumulated in different secretory compartments. These data present significant clinical applications, since they demonstrate a powerful ability of NPs to monitor the inflammatory process via imaging the degranulation of mastocytes. In addition, these data also have important clinical implications as they demonstrate the possibility of inducing the activation of an inflammatory reaction by NPs.
Materials and methods
Nanoparticles
Commercial carboxyl-functionalized, fluorescein isothiocyanate (FITC)-conjugated PS NPs were purchased from Sigma (cod L5155; Sigma-Aldrich, St Louis, MO). Mesoporous silica (MPS) NPs engrafted with IRIS-3 were provided by Cyanine Technologies (IRIS3-Dots-Porous cod 3 WEL-06; Cyanine Technologies SpA, Turin, Italy). NPs were dissolved in culture medium after conglomerate disruption by sonication.Citation27
Cell culture and treatments
Mastocyte-like RBL-2H3 cells (American Type Culture Collection, Manassas, VA) were cultivated at 37°C in 5% CO2 in Dulbecco’s modified Eagle’s minimum essential medium (cod D5671; Sigma-Aldrich) supplemented with 16% fetal bovine serum (FBS) (cod DE14-801F; Lonza Group Ltd, Basel, Switzerland) and 100 IU/mL penicillin–streptomycin (cod P0781; Sigma-Aldrich). Typically, the cells were plated on sterile cover-slips and left to adhere for 24 hours before use. Incubations were performed in fresh medium for the time indicated. NPs were dissolved directly in culture medium at the desired final concentration. The calcium ionophore A23187 and the calcium-chelating ligand EGTA (both from Sigma Aldrich) were used at the concentration of 1 μM and 5 mM, respectively. Methyl-β-cyclodextrin (MbCD) (cod C4805; Sigma-Aldrich) was used at 5 mM final concentration. Unless otherwise specified, all experiments were performed in the presence of FBS, a medium that closely resembles the physiological tissue environment.
Cellular viability assessment
Cell toxicity was evaluated by looking at the gross morphology alterations of the nuclei typically associated with cell death (picnosis, chromatin condensation and fragmentation), and at the metabolic activity of the cell. To this end, nuclei were stained with DAPI and cells were labeled with CellTracker™ (Invitrogen, Carlsbad, CA). The latter is a fluorescent dye that emits blue fluorescence of an intensity proportional to that of mitochondrial respiratory activity.Citation46 Adherent cells prelabeled with DAPI (not shown) or CellTracker™ were each incubated with NPs for up to 48 hours. It was assumed that, given the rapid internalization of NPs, any toxic effect on cell metabolism would be evident by this time. As a control for metabolic toxicity, the cells were incubated with 1% dimethylsulfoxide (DMSO). Cell viability was measured as the percentage of cells labeled with CellTracker™ irrespective of intensity, as determined with ImageJ software (US National Institutes of Health, Bethesda, MD).
Cathepsin D fluorescent chimeras and plasmid transfection
The cDNA coding for human lysosomal cathepsin D,Citation47 devoid of the stop codon, was subcloned in the multiple cloning site of the plasmids peGFP-N1 or pmCherry-N1 (both from Clontech Lab, Takara Bio Inc, Shiga Japan) in order to drive the synthesis of the fluorescent chimeras CD-GFP or CD-mCherry. Adherent RBL cells were transfected with the plasmid using the Lipofectamine 2000 Reagent™ (Life Technologies Ltd, Paisley, UK) method as suggested by the manufacturer’s instructions.
Briefly, cells were plated in a P35 petri dish at 15,000/cm2 and left to adhere for 24 hours prior to the transfection procedure. The DNA-Lipofectamine complexes were prepared in 500 μL of Opti-MEM I reduced serum medium (Life Technologies Ltd) with 5 μg of plasmid and 10 μL of lipofectamine. After 6 hours of incubation, the transfection medium was removed and replaced with serum-containing culture medium (16% FBS-DMEM) and the cells cultivated for 36 hours to allow for maximal protein expression. The cells were then incubated in fresh medium with either the LysoTracker™ (Invitrogen–Molecular Probes, Eugene, OR) or the NP for the time indicated.
Endocytosis and exocytosis studies
RBL cells were plated on sterile cover-slips and left to adhere for 24 hours, then the medium was replaced, and cells were incubated with the NPs for the time indicated. To trace the endocytic pathway, the cells were prelabeled for 10 minutes with LysoTracker™ Green or Red. Where indicated, 5 mM of MbCD was added for 1 hour prior to the incubation with NPs in order to extract cholesterol from the plasma membrane. Exocytosis of inflammatory granules was induced by stimulation of calcium entry by A23187 (1 μM for 5 or 60 minutes), and inhibition of exocytosis was attained by supplementing the medium with 5 mM EGTA.
Fluorescence microscope imaging
Samples were observed with the fluorescence microscope Leica DMI6000 (Leica Microsystems AG, Wetzlar, Germany).
Five to ten fields (for a minimum total of 50 cells) were randomly imaged by two independent investigators (ME and AG), and representative images were chosen for display. Images were captured under the fluorescence microscope using the same color intensity threshold for all treatments. All images were compiled using Adobe® Photoshop® (Adobe Systems Inc, San Jose, CA), with the same contrast adjustment applied to all images. Quantification of fluorescent microscope images was performed using ImageJ software. This method enabled measurement of the mean quantity of NPs which had accumulated in the cell as the mean fluorescence intensity per cell.
Flow cytometry
Flow cytometry was employed to assess the proportion of cells that had internalized the NPs. The cells were plated on petri dishes and left to adhere for 24 hours, then the NPs were added to fresh medium. At the end of the incubation period, the cells were washed three times with PBS to remove the excess NPs, and extracellular fluorescence was quenched with 0.4% (w/v) trypan blue in PBS. Cells were then harvested with trypsin, resuspended in PBS and the extent of NP internalization was then assessed using a FACScan flow cytometer (Becton, Dickinson and Company, Franklin Lakes, NJ). Cell-associated fluorescence (10,000 cells/sample) was analyzed with WinMDI software (version 2.9; Microsoft Corporation, Redmond, WA).
Statistics
Each experiment was performed in triplicate and reproduced two or more times. Quantification data from ImageJ and cytofluorometry analyses were given as average ± standard deviation. The Student’s t-test with P < 0.05 for statistical significance was employed to compare the results from different treatments.
Results and discussion
Biocompatibility and dose/time-dependent uptake of MPS and PS NPs
The uptake efficiency and intracellular end-point of NPs together with their effects on cellular metabolism, are greatly influenced by their physical-chemical characteristics.
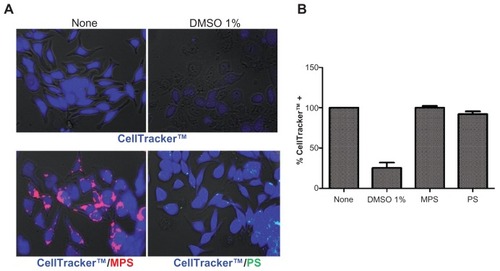
Since NP toxicity is also cell-type specific, it was first necessary to establish that MPS and PS NPs do not exert any toxicity upon RBL cells. Biocompatibility was tested in RBL cultures exposed for up to 48 hours to either type of NP at the maximal concentration used in the present study (ie, 30 μg/mL and 75 μg/mL, respectively). Cell viability was assayed using a metabolic thiol-reactive probe (CellTracker™) that produces a stable membrane-impermeable glutathione–fluorescent dye adduct in living cells. The images in demonstrate that both MPS and PS NPs were nontoxic to RBL cells, which is consistent with previous reports showing the biotolerability of MPS and of carboxylated PS NPs in other cell types.Citation9,Citation27–Citation29,Citation33,Citation36,Citation37 From the fluorescent signal, it was established that MPS NPs accumulated in large quantities in RBL cells, indicating their efficient uptake and intracellular retention throughout the incubation period. On the other hand, only a few RBL cells appeared to contain PS NPs, and then only in very small amounts (). The latter finding could be explained by assuming that: (1) PS NPs hardly entered RBL cells (at the given concentration and time of incubation); or (2) PS-associated fluorescence was rapidly and fully quenched within cellular compartments; or (3) PS NPs were expelled after their internalization.
Figure 1 Biotolerability of NPs. RBL cells (15,000/cm2) adherent on cover-slips were incubated with 30 μg of MPS or 75 μg of PS NPs in fresh medium for 48 hours, then the cells were washed and labeled with CellTracker™ (5 μM for 45 min in serum-free medium). After this, the cells were washed and incubated in regular complete medium for 30 minutes. Positive control of toxicity was performed incubating the cells with 1% DMSO. Cells were then washed and imaged under the fluorescence microscope. The proportion of viable (CellTracker™-stained) cells was determined with the aid of ImageJ software. Representative images (A) and quantification (B) of two independent experiments performed in triplicate are shown. Note that almost the whole cell population incubated with either MPS or PS NPs shows intense blue fluorescence, whereas in DMSO-treated culture, most of the monolayer has detached and, of the portion still adherent, approximately 25% of the cells appear faintly labeled with CellTracker™.
Abbreviations: DMSO, dimethyl sulfoxide; MPS, mesoporous silica; NPs, nanoparticles; RBL, rat basophilic leukemia; PS, polystyrene.
Although the PS material can be considered to be chemically relatively inert, the presence of carboxyl functional groups on the surface confers a negative surface charge to the NP, which allows (reversible) electrostatic interactions with biological molecules that may impact on the uptake efficiency.Citation33,Citation38,Citation39 A typical time- and concentration-dependent internalization experiment showed that the accumulation of PS NPs in RBL cells clearly increased with concentration, while increasing the time of incubation did not lead to a substantial increase of the number of labeled cells, or of NP per cell ().
Figure 2 Dose- and time-dependent cellular accumulation of NPs. RBL cells (30,000/cm2) adherent on cover-slips were exposed to different concentrations of NPs for two different incubation times (5 and 30 minutes). After this, the cells were washed, imaged under the fluorescence microscope and cell-associated fluorescence was quantified with ImageJ software. (A) Representative images of RBL cells exposed to PS NPs (concentration and time as indicated). (B) Quantification of total fluorescence (normalized per cell); data from two independent experiments in triplicate are shown. (C) Representative images of cells exposed to MPS NPs.
Abbreviations: MPS, mesoporous silica; NPs, nanoparticles; RBL, rat basophilic leukemia; PS, polystyrene.
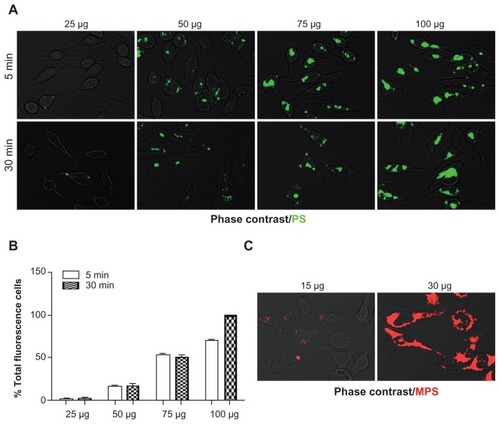
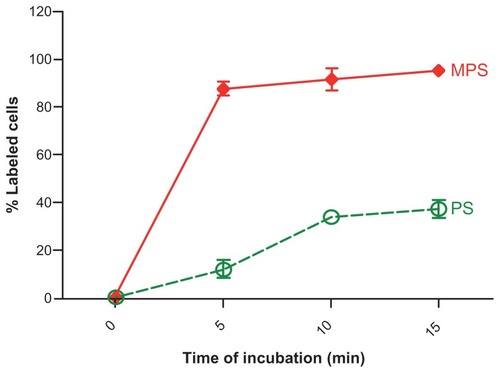
On the other hand, MPS NPs were very rapidly taken up by RBL cells, and saturated intracellular compartments in a dose-dependent fashion (). The kinetics of the uptake of MPS and PS NPs were directly compared. Flow cytometry was used to determine the proportion of cells that had internalized the NPs at a given time. Prior to flow cytometry analysis, at the end of each time-point incubation, the samples were extensively washed and quenched with trypan blue to remove all non-internalized NPs material from the cell surface. An aliquot of washed cells was observed under the microscope to ascertain the absence of fluorescent NPs passively adsorbed on the cell surface. Flow cytometry data were expressed as a percentage of fluorescently-labeled cells. Both types of NPs were taken up by the cells, although at different rates. MPS NPs rapidly entered the cells and after 15 minutes, 100% of the cell population was intensely labeled, while by this time only 35% of the cell population had been labeled by PS NPs ().
Figure 3 Kinetics of MPS and PS NPs internalization. RBL cells (80,000/well) adherent on 12-well petri dishes were incubated in fresh medium with 10 μg of MPS or 75 μg of PS NPs for the time indicated. At each time point, the cells were washed, harvested and cell-associated fluorescence quantified by flow cytometry.
Note: Data from two independent experiments each performed in triplicate are shown.
Abbreviations: MPS, mesoporous silica; NPs, nanoparticles; RBL, rat basophilic leukemia; PS, polystyrene.
Carboxylated PS NPs trigger their calcium-dependent expulsion
Internalization of NPs is influenced by ionic interactions between the negative membrane potential of the cell, and the surface net charge of NPs.Citation38 In addition, negatively-charged 20 nm PS NPs were shown to stimulate the calcium-dependent secretion of chloride and bicarbonate anions in airway epithelial cells.Citation40
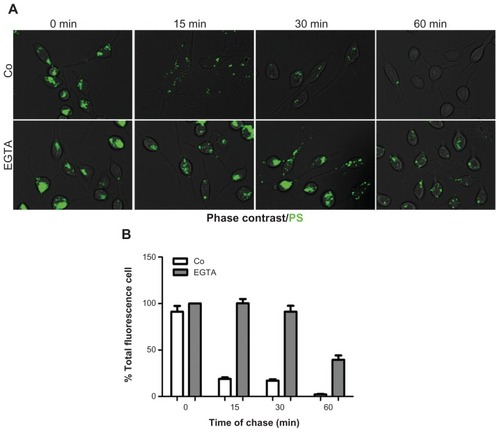
A possibility existed that the PS–plasma membrane interaction could affect the calcium-dependent recycling of endocytic vesicles, thus leading to a dynamic endocytosis– exocytosis process that could account for the low intracellular retention of carboxylated PS NPs. RBL cells were allowed to internalize PS NPs, then the cells were washed and incubated for increasing time of chase. In parallel cultures, the extracellular calcium chelator EGTA was present throughout the uptake and chase incubation. The extent of cell labeling was assessed by fluorescence microscopy and cytofluorometry. Data shown in demonstrate that EGTA contrasted the time-dependent loss of intracellular labeling, suggesting a role for calcium influx in the rapid expulsion of PS NPs.
Figure 4 PS NPs induce calcium-regulated exocytosis of PS-containing vesicles. RBL cells (30,000/cm2) adherent on cover-slips were exposed to 75 μg of PS NPs for 15 minutes. Where indicated, the cells were preincubated for 30 minutes with 5 mM EGTA. After this, the cells were washed, imaged under the fluorescence microscope and cell-associated fluorescence was quantified with ImageJ software. (A) Representative images of RBL cells exposed to PS NPs in the presence or absence of EGTA. (B) Quantification of total fluorescence (normalized per cell).
Note: Data from two independent experiments in triplicate are shown.
Abbreviations: EGTA, ethyleneglycoltetraacetic acid; NPs, nanoparticles; RBL, rat basophilic leukemia; PS, polystyrene.
MPS and PS NPs label calcium-regulated secretory compartments in RBL cells
In most cell types studied thus far, endocytosed material is first delivered to early endosomes, and is then further transported downstream to endocytic compartments toward late endosomes and lysosomes.Citation41 RBL mastocytes have been shown to possess two distinct subpopulations of secretory lysosome-like compartments.Citation22,Citation23 It is not yet known whether these compartments interconnect the endocytic pathway, and if so, how. To address this, calcium-dependent degranulation of RBL cells previously loaded with NPs was induced. Degranulation was instigated by imposing the influx of extracellular calcium with the calcium ionophore A23817, and parallel coincubation with the extracellular calcium-chelating ligand EGTA serving as the control.Citation23
RBL cells were preloaded for 15 minutes with PS NPs, then washed and incubated for 5 or 60 minutes, with or without A23187 or EGTA, or both. The images in show that PS NPs are still visible in RBL cells at 5 minutes, but are no longer visible at 60 minutes (which confirms the data in ), and demonstrate that NPs are rapidly exocytosed upon induction of calcium influx. Note that in the majority of the cells cotreated with A23187 and EGTA, the NPs are retained within the cells, and have accumulated at the periphery of the cells. An analogous experiment was performed in cells preloaded with MPS NPs. In this case, A23187 also triggered the rapid calcium-dependent expulsion of the NPs, (only the 5 minute chase incubation is shown) ().
Figure 5 MPS and PS NPs gain access to calcium-regulated secretory compartments. RBL cells (30,000/cm2) adherent on cover-slips were pulse-labeled for 15 minutes with 10 μg of MPS or 75 μg of PS NPs, then cells were washed and incubated for the indicated time in the absence or presence of 1 μM A23187 or 5 mM EGTA, or both. After this, cells were imaged and cell-associated fluorescence quantified with ImageJ software. (A) Representative images of RBL cells incubated with PS NPs and treated as indicated. (B) Representative images of RBL cells incubated with MPS NPs and treated as indicated. (C) Quantification of total fluorescence (normalized per cell).
Note: Data from three independent experiments in triplicate (*P < 0.001) are shown.
Abbreviations: EGTA, ethyleneglycoltetraacetic acid; MPS, mesoporous silica; NPs, nanoparticles; RBL, rat basophilic leukemia; PS, polystyrene.
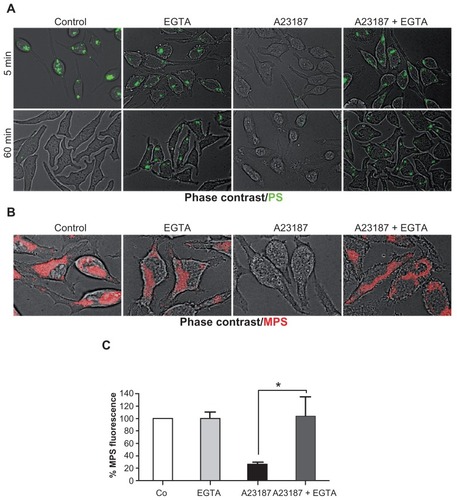
It is worth noting that in the presence of EGTA, MPS-positive vesicles do not change their position. Flow cytometry quantification of this experiment showed that in 5 minutes, some 80% of the cell-associated MPS signal was lost upon A23187-induced exocytosis, and that this loss was fully inhibited by EGTA ().
MPS and PS NPs label distinct cellular organelles and only MPS NPs accumulate in true cathepsin D-containing lysosomes
To see whether endocytosed MPS and PS NPs both converged to the same intracellular secretory compartments, the RBL cells were coincubated with these NPs, and their intracellular traffic and localization was followed with increasing chasing times. MPS NPs stably localized at the periphery of the cell, whereas PS NPs initially localized in perinuclear vesicles, and with time moved toward the periphery, though never merging with MPS-labeled vesicles (). In addition, by 60 minutes, the PS NPs were only faintly detectable in the cell, confirming their continuous expulsion.
Figure 6 MPS and PS NPs localize to distinct intracellular compartments. (A) RBL cells (30,000/cm2) adherent on cover-slips were co-incubated for 5 minutes with 30 μg of MPS and 75 μg of PS NPs, then cells were washed and imaged at 0, 15, and 60 minutes of chase. Representative images of two experiments in triplicate are shown. (B) RBL cells (10,000/cm2) adherent on cover-slips were transfected (for 6 hours with lipofectamine in Optimem medium) with the plasmid coding for the chimeric fluorescent protein cathepsin D-GFP or cathepsin D-mCherry as indicated. At 36 hours post-transfection, the cells were incubated for 5 minutes with 50 nM LysoTracker™ Red or with 15 μg of MPS or 75 μg of PS NPs, as indicated. Representative images of three independent experiments are shown.
Abbreviations: MPS, mesoporous silica; NPs, nanoparticles; RBL, rat basophilic leukemia; PS, polystyrene.
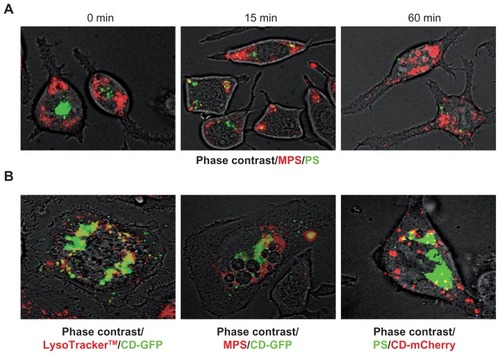
It has previously been shown that RBL secretory granules contain cathepsin D, among other lysosome-resident hydrolases. Citation23 To assess the nature of the organelle labeled by MPS and PS NPs, the secretory organelles were marked by transgenic expression of a fluorescent cathepsin D chimeric protein. We engineered the peGFP- and pmCherry- plasmids placing in front the cDNA coding for Cathepsin D and transfected RBL cells with these plasmids to induce the synthesis of the fluorescent chimeric protein CD-GFP or CD-mCherry.
First, it was ascertained whether the transgenically-expressed fluorescent chimeric cathepsin D protein had indeed reached the acidic compartments. To this end, the latter were labeled with the fluorescent marker LysoTracker™, which is known to trace the vesicles of the endocytic pathway, and to accumulate in acidic lysosomes. Both chimeric CD-GFP () and CD-mCherry (not shown) proteins largely colocalized with the LysoTracker™ (on average, 69% of the fluorescent signals overlapped in a vast majority of transfected cells), indicating the convergence of both tracers at lysosome level. Vesicles labeled with LysoTracker™ only likely represent the endocytic compartments upstream of lysosomes, and vesicles labeled with CD-GFP only likely represent the biogenetic compartments upstream of lysosomes. In CD-GFP-expressing cells, MPS NPs were found to have localized into the majority (>90%) of CD-GFP-labeled vesicles, though additional CD-GFP-negative vesicles also were labeled (). On average, up to 75% of MPS NPs appeared not to have localized with CD-GFP in the vast majority of transfected cells. However, when interpreting the absence of colocalization of vesicular tracers with GFP chimeric proteins, it should be taken into account that GFP fluorescence is rapidly and quantitatively quenched in acidic compartments.
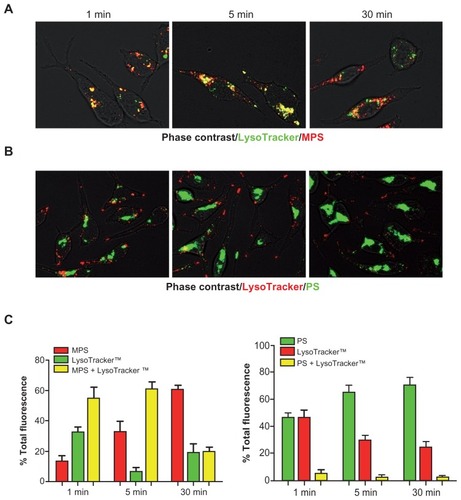
Figure 7 MPS and PS NPs take different endocytic routes. RBL cells (30,000/cm2) adherent on cover-slips were preincubated for 10 minutes with LysoTracker™ (Green or Red), then cells were washed and incubated with NPs and imaged at 1, 5, and 30 minutes. Cell-associated fluorescence was quantified with ImageJ software. Total fluorescence (normalized per cell) was given as a percentage of the individual or mixed color. Representative images of RBL cells incubated with LysoTracker™ green (100 nM) and 10 μg of MPS NPs or with LysoTracker™ Red (50 nM) and 75 μg of PS NPs are shown in (A) and (B), respectively. The intensity of single or mixed fluorescence spots measured in the above samples is shown in (C).
Notes: Data is given as a percentage of the total. Average ± SD of 100 cells randomly chosen. Data from two independent experiments in triplicate are shown.
Abbreviations: MPS, mesoporous silica; NPs, nanoparticles; RBL, rat basophilic leukemia; PS, polystyrene; SD, standard deviation.
Next, we incubated CD-mCherry transfected RBL cells with PS NPs. The image in shows no convergence of PS NPs in vesicles labeled by CD-GFP, suggesting that these NPs were not delivered to true lysosomes. Taken together with data in , the present data indicate that MPS and PS NPs each label distinct secretory compartments in RBL cells.
MPS and PS NPs take different endocytic routes and localize to different intracellular compartments
The above data suggest that MPS and PS NPs are differently trafficked after endocytosis in RBL cells. To characterize the endocytic routes of MPS and PS NPs, a kinetic study was performed on the concomitant uptake of both NPs along with the endocytic pathway tracer LysoTracker™. To enable an objective evaluation of the labeled vesicles, the two fluorescent signals were quantified as individual or merged spots using ImageJ software. Preliminary experiments indicated that endocytosis and intracellular vesicular redistribution of NPs occurred very rapidly. The cells were preloaded with LysoTracker™ for 10 minutes, to allow the complete labeling of vesicles along the endocytic pathway down to the lysosomes. Cells were then washed and incubated with NPs for increasing labeling time.
At a designated time-point the cells were washed and rapidly observed under the microscope (note that a lag time of approximately 60–90 seconds elapsed before capturing the images). Five to ten randomly selected fields were imaged for each sample at 1, 5, and 30 minutes of chase. Representative images are shown in (for MPS NPs) and (for PS NPs). Digitalized images were then analyzed for quantification with the ImageJ software.
It is readily apparent from these images that MPS and LysoTracker™ demonstrated almost complete colocalization at 1 and 5 minutes of labeling, and became partially separated by 30 minutes. In particular, it was noted by this time that both the vesicles traversed by newly entered MPS and the vesicles labeled by pre-existing MPS no longer contained LysoTracker™ fluorescence. Quantification of cell-associated fluorescence showed that >70% of the MPS signal had merged with the LysoTracker™ signal at 1 and 5 minutes of incubation, while by 30 minutes only 20% of MPS fluorescence remained merged with the LysoTracker™. This apparent decrease of colocalization could reflect a physical separation, or, more probably, the loss of signal of one of the two tracers. Indeed, the overall fluorescence emission of the LysoTracker™ greatly diminished over the time of incubation (see also ). Strikingly, PS NPs colocalized with LysoTracker™ at any time (). Together with the above data, it can be concluded that MPS and PS NPs enter the cells through different endocytic routes and reach different final compartments.
MPS and PS NPs exploit different endocytic mechanisms
The observed differences in the internalization and retention rates of MPS and PS NPs may reflect differences in the uptake mechanisms dictated by the specific physical– chemical properties of the NPs. For instance, the cellular uptake of negatively-charged silica NPs was shown to occur through nonspecific adsorptive endocytosis, while that of COOH-functionalized PS NPs in macrophages was shown to be clathrin-dependent and in HeLa cells, the uptake of PS NPs was shown to occur via clathrin-dependent or clathrin/caveolae-independent mechanisms, depending on the NP size.Citation32,Citation33,Citation42 Plasma membrane cholesterol has been shown to be involved in various cellular uptake mechanisms, including those mediated by clathrin, caveolae, and lipid rafts.Citation43 These endocytic pathways can be disrupted by the selective extraction of cholesterol from the plasma membrane, imparted by methyl-β-cyclodextran (MbCD).Citation44 We sought to define whether MPS and PS NPs exploited the same mechanism of cellular entry.
RBL cells were preincubated (or not) for 60 minutes in serum-free medium containing 5 mM MbCD, a condition sufficient to deplete the plasma membrane of cholesterol. The cells were then pulsed for 5 minutes with the NPs, either individually or together, and (after extensive wash) were rapidly observed and imaged under the fluorescence microscope. In the control, serum-containing medium, uptake and internal localization of both NPs resembled the previous findings (). It is of particular note that the incubation in serum-deprived medium greatly stimulated the uptake of both NPs, whether incubated individually or together (). In the latter case, it was apparent that a limited colocalization of the two types of NPs had occurred in a small fraction of organelles.
Figure 8 Membrane cholesterol depletion differentially affects endocytosis of MPS and PS NPs. RBL cells (30,000/cm2) adherent on cover-slips were pulse-labeled for 5 minutes with 10 μg of MPS or 75 μg of PS NPs or both in complete or serum-free medium as indicated. Parallel cultures were preincubated for 1 hour, with 5 mM MbCD in serum-free medium used to assess the involvement of cholesterol-dependent mechanisms in the uptake of NPs. After this, cells were washed and imaged under the fluorescence microscope. Representative images of two independent experiments in triplicate are shown.
Abbreviations: MbCD, methyl-β-cyclodextrin; MPS, mesoporous silica; NPs, nanoparticles; RBL, rat basophilic leukemia; PS, polystyrene.
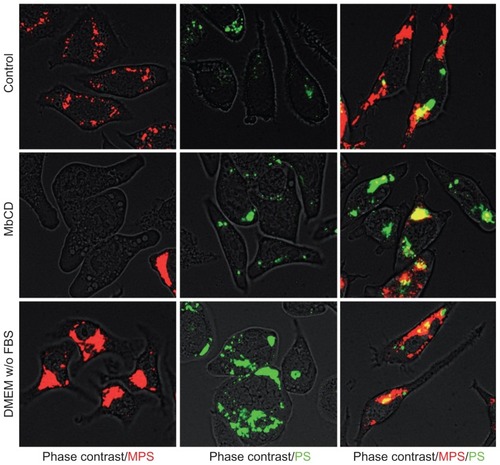
These data indicate that: (1) serum proteins can trap NPs in the medium and greatly reduce their uptake by the cells; (2) serum factors may interfere with the preferential endocytic mechanism and trafficking route of NPs. This second indication is indeed intriguing and deserves further ad hoc investigation. NP opsonization by serum proteins is known to generate the so-called “protein corona”Citation45 and to influence their internalization;Citation33 and (3) most importantly, under membrane cholesterol-depleted conditions, the uptake of MPS NPs was almost completely precluded, while that of PS NPs proceeded normally (). This is compatible with the two different types of NP engaging different endocytic mechanisms. It should be noted, however, that when the two NPs were incubated together under such membrane cholesterol-depleted conditions, an apparently limited stimulation of MPS NPs occurred, and even more interestingly, a partial colocalization of the two NPs was observed.
These findings consistently suggest that the two NPs engage different endocytic mechanisms and routes which lead them to distinct subcellular compartments. In addition, when the cholesterol-dependent endocytic mechanism is disrupted, the uptake of PS NPs is unaffected, while the uptake of MPS is largely prevented, and only partially occurs via the same cholesterol-independent mechanism exploited by PS NPs. A possible explanation is that disruption of the cholesterol-dependent (clathrin- and caveolae-mediated) endocytic pathway results in stimulation of macropinocytosis, which is preferentially exploited by PS NPs.
On the other hand, MPS NPs appear to be preferentially taken up via a clathrin- or caveolae-dependent mechanism. A comparative study in cells that do (or do not) express caveolin-1 or clathrin heavy-chain (for instance through small interference RNA knock-down) may help to clarify the involvement of caveolae or clathrin in the differential uptake of NPs of different material, charge and size.
Conclusion
In this work, it was sought to determine whether MPS and PS NPs could label the inflammatory granules and/or stimulate the rapid exocytosis of these granules in RBL mastocytes, an ‘in vitro’ cell model used to study the inflammation process. It was found that naked MPS and PS-COOH NPs were endocytosed and retained within RBL cells with different levels of efficiency. Both types of NPs gained access to the calcium-regulated secretory compartments of RBL cells. This finding constitutes a proof-of-principle: that it is possible to monitor the inflammation process through the imaging of secretory granules in inflammatory cells ‘in vivo’.
The two types of NPs entered via different endocytic mechanisms, and reached distinct subpopulations of secretory compartments, never showing an overlap of the endocytic routes. While MPS NPs accumulated in acid compartments labeled by LysoTracker™ and containing cathepsin D, PS NPs transitorily accumulated in calcium-regulated recycling compartments not labeled by LysoTracker™ and not containing cathepsin D. Intracellular retention greatly differed between the two types of NPs, with PS-COOH being largely and rapidly expelled in a calcium-dependent fashion.
To the best of our knowledge, this is the first report showing the exocytosis of NPs. The observation that PS-COOH NPs trigger the calcium-dependent recycling of secretory organelles raises concerns about the clinical utilization of this material, because of the potential activation of tissue mastocytes.
Acknowledgments
This research was supported by Poli di Innovazione (Polo “Biotecnologie e biomedicale”, progetto BANP, FinPiemonte, Italy). The fluorescence imaging facility was sponsored by Comoli-Ferrari and C SpA (Novara, Italy).
Disclosure
Cyanine Technology SpA (Turin, Italy) provided the IRIS-3-doped mesoporous silica (MPS) NPs free of charge. Antonino Giovia is the recipient of a PhD fellowship partly financed by Cyanine Technologies SpA (Turin, Italy). The authors report no conflicts of interest in this work.
References
- ChenTShukoorMIWangRSmart multifunctional nanostructure for targeted cancer chemotherapy and magnetic resonance imagingACS Nano20115107866787321888350
- LammersTAimeSHenninkWEStormGKlessingFTheranostic nanomedicineAcc Chem Res201119441029103821545096
- McCarthyJRBhaumikJKarverMRSibel ErdemSWeisslederRTargeted nanoagents for the detection of cancersMol Oncol20104651152820851695
- Caldorera-MooreMELiechtyWBPeppasNAResponsive theranostic systems: integration of diagnostic imaging agents and responsive controlled release drug delivery carriersAcc Chem Res201144191061107021932809
- ParkMVNeighAMVermeulenJPThe effect of particle size on the cytotoxicity, inflammation, developmental toxicity and genotoxicity of silver nanoparticlesBiomaterials201132369810981721944826
- LuXQianJZhouHIn vitro cytotoxicity and induction of apoptosis by silica nanoparticles in human HepG2 hepatoma cellsInt J Nanomedicine201161889190121931484
- HarperSLCarriereJLMillerJMHutchisonJEMadduxBLTanquayRLSystematic evaluation of nanomaterial toxicity: utility of standardized materials and rapid assaysACS Nano2011564688469721609003
- NelAXiaTMädlerLLiNToxic potential of materials at the nanolevelScience2006311576162262716456071
- XiaTKovochichMLiongMZinkJINelAECationic polystyrene nanosphere toxicity depends on cell-specific endocytic and mitochondrial injury pathwaysACS Nano200821859619206551
- Halamoda KenzaouiBChapuis BernasconiCGuney-AyraSJuillerat-JeanneretLInduction of oxidative stress, lysosome activation and autophagy by nanoparticles in human brain-derived endothelial cellsBiochem J2012441381382122026563
- SunLLiYLiuXCytotoxicity and mitochondrial damage caused by silica nanoparticlesToxicol In Vitro20112581619162921723938
- JennyMSchroecksnadelSFuchsDTesting for immunomodulatory properties of nanoparticlesJ Biomed Nanotechnol20117111221485777
- HubbsAFMercerRRBenkovicSANanotoxicology-a pathologist’s perspectiveToxicol Pathol201139230132421422259
- NishanthRPJyotsnaRGSchlagerJJHussainSMReddannaPInflammatory responses of RAW 264.7 macrophages upon exposure to nanoparticles: role of ROS-NFκB signaling pathwayNanotoxicology20115450251621417802
- KnolEFOlszewskiMBasophils and mast cells: underdog in immune regulation?Immunol Lett20111381283121333679
- PejlerGRönnbergEWaernIWemerssonSMast cell proteases: multifaceted regulators of inflammatory diseaseBlood2010115244981499020233968
- KalesnikoffJGalliSJNew developments in mast cell biologyNat Immunol20089111215122318936782
- Groot KormelinkTAbudukelimuARedegeldFAMast cells as target in cancer therapyCurr Pharm Des200915161868187819519429
- RibattiDCrivellatoEThe controversial role of mast cells in tumor growthInt Rev Cell Mol Biol20092758913119491054
- WasiukAde VriesVCHartmannKRüersANoelleRJMast cells as regulators of adaptive immunity to tumoursClin Exp Immunol2009155214014619077084
- PassanteEFrankishNThe RBL-2H3 cell line: its provenance and suitability as a model for the mast cellInflamm Res2009581173774519669619
- PuriNRochePAMast cells possess distinct secretory granule subsets whose exocytosis is regulated by different SNARE isoformsProc Natl Acad Sci U S A200810572580258518250339
- DragonettiABaldassarreMCastinoRThe lysosomal protease cathepsin D is efficiently sorted to and secreted from regulated secretory compartments in the rat basophilic/mast cell line RBLJ Cell Sci2000113183289329810954426
- ParkCHLimKTPhytoglycoprotein (75 kDa) suppresses release of histamine and expression of IL-4 and IFN-gamma in BPA-treated RBL-2H3 cellsImmunol Invest201039217118520136622
- OwHLarsonDRSrivastavaMBairdBAWebbWWWiesnerUBright and stable core-shell fluorescent silica nanoparticlesNano Lett200551113111715792423
- HuangYFLiuHXiongXChenYTanWNanoparticle-mediated IgE-receptor aggregation and signaling in RBL mast cellsJ Am Chem Soc200913147173281733419929020
- GianottiEBertolinoCABenziCPhotoactive hybrid nanomaterials: indocyanine immobilized in mesoporous MCM-41 for “in-cell” bioimagingACS Appl Mater Interfaces20091367868720355990
- VallhovHGabrielssonSStrømmeMSchevniusAGarcia-BennettAEMesoporous silica particles induce size dependent effects on human dendritic cellsNano Lett20077123576358217975942
- RosenholmJMMeinanderAPeuhuETargeting of porous hybrid silica nanoparticles to cancer cellsACS Nano20093119720619206267
- LeeSYunHSKimSHThe comparative effects of mesoporous silica nanoparticles and colloidal silica on inflammation and apoptosisBiomaterials201132359434944321889200
- WangTZhangLSuZWangCLiauYFuQMultifunctional hollow mesoporous silica nanocages for cancer cell detection and the combined chemotherapy and photodynamic therapyACS Appl Mater Interfaces2011372479248621604817
- LaiSKHidaKManSTPrivileged delivery of polymer nanoparticles to the perinuclear region of live cells via a non-clathrin, non-degradative pathwayBiomaterials200728182876288417363053
- LunovOSyrovetsTLoosCDifferential uptake of functionalized polystyrene nanoparticles by human macrophages and a monocytic cell lineACS Nano2011531657166921344890
- YanagisawaRTakanoHInoueKIKoikeESadakaneKIchinoseTSize effects of polystyrene nanoparticles on atopic dermatitislike skin lesions in NC/NGA miceInt J Immunopathol Pharmacol201023113114120378001
- CorbalanJJMedinaCJacobyAMalinskyTRadomskiMWAmorphous silica nanoparticles trigger nitric oxide/peroxynitrite imbalance in human endothelial cells: inflammatory and cytotoxic effectsInt J Nanomedicine201162821283522131828
- LuJLiongMZinkJITamanoiFMesoporous silica nanoparticles as a delivery system for hydrophobic anticancer drugsSmall2007381341134617566138
- TaoZTomsBBGoodismanJAsefaTMesoporosity and functional group dependent endocytosis and cytotoxicity of silica nanomaterialsChem Res Toxicol200922111869188019817448
- Harush-FrenkelODebottonNBenitaSAttschulerYTargeting of nanoparticles to the clathrin-mediated endocytic pathwayBiochem Biophys Res Commun20073531263217184736
- ArvizoRRMirandaORThompsonMAEffect of nanoparticle surface charge at the plasma membrane and beyondNano Lett20101072543254820533851
- McCarthyJGongXNahirneyDDuszykMRadomskiMPolystyrene nanoparticles activate ion transport in human airway epithelial cellsInt J Nanomedicine201161343135621760729
- CastinoRDémozMIsidoroCDestination ‘lysosome’: a target organelle for tumour cell killing?J Mol Recognit200316533734814523947
- XingXHeXPengJWangKTanWUptake of silica- coated nanoparticles by HeLa cellsJ Nanosci Nanotechnol20055101688169316245529
- PichlerHRiezmanHWhere sterols are required for endocytosisBiochim Biophys Acta200416661–2516115519308
- KilsdonkEPYanceyPGStoudtGWCellular cholesterol efflux mediated by cyclodextrinsJ Biol Chem19952702917250172567615524
- GessnerALieskeAPaulkeBRMüllerRHFunctional groups on polystyrene model nanoparticles: influence on protein adsorptionJ Biomed Mater Res A200365331932612746878
- BurghardtRCBarhoumiRLewisEHPatulin-induced cellular toxicity: a vital fluorescence studyToxicol Appl Pharmacol199211222352441539161
- FolloCCastinoRNicotraGTrinchenNFIsidoroCFolding, activity and targeting of mutated human cathepsin D that cannot be processed into the double-chain formInt J Biochem Cell Biol200739363864917188016