Abstract
Lanthanoid-based optical probes with excitation wavelengths in the ultra-violet (UV) range (300–325 nm) have been widely developed as imaging probes. Efficient cellular imaging requires that lanthanoid optical probes be excited at visible wavelengths, to avoid UV damage to cells. The efficacy of europium-catalyzed single-walled carbon nanotubes (Eu-SWCNTs), as visible nanoprobes for cellular imaging, is reported in this study. Confocal fluorescence microscopy images of breast cancer cells (SK-BR-3 and MCF-7) and normal cells (NIH 3T3), treated with Eu-SWCNT at 0.2 μg/mL concentration, showed bright red luminescence after excitation at 365 nm and 458 nm wavelengths. Cell viability analysis showed no cytotoxic effects after the incubation of cells with Eu-SWCNTs at this concentration. Eu-SWCNT uptake is via the endocytosis mechanism. Labeling efficiency, defined as the percentage of incubated cells that uptake Eu-SWCNT, was 95%–100% for all cell types. The average cellular uptake concentration was 6.68 ng Eu per cell. Intracellular localization was further corroborated by transmission electron microscopy and Raman microscopy. The results indicate that Eu-SWCNT shows potential as a novel cellular imaging probe, wherein SWCNT sensitizes Eu3+ ions to allow excitation at visible wavelengths, and stable time-resolved red emission. The ability to functionalize biomolecules on the exterior surface of Eu-SWCNT makes it an excellent candidate for targeted cellular imaging.
Introduction
Lanthanoid trivalent ion- (LnIII) based luminescence agents show tremendous potential as optical probes for various analytical and biomedical applications.Citation1,Citation2 They offer several advantages over organic dyes and semiconductor quantum dots, due to their high quantum yield, large Stokes shift, and narrow emission peaks.Citation3 Despite these attractive features, only a few lanthanoid optical probes have been investigated for cellular imaging.Citation4–Citation8 One of the main limitations to investigation is that most lanthanoid luminescent bioprobes have peak absorption at around 300–325 nm, and excitation wavelengths in the ultraviolet (UV) range.Citation4 Thus, for cellular imaging, chemical moieties need to be designed that not only meet stringent requirements (such as efficient sensitization of lanthanoid ions and minimization of nonradiative losses), but also achieve shifting of the excitation wavelength into the visible range.Citation4
The photophysics of single-walled carbon nanotubes (SWCNTs) has been widely investigated, with a large number of studies examining their optical, absorptive, and excitonic properties.Citation9 Recently, the synthesisCitation10 and photophysical propertiesCitation11 of europium (Eu)-catalyzed single-walled carbon nanotubes have been reported. The results demonstrate that Eu3+ ions are sensitized at a visible wavelength of ≥365 nm, by the intrinsic excitonic property of SWCNTs, to emit red luminescence. In this paper, we report the efficacy of Eu-SWCNT as an optical nanoprobe for cellular imaging.
Materials and methods
Preparation of Eu-SWCNT solutions
The synthesis of Eu-SWCNT was carried out using chemical vapor deposition, as reported previously.Citation10 After synthesis, the silicon wafer on which Eu-SWCNTs were grown was suspended in 15 mL of deionized water in a 50 mL centrifuge tube. The samples were sonicated for 30 minutes at 30 W to release Eu-SWCNT, along with any free Eu nanoparticles, into deionized water. The silicon wafer was then removed, and the vials were centrifuged at 15,000 g for 30 minutes. The supernatant, containing hydrophilic free Eu nanoparticles, was discarded, and the pellet containing Eu-SWCNT collected. This process of batch sonication, followed by centrifugation, was repeated twice, to ensure the removal of free nanoparticles. The pellet containing hydrophobic Eu-SWCNT aggregates was suspended in 5 mL of 1% (w/v) pluronic F127 solution (Sigma-Aldrich, St, Louis, MO), and probe-sonicated (Cole-Palmer, Vernon Hills, IL) at 300 W for 10 minutes. The samples were then centrifuged at 15,000 g for 30 minutes, and the supernatant, containing highly-dispersed Eu-SWCNTs, was collected for photophysical and in vitro studies. The concentration of this solution was 10 μg/mL.
Spectral studies
Steady-state photoluminescence emission measurements of Eu-SWCNT in 1% pluronic F127 solution, and in control samples, were recorded using a Fluorolog® spectrofluorometer (Horiba Jobin Yvon, Edison, NJ), with a xenon lamp as the excitation source.
Cell culture and viability assay
Three different cell lines were used in this study, obtained from ATCC (Manassas, VA): Sloan-Kettering breast cancer cells (SK-BR-3; catalog HTB-30); Michigan Cancer Foundation breast cancer cells (MCF-7, catalog HTB-22); and mouse fibroblast cells (NIH 3T3, catalog CRL-1658). The SK-BR-3 cells were grown in McCoy’s 5A medium, the MCF-7 breast cancer cells in RPMI medium, and the NIH 3T3 mouse fibroblasts in DMEM medium. All media were obtained from Life Technologies (Grand Island, NY), and were supplemented with 2 mM/L-glutamine, 100 IU/mL penicillin, 100 μg/mL streptomycin (Life Technologies), and 10% heat-inactivated fetal bovine serum (FBS; HyClone, Thermo Scientific, Milan, Italy). Cells were maintained at 37°C in a saturated-humidity incubator, containing a 95% air to 5% carbon dioxide mix. For the cell proliferation assay, 1 × 10⁴ cells/mL were cultured overnight in 96-well plates. Later, the culture medium was replaced with fresh medium and treated with 0.2 μg/mL of Eu-SWCNT for 12, 24, and 48 hours. To determine the effect of Eu-SWCNT on cell viability, the WST-1 [tetrazolium salt 2-(4-iodophenyl)-3-(4-nitophenyl)-5-(2,4-disulfophenyl)-2H-tetrazoilium] cell proliferation assay was performed, according to the manufacturer’s protocol. The culture medium was replaced with 100 μL of medium containing 10 μL of WST-1 solution, incubated for 2 hours in standard conditions, and the absorbance was then measured (EL800™, Biotek®, Winooski, VA) at a wavelength of 450 nm, with background subtraction at 650 nm. The absorbance measured at 450 nm is the peak wavelength for formazan crystals formed from WST dye by cellular mitochondrial dehydrogenase. The turbid background (cells and media) also absorbs at 450 nm. However, only the background absorbs at 650 nm. Thus, the absorbance at 650 nm is obtained as a reference, and subtracted from the absorbance at 450 nm, to eliminate the background.
Cellular uptake mechanism
Extracellular materials are internalized into cellular cytoplasm through two different uptake pathways: energy-independent (passive diffusion), and energy-dependent (endocytosis).Citation12–Citation14 Endocytosis can be blocked, either by maintaining the cells at 4°C or by depleting ATP synthesis using sodium azide (NaN3). To investigate the cellular uptake mechanism for Eu-SWCNT, cells were treated as follows.
Incubation of cells at low temperature
The breast cancer and non-breast cancer cells, cultured in standard culture conditions (10% FBS; 1% penicillin-streptomycin; 37°C; 5% CO2) were treated with Eu-SWCNT, and immediately maintained at 4°C for 1 hour.
Incubation of cells under ATP depletion
For the ATP depletion experiments, cells were pre-incubated with 10 mM sodium azide (NaN3) and 50 mM 2-deoxy-D-glucose for 30 minutes at 37°C, followed by incubation with Eu-SWCNT. At the end of each experiment, cells were washed three times with phosphate buffered saline (PBS), then fixed for 30 minutes with ice-cold methanol.
Confocal microscopy
The SK-BR-3, MCF-7, and NIH 3T3 cells were grown in four-chambered glass slides, as a monolayer culture, in their respective media, supplemented with 10% FBS (v/v), under humid conditions (5% CO2), and at 37°C; 1 × 10⁴ cells/mL were cultured overnight in two-well glass chambered slides. Cells were treated with Eu-SWCNT at various temperatures, as described above, fixed with ice-cold methanol for 30 minutes, then washed three times with PBS. Cover slips were mounted onto glass slides using 4′,6-diamidino-2-phenylindole (DAPI; Vector Labs, Burlingame, CA) for nuclear staining.
Confocal fluorescence microscopy for Eu-SWNT was carried out using the LSM 510 Meta confocal microscope (Carl Zeiss, Oberkochen, Germany) in the visible excitation wavelengths (excitation wavelengths = 365 nm or 458 nm). DAPI nuclear staining analysis was performed using a Chameleon XR two-photon laser system (Coherent, Santa Clara, CA; excitation wavelengths = ~800 nm). The images were acquired using Plan Apochromatic 40 × 1.3 oil immersion objectives. The fluorescence emissions were collected using a 560 nm long pass filter, to transmit only Eu-SWCNT emissions above 560 nm. Fluorescence emission for the DAPI-stained cells was collected using a 385–470 nm band-pass filter.
Transmission Electron Microscopy (TEM)
Cells were grown on ACLAR® film (Honeywell, Morristown, NJ), and exposed to Eu-SWCNT for different time periods. At the end of each time period, cells were fixed in 2.5% electron microscopy (EM) grade glutaraldehyde, in 0.1 M PBS. They were then processed, without staining, using standard EM techniques. After fixation, samples were briefly placed in 2% osmium tetroxide in 0.1 M PBS, dehydrated through a graded series of ethanol concentrations, and embedded in Durcupan resin (Sigma-Aldrich). Areas of interest were blocked, cut into 80 nm ultra-thin sections using an Ultracut E microtome (Reichert-Jung, Cambridge, UK), and placed on formvar-coated copper grids. The sections were then viewed with a Tecnai Bio Twin G transmission electron microscope (FEI, Hillsboro, OR), at 80 kV. Digital images were acquired using an XR-60 CCD digital camera system (AMT, Woburn, MA).
Raman measurements on cultured cells
The cells grown on two-well chamber slides were treated with 0.2 μg/mL of Eu-SWCNT for 24 hours. The cells were then washed with PBS, fixed in ice-cold methanol, and imaged using an optical microscope. Single selected cells were subjected to dispersive Raman measurements, by using an excitation laser at 532 nm in a DXR Raman microscope (Thermo Fischer Scientific, Milan, Italy), using a 50× objective. The Raman spectra were obtained for a number of points on the cells. Point-by-point Raman spectra were obtained over an area corresponding with a single selected cell, and then mapped. The G-band intensity of Eu-SWCNT was collected. G-band area maps were constructed and then overlaid with optical images for their localizations.
ICP-OES analysis
To quantify the europium concentration in the cells, approximately 1 × 10⁵ cells were treated overnight with Eu-SWCNT at 0.2 μg/mL concentration. The cells were thoroughly washed with PBS, to remove excess Eu-SWCNT from the medium, then centrifuged at 1000 rpm for 5 minutes. The resulting pellets were digested with concentrated nitric acid. The digested residue was used for elemental analysis by inductively coupled plasma (ICP) optical emission spectrometry (OES), using an Optima 5300 ICP-OES spectrometer (Perkin-Elmer, Waltham, MA).
Statistical analysis
Statistical analysis was performed using the paired Student’s t-test and one-way analysis of variance. P values less than 0.05 were considered significant. Values are expressed as the mean of three experiments ± standard deviation.
Results and discussion
Emission spectral characteristic of Eu-SWCNT
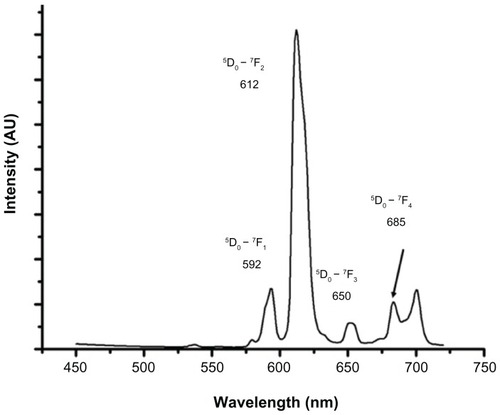
shows the steady state luminescence emission spectrum of Eu-SWCNT dispersed in 1% pluronic F127 solution. The emission spectra show the Eu3+ (5D0 – 7Fj; j = 1–4) transitions, with the most prominent transitions at 5D0 – 7F1 (592 nm) and 5D0 – 7F2 (612 nm). The spectral characteristics of Eu-SWCNT are similar to those previously reported:Citation7 microsecond luminescence lifetime, large Stokes shifts (>150 nm), and narrow and sharp emission peaks that do not overlap.
Figure 1 Steady state emission spectra of Eu-SWCNT dispersed in 1% pluronic F127 solution (concentration 10 μg/mL).
Notes: Excitation at 390 nm gives typical Eu3+ emission spectra with 5D0 – 7Fj transitions (j = 0 to 4). The prominent transitions for Eu-SWCNT are 5D0 – 7F1 (592 nm), 5D0 – 7F2 (612 nm), 5D0 – 7F3 (653 nm), and 5D0 – 7F4 (685–700 nm).
Abbreviation: AU, arbitrary units.
Cell viability
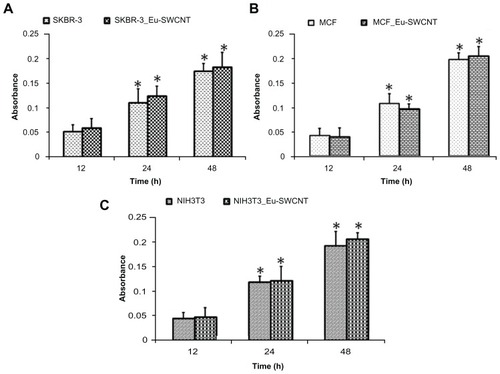
It is a prerequisite to use non-toxic dosages when examining the efficacy of Eu-SWCNT as a nanoprobe for cellular imaging. Several groups have reported that well-dispersed SWCNT at concentrations less than 10 μg/mL shows no cytotoxic effect on internalization.Citation15–Citation18 An incubation concentration of 0.2 μg/mL of Eu-SWCNT was chosen, and its cytocompatibility assessed with SK-BR-3, MCF-7, and NIH-3T3 cells, using the WST-1 cell proliferation assay. The assay results () clearly indicate that cells treated with 0.2 μg/mL of Eu-SWCNT for up to 48 hours have no cytotoxic effects, and show proliferation characteristics similar to those of the controls (untreated cells).
Figure 2 WST-1 proliferation assay to assess cytotoxicity of Eu-SWCNT treatment (0.2 μg/mL) for (A) SK-BR-3, (B) MCF-7, and (C) NIH 3T3 cells.
Notes: Data are presented as mean ± standard deviation (n = 3; P < 0.05 at 12-hour time point). No significant change was observed between Eu-SWCNT-treated and untreated cells at each time point.
Abbreviations: Eu-SWCNT, europium–catalyzed single–walled carbon nanotubes; MCF, Michigan Cancer Foundation breast cancer cells; WST–1, tetrazolium salt 2-(4-iodophenyl)-3-(4-nitophenyl)-5-(2,4-disulfophenyl)-2H-tetrazoilium.
Fluorescence imaging at visible excitation wavelengths of Eu-SWCNT-treated cells
shows representative bright-field and fluorescence confocal images of Eu-SWCNT-treated SK-BR-3 cells. All three cell types (SK-BR-3, MCF-7, and NIH 3T3) showed similar Eu-SWCNT uptake characteristics (data not shown). Based on inductively coupled plasma (ICP) analysis, the average cellular uptake concentration was 6.68 ng Eu/cell. The labeling efficiency, defined as the percentage of Eu-SWCNT-labelled cells, was 95%–100% for all cell types.
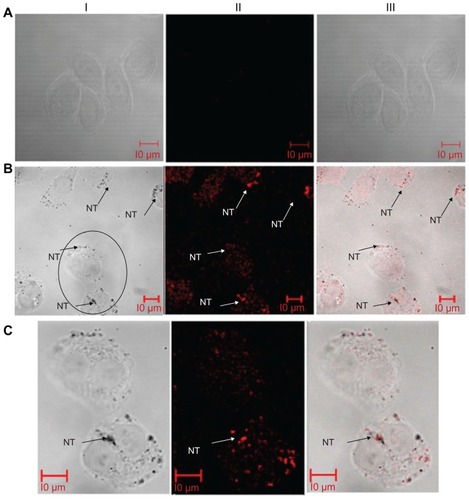
shows representative confocal images of Eu-SWCNT-treated and untreated SK-BR-3 cells. The confocal images include optical, fluorescence (acquired after violet-excitation with Argon laser [excitation wavelength = 365 nm], with emission collected using a 560 nm, long pass filter), and overlays of optical over fluorescence images. The cells not treated with Eu-SWCNT showed no detectable emission (, Panels I–III). The luminescence image in (Panel II) clearly shows bright red luminescence that is not observed in (Panel II). Furthermore, the overlay of optical and fluorescence images in (Panel III) indicates that some Eu-SWCNTs are internalized by cells, while others are outside cells. shows the confocal images of two cells at 40 x magnification. The images show small aggregates of Eu-SWCNT, inside and outside cells, with bright red luminescence. The confocal images of the Eu-SWCNT-incubated cells show no morphological changes, compared with the controls. This indicates that Eu-SWCNT was non-toxic, at the dosage used in this study, for up to 48 hours, further corroborating the results of the earlier cell proliferation assay.
Figure 3 Confocal luminescence images of SK-BR-3 cells treated with Eu-SWCNT (0.2 μg/mL) for 24 hours at 37°C (excitation wavelength = 365 nm, emission wavelength = 560 nm, with long pass filter).
Notes: (A) Confocal images of untreated cells in (I) bright field, (II) luminescence, and (III) overlay of bright field and luminescence; (B) images of Eu-SWCNT in SK-BR-3 cells in bright field; (C) optical and luminescence images of Eu-SWCNT-internalized cells – circled in panel BI – at 40× magnification. Arrows point to a few representative Eu-SWCNTs.
Abbreviation: Eu-SWCNT, europium–catalyzed single–walled carbon nanotubes.
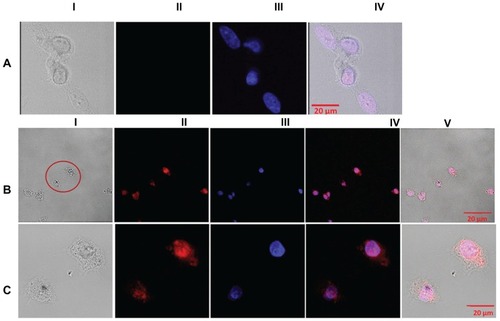
shows representative confocal images of Eu-SWCNT-treated and untreated SK-BR-3 cells, excited at a blue visible wavelength (excitation wavelength = 458 nm). (Panel I) shows the bright optical image of Eu-SWCNT-internalized cells. The internalized Eu-SWCNT appears as small aggregates in the cytoplasm. (Panel II) shows red fluorescence emission from the cells treated with Eu-SWCNT. No red emission is seen in the untreated cells (, Panel II). To distinguish the ultra-localization of Eu-SWCNT in the cytoplasm and nucleus, DAPI was used to co-stain the nucleus. The low magnification images (, Panel III) could not reveal the subcellular localization of Eu-SWCNT. Therefore, images were also acquired at 40× magnification (). The overlay of Eu-SWCNT emission and DAPI-stained images (, Panel IV) shows red emission in a small section of the nucleus. The images indicate that small amounts of Eu-SWCNT enter the nucleus, and are also scattered in the cytoplasm, mostly around the nucleus. Analysis of the confocal images of all three cell types treated with Eu-SWCNT showed similar subcellular localization of Eu-SWCNT, indicating that cytodistribution is not cell-specific. Most Eu-SWCNT that is in loosely-bound, submicron- sized aggregates emits luminescence. Tightly- bound micron-sized aggregates quench luminescence. Our results indicate, qualitatively, that the level of aggregation- induced self-quenching is quite low. However, the luminescence self-quenching caused by aggregation is not unique to Eu-SWCNT, and has been reported for other luminescent probes.Citation17,Citation19–Citation21 The confocal images clearly show that time-resolved, red emission of Eu-SWCNT overcomes the endogenous fluorescence contributed by other cellular biomacromolecules (eg, flavins, nicotinamide adenine dinucleotides, collagens, and porphyrins) in the wavelength range 400–550 nm.Citation22 The involvement of these endogenous biomolecules in the luminescence-quenching process by direct interaction with Eu-SWCNT cannot be neglected, and needs further investigation.Citation23
Figure 4 Confocal red luminescence images of SK-BR-3 cells treated with Eu-SWCNTs (0.2 μg/mL) for 24 hours at 37°C (excitation = 458 nm, emission = 560 nm, with long pass filter), and of untreated controls.
Notes: (A) Confocal images of Eu-SWCNT-untreated cells in the (I) bright field, (II) red luminescence, (III) nucleus stained with DAPI, and (IV) overlay of bright field and luminescence; (B) confocal images of Eu-SWCNT-treated SK-BR-3 cells in (I) bright field, (II) red luminescence, (III) nucleus stained with DAPI, (IV) overlay of Eu-SWCNT luminescence and DAPI, and (V) overlay of bright field, Eu-SWCNT luminescence, and DAPI; (C) optical and luminescence images of Eu-SWCNT-internalized and DAPI-stained cells – circled in panel BI – at 40× magnification.
Abbreviations: DAPI, diamidino-2-phenylindole; Eu-SWCNT, europium–catalyzed single–walled carbon nanotubes.
Ultrastructural cellular localization of Eu-SWCNT
Transmission electron microscopy () and Raman imaging () were performed to confirm the presence and subcellular localization of Eu-SWCNT. shows a TEM image of a representative histological specimen of cells without Eu-SWCNT. show TEM images of representative histological specimens of Eu-SWCNT-treated cells. The TEM images of both untreated and Eu- SWCNT-treated cells show normal cellular morphology, including that of cellular components such as nucleus, nuclear membrane, cytoplasm, vacuole, and mitochondria. show that Eu-SWCNT is present in the nucleus as well as the cytoplasm. show that Eu-SWCNT is also located in the cytoplasmic vacuoles, which are either endosomes or lysosomes. Endosomes transport molecules within the plasma membrane to lysosomes. Citation24 Endosomes have heterogeneous morphology, and contain intra-organelle vesicles; their matrix density is lighter than that of the surrounding cytoplasm. Lysosomes are multivesicular, spherical or ovoid, membrane-bound organelles 0.3–0.8 μm in size. They have a granular matrix and contain ribosomes, glycogen particles, lipid droplets, and hydrolytic enzymes, which break down cellular debris.Citation25 The lysosomal matrix density is similar to that of the surrounding cytoplasm. clearly show the presence of Eu-SWCNT in a lysosome, which appears as a dense vesicular structure, and in an endosome, which appears as a light vesicular structure. suggests that Eu-SWCNT is transferred from endosomal structures and fused into membranous, granular lysosomal structures. This phenomenon is observed for the transportation of various cellular biomolecules.Citation25,Citation26 The sub-cellular localization of Eu-SWCNT is similar to that observed in previous reports of SWCNT.Citation17 The mechanism of entry of Eu-SWCNT into the nucleus needs further investigation; reports by various groups have shown that SWCNT, functionalized with peptides, radiolabels, or DNA/RNA, could enter the nucleus.Citation27–Citation29
Figure 5 TEM images of Eu-SWCNT distributed in the cytoplasm and nucleus of SK-BR-3 cancer cells.
Notes: TEM images of morphology of (A) untreated cells; (B) Eu-SWCNT-treated cells; distribution in the nucleus of Eu-SWCNT at (B) low magnification and (C) high magnification; (D) presence of Eu-SWCNT in cytoplasmic vacuoles; Eu-SWCNT-treated cells, showing their distribution in (E) lysosomes (yellow circles) and (F) endosomes (purple circles). Arrows point to Eu-SWCNT.
Abbreviations: TEM, transmission electron microscopy; N, nucleus; NM, nuclear membrane; Cy, cytoplasm; V, vacuole; M, mitochondria; ST-N, Eu-SWNT in nucleus; NT-E, endocytosed Eu-SWNT.
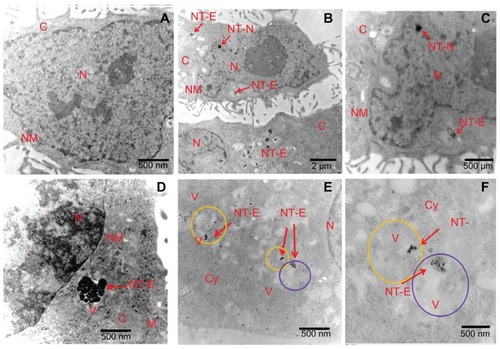
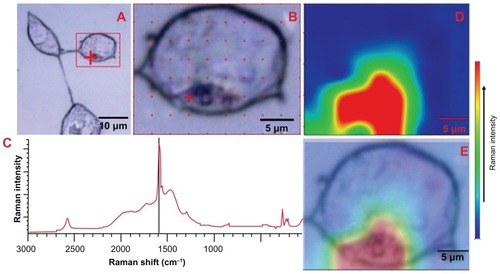
Figure 6 Raman spectra and G-band intensity map of Eu-SWCNT in SK-BR-3 cells.
Notes: (A) bright field image of the cells treated with 0.2 μg/mL of Eu-SWCNT for 24 hours. (B) Within SK-BR-3 cells, Raman G-band intensity was acquired at different points (marked in red) to detect and confirm the presence Eu-SWCNT. (C) Raman spectra of Eu-SWCNT uptaken by the cells. (D) Area map of Raman G-band intensity of Eu-SWCNT in SK-BR-3 cells. (E) Area map of Raman G-band intensity of Eu-SWCNT in cells, overlaid on an optical micrograph of the same region.
Abbreviation: Eu-SWCNT, europium–catalyzed single–walled carbon nanotubes.
Confocal Raman microscopy of cells treated with Eu-SWCNT
The internalization of Eu-SWCNT into cells was further corroborated by confocal Raman microscopy. shows an optical image of SK-BR-3 cells treated with Eu-SWCNT. Raman spectra were obtained from a few selected points inside and outside the cell, as shown in . Only the region within the cell shows the Raman peak characteristics of Eu-SWCNT (). The peaks include a strong G-band at 1589 cm−1, a weak D-band at 1306 cm−1, and radial breathing modes between 200 and 300 cm−1, indicating the presence of Eu-SWCNT. shows a raster image of a cell that provided a Raman map of an area containing Eu-SWCNT, focusing on the G-band peak. The peak at 1589 cm−1 is the tangential Raman mode, characteristic of graphitic structure. The area map shows the regions of elevated G-band Raman intensity corresponding to Eu-SWCNT incorporation into cytoplasmic vesicles. shows the overlay of the Raman G-band intensity map () on the optical image, confirming the presence of Eu-SWCNT within the cells.
Cellular uptake mechanism of Eu-SWCNT
Experiments were performed to investigate the cellular uptake mechanisms of Eu-SWCNT. Previous studies have shown that cells can uptake SWCNT either by energy-independent or energy-dependent pathways (endocytosis).Citation16,Citation30 It is well known that endocytosis – a general uptake mechanism for most extracellular substances – is an energy-dependent mechanism, and is hindered when experiments are carried out at 4°C, or in ATP-depleted conditions. Confocal fluorescence microscopy () and TEM () images were obtained from SK-BR-3, MCF-7, and NIH 3T3 cells that had been treated with Eu-SWCNT at 4°C, or in an ATP-depleted environment. The confocal images were analyzed for red emission after excitation in the visible range (excitation wavelength = 458 nm).
Figure 7 Cellular endocytic mechanism of Eu-SWCNT uptake: confocal fluorescence images of different cells after incubation with Eu-SWCNT at 4°C for 1 hour.
Notes: (I) Optical images; (II) Eu-SWCNT luminescence images; (III) DAPI-labeled images; (IV) overlay of Eu-SWCNT luminescence and DAPI fluorescence; (V) overlay of Eu-SWCNT luminescence, DAPI fluorescence, and optical image.
Abbreviations: DAPI, diamidino-2-phenylindole; Eu-SWCNT, europium–catalyzed single–walled carbon nanotubes; MCF, Michigan Cancer Foundation breast cancer cells; SKBR, Sloan–Kettering breast cancer cells.
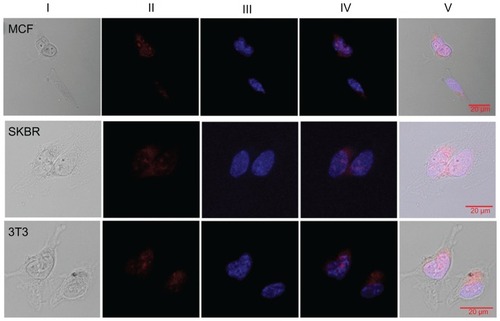
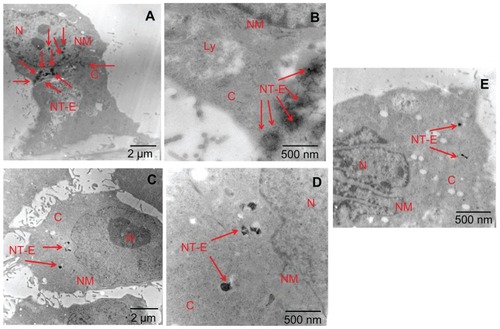
Figure 8 Transmission electron microscopy images of Eu-SWCNT-internalized SK-BR-3 cancer cells at (A and B) 37°C, (C and D) 4°C, and (E) ATP depletion conditions.
Notes: (A) Cells treated with Eu-SWCNT at 37°C showing endocytosed Eu-SWCNT distributed in the cytoplasm; (B) higher magnification showing the presence of Eu-SWCNT (red arrows); (C) low magnification, and (D) high magnification of cells maintained at 4°C, showing lesser amounts of internalized Eu-SWCNT; (E) ATP depletion conditions show lower internalization of Eu-SWCNT.
Abbreviations: N, nucleus; NM, nuclear membrane; Cy, cytoplasm; V, vacuole; M, mitochondria; ST-N, Eu-SWNT in nucleus; NT-E, endocytosed Eu-SWNT.
As seen in , cellular incubations with Eu-SWCNT that were carried out at 4°C showed red emission, albeit at low levels compared to the experiments performed at 37°C. The total intensity (Panel II), a direct indicator of internalized Eu-SWCNT, varied among the different cell lines. The studies performed after ATP depletion (data not shown) showed similar results, suggesting that an energy-dependent mechanism is mainly involved in the cellular internalization of Eu-SWCNT. Our results are consistent with earlier studies, which showed that the energy-dependent pathway (endocytosis) is the preferred process for cellular internalization of sub-micron-sized (<1 μm) SWCNT,Citation31 but are contrary to those of Panterotto et al,Citation32 where SWCNT uptake was through an energy-independent, non-endocytotic mechanism. Recently, a systematic study, carried out on a variety of emissive lanthanide complexes, suggested that the most common internalization pathway is through the process of endocytosis.Citation7
shows representative TEM images of the SK-BR-3 cells incubated with Eu-SWCNT for the cellular uptake mechanism studies discussed above. The images () clearly show greater amounts of cellular-internalized Eu-SWCNT (NT-E) in the endocytotic vesicles, at standard culture conditions of 37°C. Only small quantities of Eu-SWCNT are internalized into the cells when the temperature is reduced to 4°C (), or under ATP depletion conditions (), which prevent endocytosis, limiting the internalization of Eu-SWCNT. The TEM results indicate endocytosis-mediated uptake of Eu-SWCNT nanoprobes, corroborating the confocal luminescence results.
A variety of optical probes, such as organic dyes, quantum dots, semi-conducting SWCNT, and lanthanoid complexes have been used for cellular imaging.Citation1,Citation2,Citation33,Citation34 The advantage of lanthanoid-based optical probes over organic dyes, quantum dots, and semi-conducting SWCNTs are their long fluorescence lifetimes (in microsecond range), large Stokes shifts (>150 nm), sharply-spiked emission spectra, and relatively good quantum yield.Citation3,Citation35 Lanthanoid-based optical probes with UV excitation wavelengths (300–325 nm) have been widely used for time-resolved luminescence immunoassays, and to assay intracellular components, such as DNA and enzymes.Citation1,Citation36–Citation38 Cellular imaging requires the lanthanoid optical probes to excite at visible wavelengths (>360 nm), to avoid UV damage to the cells. Few studies in the last four decades have systematically investigated their suitability for the imaging of live or fixed cells,Citation4–Citation8,Citation39 In these studies, cells labelled with lanthanoids, coordinated with different chelate molecules (eg, aminocarboxylates, hydroquinolinates, hydroxyisophthalamide, β-diketonates tetraazatriphenylene, thiaxanthones, and heptadentate macrocyclics) have been excited at visible wavelengths of up to 410 nm, for cellular imaging. These optical probes show variable concentration-dependent cytotoxicity, and differential accumulation in various subcellular compartments.Citation1,Citation22,Citation39,Citation40 In the present study, cellular imaging was achieved with a standard luminescence confocal microscope, not only at 365 nm but also at 458 nm excitation wavelength; a greater than 48 nm red-shift in the excitation wavelength compared to lanthanoid-chelate probes. The results indicate that Eu-SWCNT is internalized into the cytoplasm and localizes into the cellular vacuoles by the process of endocytosis. From these investigations, it is difficult to comment on the minimum amount of Eu-SWCNT required to efficiently label cells to obtain detectable luminescence. Additional studies are required to obtain this information. The intense time-gated red luminescence of Eu-SWCNT, observed in and around the cells, provides high contrast with no interference from background autofluorescence. The results also show localized intracellular red emission regions, due to Eu-SWCNT, when it is distributed as sub-micron-sized aggregates. Eu-SWCNT may overcome the limitations of semi-conducting SWCNT, which exihibit near-to-mid photoluminescence, such as low emission efficiency, and broadening and reduction of emission intensity due to aggregation.Citation41
Conclusions
Eu-SWCNT shows promise as a nanoprobe for cellular imaging, allowing excitation at visible wavelengths of up to (at least) 458 nm. The SWCNT-sensitized red luminescence emission from Eu3+ is very stable, and the bright intensity is retained at 24 hours post-incubation in various cell lines. Luminescence of Eu-SWCNT in cells can easily be detected by standard confocal luminescence microscopy, and its internalization and presence has been corroborated by Raman and transmission electron microscopy. Eu-SWCNT is uptaken by cells primarily through an endocytosis mechanism. Since the Eu3+ emission at 619 nm is sensitive to the surrounding physiological environment, Eu-SWCNT could be developed as a probe to obtain information about cell physiology (eg, pH changes).Citation36 The ability to functionalize biomolecules on the exterior surface of Eu-SWCNT makes it an excellent candidate for cellular targeting. Eu-SWCNT shows potential as an optical probe for targeted functional cellular imaging.
Acknowledgments
This work was supported by the Breast Cancer Research Program of the Department of Defense (W81XWH-10-1-0521), Feldstein Medical Foundation, and the Carol M Baldwin Fund. The authors thank Dr Karen Gall (Horiba Jobin Yvon, Edison, NJ) for the fluorescence spectroscopy measurements, Dr Guo-Wei Tian and Stephanie Burke for confocal microscopy, and Susan Van Horn (Central Microscopy Services, Stony Brook University) for transmission electron microscope image acquisition.
Disclosure
The authors report no conflicts of interest in this work.
References
- BunzliJCGLanthanide luminescence for biomedical analyses and imagingChem Rev201011052729275520151630
- PetoudSCohenSMBünzliJCGRaymondKNStable lanthanide luminescence agents highly emissive in aqueous solution: multidentate 2-hydroxyisophthalamide complexes of Sm3+, Eu3+, Tb3+, Dy3+J Am Chem Soc200312544133241332514583005
- YuJParkerDPalRPooleRACannMJA europium complex that selectively stains nucleoli of cellsJ Am Chem Soc200612872294229916478184
- DeitersESongBChauvinASVandevyverCDBGumyFBünzliJCGLuminescent bimetallic lanthanide bioprobes for cellular imaging with excitation in the visible light rangeChem–Eur J200915488590019065695
- SongBVandevyverCDBChauvinASBünzliJCGTime-resolved luminescence microscopy of bimetallic lanthanide helicates in living cellsOrg Biomol Chem20086224125413318972043
- MontgomeryCPMurrayBSNewEJPalRParkerDCell-penetrating metal complex optical probes: targeted and responsive systems based on lanthanide luminescenceAcc Chem Res200942792593719191558
- NewEJCongreveAParkerDDefinition of the uptake mechanism and sub-cellular localisation profile of emissive lanthanide complexes as cellular optical probesChem Sci201011111118
- NewEJParkerDSmithDGWaltonJWDevelopment of responsive lanthanide probes for cellular applicationsCurrent Opinion Chem Biol2010142238246
- TretiakSTriplet state absorption in carbon nanotubes: a TD-DFT studyNano Lett2007782201220617497817
- SwierczewskaMRusakovaISitharamanBGadolinium and europium catalyzed growth of single-walled carbon nanotubesCarbon2009471331393142
- SitharamanBRajamaniSAvtiPKTime-resolved red luminescence from europium-catalyzed single walled carbon nanotubesChem Commun201147516071609
- SchmidSLCarterLLATP is required for receptor-mediated endocytosis in intact cellsJ Cell Biol1990111623072126013
- SinghRDPuriVValiyaveettilJTMarksDLBittmanRPaganoRESelective caveolin-1-dependent endocytosis of glycosphingolipidsMol Biol Cell2003148325412925761
- MadshusIHSandvigKOlsnesSvan DeursBEffect of reduced endocytosis induced by hypotonic shock and potassium depletion on the infection of Hep 2 cells by picornavirusesJ Cell Physiol1987131114223032992
- ZhangLWZengLBarronARMonteiro-RiviereNABiological interactions of functionalized single-wall carbon nanotubes in human epidermal keratinocytesInt J Toxicol200726210317454250
- KostarelosKLacerdaLPastorinGCellular uptake of functionalized carbon nanotubes is independent of functional group and cell typeNat Nanotechnol20072210811318654229
- CherukuriPBachiloSMLitovskySHWeismanRBNear-infrared fluorescence microscopy of single-walled carbon nanotubes in phagocytic cellsJ A Chemical Soc2004126481563815639
- BeckerMLFaganJAGallantNDLength dependent uptake of DNA wrapped single walled carbon nanotubesAdv Mater2007197939945
- LiuJYangXWangKA switchable fluorescent quantum dot probe based on aggregation/disaggregation mechanismChem Commun2011473935937
- RusinOStronginRMLimSAbsorption and luminescence probesEncyclopedia of Analytical ChemistryHoboken, NJJohn Wiley2006
- VigerMLLiveLSTherrienODBoudreauDReduction of self-quenching in fluorescent silica-coated silver nanoparticlesPlasmonics2008313340
- BillintonNKnightAWSeeing the wood through the trees: a review of techniques for distinguishing green fluorescent protein from endogenous autofluorescenceAnal Biochem2001291217511401292
- PooleRAMontgomeryCPNewEJCongreveAParkerDBottaMIdentification of emissive lanthanide complexes suitable for cellular imaging that resist quenching by endogenous anti-oxidantsOrg Biomol Chem20075132055206217581648
- TrowbridgeICollawnJHopkinsCSignal-dependent membrane protein trafficking in the endocytic pathwayAnnu Rev Cell Biol1993911291618280459
- KornfeldSMellmanIThe biogenesis of lysosomesAnnu Rev Cell Biol1989514835252557062
- LudwigTGriffithsGHoflackBDistribution of newly synthesized lysosomal enzymes in the endocytic pathway of normal rat kidney cellsJ Cell Biol1991115615611661730
- PantarottoDSinghRMcCarthyDFunctionalized carbon nanotubes for plasmid DNA gene deliveryAngew Chem Int Ed Engl20041163953545358
- LuQMooreJMHuangGRNA polymer translocation with single-walled carbon nanotubesNano Lett200441224732477
- HellerDABaikSEurellTEStranoMSSingle walled carbon nanotube spectroscopy in live cells: Towards long term labels and optical sensorsAdv Mater2005172327932799
- KangBChangSDaiYYuDChenDCell response to carbon nanotubes: Size-dependent intracellular uptake mechanism and subcellular fateSmall20106212362236620878638
- KamNWSLiuZDaiHCarbon nanotubes as intracellular transporters for proteins and DNA: an investigation of the uptake mechanism and pathwayAngew Chem Int Ed Engl20061184591595
- PantarottoDBriandJPPratoMBiancoATranslocation of bioactive peptides across cell membranes by carbon nanotubesChem Commun200311617
- StephensDJAllanVJLight microscopy techniques for live cell imagingScience200330056168212677057
- JaiswalJKMattoussiHMauroJMSimonSMLong-term multiple color imaging of live cells using quantum dot bioconjugatesNat Biotech20022114751
- WuYSoesbeTCKieferGEZhaoPSherryADA responsive europium (III) chelate that provides a direct readout of pH by MRIJ Am Chem Socy2010132401400214003
- PooleRAKielarFRichardsonSLStensonPAParkerDA ratiometric and non-enzymatic luminescence assay for uric acid: differential quenching of lanthanide excited states by anti-oxidantsChem Commun20063940844086
- ParkerDYuJA pH-insensitive, ratiometric chemosensor for citrate using europium luminescenceChem Commun20052531413143
- AtkinsonPFindlayKSKielarFAzaxanthones and azathioxanthones are effective sensitisers for europium and terbium luminescenceOrg Biomol Chem2006491707172216633563
- FriasJCBobbaGCannMJHutchisonCJParkerDLuminescent nonacoordinate cationic lanthanide complexes as potential cellular imaging and reactive probesOrg Biomol Chem20031690590712929627
- MurrayBSParkerDdos SantosCMGPeacockRDSynthesis, chirality and complexation phenomena of two diastereoisomeric dinuclear lanthanide (III) complexesEur J Inorg Chem201020101826632672
- AhmadAKernKBalasubramanianKSelective Enhancement of carbon nanotube Photoluminescence by resonant energy transferChemphyschem200910690590919308969