Abstract
Pathogenic agents can lead to severe clinical outcomes such as food poisoning, infection of open wounds, particularly in burn injuries and sepsis. Rapid detection of these pathogens can monitor these infections in a timely manner improving clinical outcomes. Conventional bacterial detection methods, such as agar plate culture or polymerase chain reaction, are time-consuming and dependent on complex and expensive instruments, which are not suitable for point-of-care (POC) settings. Therefore, there is an unmet need to develop a simple, rapid method for detection of pathogens such as Escherichia coli. Here, we present an immunobased microchip technology that can rapidly detect and quantify bacterial presence in various sources including physiologically relevant buffer solution (phosphate buffered saline [PBS]), blood, milk, and spinach. The microchip showed reliable capture of E. coli in PBS with an efficiency of 71.8% ± 5% at concentrations ranging from 50 to 4,000 CFUs/mL via lipopolysaccharide binding protein. The limits of detection of the microchip for PBS, blood, milk, and spinach samples were 50, 50, 50, and 500 CFUs/mL, respectively. The presented technology can be broadly applied to other pathogens at the POC, enabling various applications including surveillance of food supply and monitoring of bacteriology in patients with burn wounds.
Introduction
Sepsis is a significant, life-threatening problem for military personnel and civilians alike. Clinicians typically make an initial diagnosis of infection with an intermittent examination observing changes in temperature, blood pressure, smell, and sight. Depending on the severity of the inflicted wound and infectious agent, this may cause multiple organ dysfunction, hypoperfusion, failure of body systems (including the kidneys, liver, lungs, and central nervous system), and ultimately death. For sepsis diagnosis, daily culture and/or molecular analysis is performed using a small volume of the patient’s blood; usually less than 0.1% of entire blood volume (ie, approximately 5 mL). These detection methods are time-consuming and unreliable for identification of pathogens in up to 50% of septic patients. Following pathogen detection, the patient is treated with broad-spectrum antibiotics; this is not an ideal solution, because frequent use of broad-spectrum antibiotics also stimulates development of antibiotic-resistant bacteria. Antibiotic-resistant bacteria are a significant problem for injured military personnel and military treatment facilities. Currently, the sepsis mortality rate is 30%–50% among civilians and is higher in patients with military conditions including burns, trauma, and surgery.Citation1 Although sepsis biomarkers, inflammatory modulators, and new antibiotics have been identified in past sepsis research, improved identification of various targets has had minimal impact on sepsis related morbidity and mortality. Therefore, there is a significant clinical need for new detection and identification technologies in this area. According to the Centers for Disease Control and Prevention, food-borne diseases cause approximately 76 million illnesses, 325,000 hospitalizations, and 5,000 deaths in US alone each year.Citation2 The US Department of Agriculture showed that medical costs, productivity losses, and costs of premature deaths caused by food-borne diseases are approximately $6.9 billion per year.Citation3 In 2011, pathogen-based produce contamination triggered a global concern with the outbreak of the foodborne toxin ‘Shiga’, which is produced by Escherichia coli (E. coli).Citation4 On the other hand, sepsis is the tenth leading cause of death in the US,Citation5 amounting to 24,179 cases in 49 US hospitals over a period of 7 years.Citation6 As reported, E. coli can contaminate food sourceCitation7 and cause sepsis in burn patients.Citation8,Citation9 Thus, effective E. coli detection would have a positive impact.
Currently, the gold standard detection method for bacteria is agar plate culture. However, this method is limited by the culturing time and volume of sample required to determine the presence of pathogens (). Due to the challenge of obtaining enough sample volume, agar plate cultures give false negative results at rates ranging from 7.2% to 21.2%.Citation10,Citation11 In addition, the process is complicated by the fact that clinical samples need to go through multiple post-cultural steps for analysis, including Giemsa staining and differentiation on MacConkey plates.Citation12 The whole process takes 48 to 72 hours.Citation13 Although polymerase chain reaction (PCR) has high sensitivity and specificity,Citation14 the need for a thermal cycler makes it unsuitable for point-of-care (POC) testing.Citation15 Therein lies the niche for which microfluidic technologies are ideal; they have been employed to develop POC testing devices because of low manufacturing cost, reduced consumption of samples and reagents, and shortened assay time.Citation15–Citation20 However, existing microfluidic devices for bacterial detection, either based on PCRCitation21 or enzyme-linked immunosorbent assay (ELISA), require multiple sample processing steps prior to detection.Citation22,Citation23 All of these methods suffer from challenges including culture time, need of high sample volumes and reagents, the requirement for preprocessing of samples, low accuracy of the pathogen detection, and high cost. Further, for the detection of rare bacteria, PCR and ELISA based methods require large initial sample volumes, and preprocessing of samples, and sample amplification. Thus, there is an unmet need to develop POC devices that can address these issues, and capture, isolate and detect bacteria from biologically complex samples such as blood and produce.
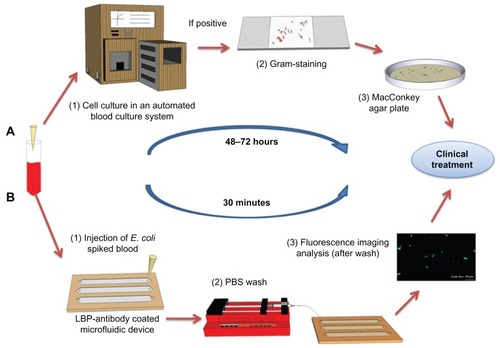
Figure 1 Comparison of the conventional culture method and the microchip based E. coli detection. (A) Conventional procedure for bacteria detection in clinical facilities. Blood sample collection. (1) Blood samples are incubated in an automated blood culture system. (2) Pathogen or bacteria grown on agar plate are subject to Gram-staining for differentiation between Gram-positive and negative strains. (3) The sample is sub-cultured into a nutrient-rich agar plate for the identification of the species and to determine the bacterial concentration. (B) POC testing approach for rapid detection. Blood sample collection (spiked with GFP-expressing E. coli BL21 stock as a model microorganism). (1) The blood sample is analyzed in microchannels functionalized with E. coli antibodies. E. coli were specifically captured by antibodies on the microchannel surface. (2) Unbound E. coli are washed away with PBS using a syringe micropump. (3) GFP-expressing E. coli are imaged/counted under a fluorescence microscope.
Abbreviations: E. coli, Escherichia coli; GFP, green fluorescent protein; LBP, lipopolysaccharide binding protein; PBS, phosphate buffered saline; POC, point-of-care.
To address this unmet need, we developed a POC microchip for capture, isolation, and detection of E. coli in various samples such as physiological buffer solution (phosphate buffered saline [PBS]), blood, milk, and spinach in a simple and rapid manner. This microchip technology could be broadly used as a POC device for multiple applications to rapidly screen for bacteria contamination in blood and food samples, thus improving healthcare and food safety.
Materials and methods
Device fabrication
The microfluidic device was fabricated as previously reported.Citation18,Citation24,Citation25 The device was designed with dimensions of 22 mm × 60 mm with three parallel microchannels. To assemble this device, poly(methyl methacrylate) (PMMA) (1.5 mm thick; McMaster Carr, Atlanta, GA) and double-sided adhesive film (DSA) (50 μm thick; iTapestore, Scotch Plains, NJ) were cut using a laser cutter (Versa Laser™, Scottsdale, AZ). The PMMA base and a glass cover slip were then assembled via the DSA. In the assembled E. coli detection device, three microchannels (with dimensions of 50 mm × 4 mm × 50 μm in the DSA layer) were formed with an inlet and outlet (0.565 mm in diameter) at each end of the channels in the DSA layer. Before assembling the chip, glass cover was cleaned with ethanol using sonication. Then, it was washed with distilled water and dried under nitrogen gas. After cleaning steps, the glass cover was plasma treated for 60 seconds. Then, PMMA, DSA, and glass cover were assembled to form the complete microchip ().
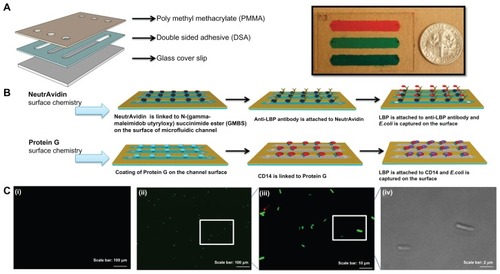
Figure 2 Evaluation of two different surface chemistry methods for E. coli detection on chip. (A) Assembly of the microfluidic chip consisting of PMMA, DSA, and glass cover. Actual image of the assembled microchip containing food dye for visualization. (B) Two antibody immobilization mechanisms were employed, ie, Protein G and NeutrAvidin based surface chemistry. In the first method, biotinylated anti-LBP antibody was immobilized on the microchannel surface via NeutrAvidin. Then, LBP was immobilized on anti-LBP antibody. In the second method, CD14, anti-LPS, or anti-flagellin antibodies was immobilized on the microchannel surface via Protein G. Only CD14 immobilization was illustrated and similar steps were followed for anti-flagellin and anti-LPS. (C) Detection of GFP-tagged E. coli on-chip. To validate the E. coli capture process, and quantify the on-chip concentration and capture efficiency of E. coli, these cells were identified under brightfield (100× magnification) and fluorescence microscopy. (i) Image of the control experiment without E. coli at 10× magnification under a fluorescence microscope. (ii) Image of the capture of GFP-tagged E. coli at 10× magnification under a fluorescence microscope. (iii) Image of the capture of GFP-tagged E. coli at 100× magnification under a fluorescence microscope. (iv) Image of the captured GFP-tagged E. coli at 100× magnification under bright field.
Abbreviations: DSA, double-sided adhesive film; E. coli, Escherichia coli; GFP, green fluorescent protein; LBP, lipopolysaccharide binding protein; LPS, lipopolysaccharide; PBS, phosphate buffered saline; PMMA, poly(methyl methacrylate); POC, point-of-care; GMBS, N-(gamma-maleimidobutyryloxy) succinimide
Strains used in studies: genetically modified E. coli
To validate the surface chemistry, a genetically modified E. coli strain expressing emerald green fluorescent protein (EmGFP) was used. The E. coli strain BL21 Star™, and EmGFP-expressing plasmid were purchased from Invitrogen (Carlsbad, CA). According to the manufacturer’s instructions, the pRSET/EmGFP plasmid, which confers ampicillin resistance and green fluorescence, (Invitrogen, catalog number V353–20) was transferred into BL21 Star™ by incubating at 41°C for 30 seconds and transferring onto ice. The transformed BL21 Star™ was then incubated at 37°C by shaking at 250 rpm for an hour in Super Optimal broth with catabolite repression medium. Following this step, BL21 Star™ was streaked onto Luria–Bertani (LB) agar plates containing 100 mg/mL of ampicillin, and then incubated at 37°C for 16 hours. An isolated E. coli colony was picked and inoculated in 5 mL of LB medium on another LB agar plate, with 100 mg/mL of ampicillin added. The E. coli culture was then incubated at 37°C with shaking at 250 rpm for 16 hours. The E. coli culture was then aliquoted, and used as a standard stock for all experiments. The E. coli stock was diluted ten-fold in PBS and spread on LB-ampicillin plates. After overnight incubation at 37°C, single colonies of E. coli were counted and the number was used to calculate the original concentration of the E. coli stock.
Surface chemistry
Two different surface chemistry methods were evaluated to immobilize antibodies for the highest capture efficiency of E. coli on chip (). Protein G is an immunoglobulin-binding protein and has the ability to immobilize the fragment crystallization (Fc) region of antibodies. NeutrAvidin has strong affinity for biotin-conjugated biomolecules (eg, biotinylated antibodies). In the first method, a biotinylated antibody was immobilized via NeutrAvidin-based surface chemistry.Citation18 Briefly, a glass slide was first plasma treated to make the surface more hydrophilic. 200 mM of 3-mercaptopropyl-trimethoxysilane (100 μL) dissolved in ethanol was then injected through the channels and incubated for 30 minutes at room temperature. 2 mM of N-(gamma-maleimidobutyryloxy) succinimide ester (GMBS; 100 μL) in ethanol, a cross linker of proteins to antibodies, was then incubated in microchannels for 35 minutes at ambient temperature. An ethanol wash of 300 μL was performed to remove the excess of untreated reagents after each incubation step. Before NeutrAvidin binding on the microchannels, 300 μL of PBS was used to wash out ethanol from the chip surface. 30 μL of NeutrAvidin solution (1 mg/mL in PBS) was incubated for 1 hour at room temperature before capture antibody immobilization. Three different experimental designs were performed for the NeutrAvidin studies. In the first design, 30 μL of biotinylated lipopolysaccharide (LPS) binding protein (LBP) Ab solution (5 μg/mL), (goat immunoglobulin G antibody, R&D Systems, Minneapolis, MN) was subsequently immobilized on the microchannel surface. Then, 30 μL of carrier-free recombinant human LBP (R&D Systems) at a concentration of 10 μg/mL was coated on the top of biotinylated anti-LBP antibody (anti-LBP-LBP). In the second design, the same process as performed in the first design was followed by the addition of 30 μL of bovine serum albumin (BSA) to block any remaining reactive spaces on the surface (anti-LBP-LBP-BSA). In the third design, first LBP was directly bound to GMBS to test the effect of protein orientation on E. coli capture, and then the BSA blocking step was performed after LBP binding (LBP-BSA). LBP was incubated in microchannels for 1 hour at room temperature.
In the second surface chemistry method, three nonbiotinylated antibodies (ie, anti-LPS antibody, cluster of differentiation 14 protein (CD14) of human monocyte and antiflagellin antibody) were immobilized onto microchannels via Protein G.Citation26 In this method, processing steps were same as the first method except for the use of Protein G instead of NeutrAvidin. The Protein G concentration used in the immobilization of alternate antibodies onto the surface was 1 mg/mL. Then 30 μL of 5 μg/mL anti-LPS antibody (Abcam, Cambridge, MA) was immobilized on the surface via Protein G. 30 μL of CD14 (Abcam, Cambridge, MA) was used at 5 μg/mL to capture E. coli by binding to LPS on E. coli surface. Movement of LPS monomers to a binding site on CD14 was catalyzed by LBP.Citation27,Citation28 Finally, 30 μL of antiflagellin antibody (BioLegend, San Diego, CA) was used at a concentration of 5 μg/mL to capture E. coli via the surface protein flagellin (part of flagellum).Citation29 These three capture agents were simultaneously incubated in microchannels for 1 hour at room temperature.
Sample preparation
EmGFP-expressing E. coli was spiked into 1 × PBS, blood, milk, and spinach samples with the final concentrations ranging from 50 to 4,000 colony forming units (CFUs) per milliliter for analysis on chip. Discarded de-identified whole blood (purchased from Research Blood Components, LLC, Cambridge, MA) was used in this study. Whole blood was spiked with E. coli and then inverted gently for 1 hour to enable homogenous distribution of E. coli. Spinach and milk samples were obtained from a local grocery store. Spinach leaves were washed and then spiked with E. coli before thorough mixing in a blender with 100 mL of sterile deionized H2O. The resultant mixture containing E. coli was filtered through a cell strainer (70 μM) to remove the residues of spinach leaves prior to microchip testing. Milk was spiked with E. coli and vortexed for 1 minute before testing.
Device operation and on-chip detection
To optimize the capture efficiency, 75 μL of EmGFP-expressing E. coli sample was pipetted into the functionalized microchannels, and then incubated at ambient temperature for 30 minutes. Following the incubation, microchannels were washed with 300 μL of PBS at a flow rate of 2 μL/minute using a syringe pump (Harvard Apparatus, Holliston, MA) for 150 minutes. For further optimization of processing time 2, 5, and 10 μL/minute wash was performed. After washing, captured E. coli was imaged using an inverted fluorescence microscope (Carl Zeiss, Thornwood, NY) through a GFP fluorescence filter (excitation wavelength 470 nm). For comparison, bright field and fluorescence images of E. coli taken under 10× and 100× magnification were merged (). The number of E. coli detected under 10× magnification using a GFP filter was counted manually.
Statistical analysis
To evaluate the effect of the capture agent on capture efficiency, we analyzed the experimental results (n = 2–6) using analysis of variance with Tukey’s post-hoc test for multiple comparisons with statistical significance threshold set at 0.05 (P < 0.05). To evaluate the effect of flow rate on capture efficiency, we analyzed the experimental results (n = 3–8) using nonparametric Kruskal–Wallis test followed by pair-wise comparisons with nonparametric upper-tailed Mann–Whitney U test, with statistical significance threshold set at 0.05 (P < 0.05). When nonparametric pair-wise tests were performed, Bonferroni correction was used for multiple comparisons. The agreement between chip counts and the E. coli stock concentrations in different media (PBS, blood, milk, spinach) was evaluated by calculating Pearson product-moment correlation coefficient (r) with statistical significance threshold set at 0.05 (P < 0.05). The Bland–Altman comparison analysis was used to evaluate the repeatability of the chip counts using residual analysis in comparison to E. coli stock concentrations. The coefficient of repeatability was calculated as 1.96 times the standard deviations of the differences between chip measurements and E. coli stock concentrations. In the Bland–Altman analysis, a mean difference of zero indicates that the chip measurement is unbiased with respect to the standard. A clinically acceptable range indicates the interval within which the difference would fall approximately 95% of the time. If the mean difference and the limit of agreement are within the clinically acceptable range, then the developed measurement method is deemed comparable to the standard. Statistical analyses were performed with Minitab (Release 14; Minitab Inc, State College, PA).
Results and discussion
We engineered the surface chemistry using immobilized antibodies, where the performance of the chip relies on nanoscale reactions on the microchannel surface. We evaluated antibodies specific to E. coli surface proteins using commonly reported antibody immobilization methods that provide a uniform distribution of antibodies on the capture surface in microfluidic channels, ie, Protein G and NeutrAvidin based methods. To develop a rapid microchip method for E. coli detection, four different capturing agents were immobilized in microchannels via these two surface chemistry methods. As shown in , anti-LPS, antiflagellin, and CD14 were immobilized on the microchannel surface via Protein G and anti-LBP antibody was immobilized on the microchannel surface via NeutrAvidin. To investigate the binding of anti-LBP antibody, and to observe the effect of antibody orientation on E. coli capture. Three different experimental designs were performed. In NeutrAvidin experiments, capture efficiencies of anti-LBP-LBP, anti-LBP-LBP-BSA, and LBP-BSA were observed to be 71.8% ± 5%, 60.7% ± 2%, and 44.5% ± 5%, respectively (). In comparison, E. coli capture efficiencies of antiflagellin, anti-LPS and CD14 obtained by using Protein G based surface chemistry, were 46.9% ± 3%, 41.5% ± 5%, and 41.0% ± 2%, respectively (). The capture efficiency via anti-LBP-LBP was observed to be significantly greater (P < 0.05) than the other capture agents that were used with Protein G based surface chemistry (). In our prior study, Protein G and NeutrAvidin exhibited similar efficiency to immobilize capture agents on microchannel surfaces.Citation26 Thus, the difference in capture efficiency of E. coli was mainly due to the affinity of capture agents, ie, anti-LPS, antiflagellin, CD14, and LBP. The highest capture efficiency (71.8% ± 5%) was observed in microchannels immobilized with anti-LBP in the presence of LBP. This observation is in accordance with a previous report, in which LBP was shown to bind E. coli with high affinity; anti-LBP antibody helped the protein to take favorable orientation for E. coli capture.Citation27 BSA blocking was used to prevent nonspecific binding in microchannels in addition to preventing the binding of anti-LBP antibodies and LBP onto the succinimide group of GMBS. The use of BSA as a blocking agent did not result in a statistically significant difference in capture efficiency with both anti-LBP-LBP and anti-LBP-LBP-BSA. The LBP-BSA experiment showed that the orientation of the LBP protein is critical to capture of E. coli, which was supported by statistical analysis of experimental results as shown in . As an overall result, NeutrAvidin- mediated anti-LBP antibody-LBP immobilization performed on the microchannel surface to attain high capture efficiency of E. coli.
Figure 3 Comparison of the capture efficiency of E. coli by two different surface chemistries and different capturing agents. E. coli were incubated at room temperature for 1 hour. (A) Three different experimental designs (anti-LBP-LBP, anti-LBP-LBP-BSA, and LBP-BSA) were performed on NeutrAvidin based surface chemistry. Three different capture agents were immobilized via Protein G based surface chemistry. The wash flow rate was 2 μL/min. Brackets connecting individual groups indicate statistically significant difference (analysis of Variance with Tukey’s post-hoc test for multiple comparisons, n = 2–6, P < 0.05). (B) Effect of channel flow rate on capture efficiency of E. coli on chip. 75 μL of E. coli was flowed into microchannels. After sample incubation for 15 min at ambient temperature, three different wash flow rates (2, 5, and 10 μL/min) were used to optimize the capture efficiency of E. coli on chip. Statistical analysis indicated that flow rate had a significant effect on capture efficiency (nonparametric Kruskal–Wallis test), where 2 μL/min resulted in significantly greater (P < 0.05) capture efficiency compared to 10 μL/min flow rate. Brackets connecting individual groups indicate statistically significant difference. Data are presented as average ± SEM. Non-parametric upper-tailed Mann–Whitney U test for pair-wise comparisons, n = 3–8, P < 0.05.
Abbreviations: BSA, bovine serum albumin; E. coli, Escherichia coli; LBP, lipopolysaccharide binding protein; SEM, standard error of the mean.
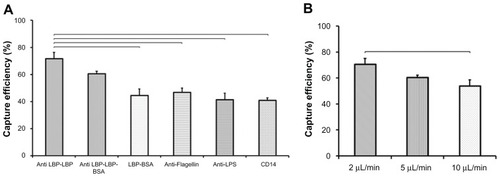
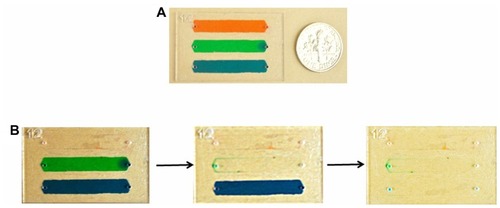
By investigating the effects of washing flow rate on E. coli capture efficiency, anti-LBP antibody based surface chemistry was further optimized. At the flow rates of 2, 5, and 10 μL/min, capture efficiencies were 70.7% ± 4%, 60.5% ± 3%, and 53.9% ± 8%, respectively (). Statistical analysis on experimental results indicated that flow rate had a significant effect on capture efficiency (nonparametric Kruskal–Wallis test), where 2 μL/min resulted in significantly greater (P < 0.05) capture efficiency compared to 10 μL/min. The lower efficiency observed at higher flow rates may be related to the correspondingly higher shear stress within the microchannels. Additionally, we used food dyes to visualize and qualitatively analyze the wash steps in microchannels. We observed that the selected flow rate (2 μL/min) achieved effective removal of food dye solution from microchannels ().
Figure 4 (A) Three different food dye solutions were injected into microchannels before performing wash steps. (B) Images of channels before and after wash steps indicated that food dye was removed from microchannels at a flow rate of 2 μL/minute.
To determine the microchip’s limit of detection for E. coli capture, we used LB agar plate culture as the gold standard for E. coli detection. We correlated agar plate results for a series of known concentrations of E. coli with the microchip capture results. E. coli concentration and microchip-based E. coli detection showed a positive correlation for E. coli concentrations ranging from 50 to 4,000 CFUs/mL (). The linearity of the correlation indicates that microchip-based E. coli detection can be used as an alternative to agar plate culture.
Figure 5 Correlation of E. coli quantification by microchip and LB plating. This experiment was performed to establish the correlation between bacteria cell counts obtained by colony count from LB agar plates and cell count after capture on a microfluidic device (A, C, E and G). Bland–Altman analysis between the microchip count and E. coli stock concentrations did not display an evidence for a systematic bias for chip counts. (A) 75 μL of varying concentrations (up to 500 CFUs/mL) of E. coli spiked in PBS was injected into microchannels functionalized with anti-LBP antibody. For comparison, 75 μL of each concentration of E. coli was plated out on ampicillin containing LB agar plates and incubated overnight. The number of E. coli colonies was counted the next day and compared to the E. coli counted on chip. The detection limit of microchip was found as 50 CFUs/mL. Data are presented as average ± SEM (n = 3) (r = 0.960, P = 0.009). (B) The mean bias for E. coli spiked in PBS was −70 CFUs/mL sample in microchip counts compared to E. coli stock concentrations. (C) Varying concentrations (up to 400 CFUs/mL) of E. coli spiked in blood were injected into microchannels functionalized with anti-LBP antibody and the detection limit of microchip was found as 50 CFUs/mL (r = 0.989, P = 0.011). (D) The mean bias was −165 CFUs/mL of blood in microchip counts compared to E. coli stock concentrations. (E) Varying concentrations (up to 400 CFUs/mL) of E. coli spiked in milk were injected into microchannels functionalized with anti-LBP antibody and the detection limit of microchip was found as 50 CFUs/mL (r = 0.962, P = 0.038). (F) The mean bias was −163 CFUs/mL of milk in microchip counts compared to E. coli stock concentrations. (G) Varying concentrations (up to 4,000 CFUs/mL) of E. coli spiked in spinach were injected into microchannels functionalized with anti-LBP antibody and the detection limit of microchip was found as 500 CFUs/mL (r = 0.977, P = 0.023). (H) The mean bias was −1869 CFUs/mL of spinach sample in microchip counts compared to E. coli stock concentrations. (“r” indicates Pearson product-moment correlation coefficient, “P” indicates the statistical significance of correlation).
Abbreviations: CFU, colony forming unit; E. coli, Escherichia coli; LB, Luria–Bertani; LBP, lipopolysaccharide binding protein; SD, standard deviation; SEM, standard error of the mean.
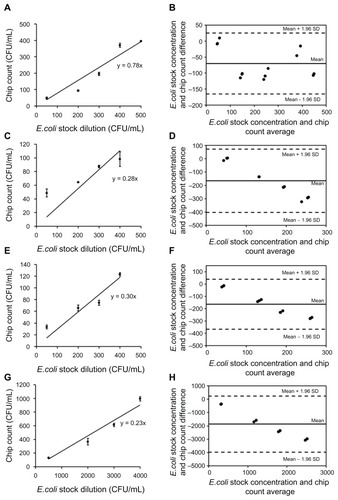
shows a sensitivity of 50 CFUs/mL that was obtained by the microchip count in PBS. Various sample types including blood, milk, and spinach, were used for rapid on-chip detection of E. coli (). The detection limits of E. coli in blood, milk, and spinach samples were observed to be 50, 50, and 500 CFUs/mL as compared to E. coli dilution count, respectively. According to Bland–Altman analysis, the mean biases were −70 CFUs/mL, −165 CFUs/mL, −163 CFUs/mL, and −1869 CFUs/ mL for PBS (50 to 500 CFUs/mL), blood (50 to 500 CFUs/ mL), milk (50 to 500 CFUs/mL), and spinach (500 to 4,000 CFUs/mL) samples, respectively (). Compared to E. coli spiked in PBS, the capture efficiency and limit of detection slightly decreased in other samples due to the immunological and enzymatic components in blood, milk, and spinach. For instance, there is a significant amount of albumin present in blood; this is commonly used as a blocking agent in immunoassays, and as such may have had a similar effect on our experiment. Milk also tends to have excessive albumin, casein, and other proteins, which may cause further blocking of the antigen-antibody binding. As the data show, these blocking and enzymatic agents can affect the capture efficiency. E. coli detection in spinach samples showed higher limit-of-detection than milk and blood experiments, potentially due to this experiment requiring preprocessing steps to remove the residuals of spinach leaves prior to microchip testing. Preprocessing steps (eg, filtering) caused a loss in E. coli cells before detection. On the other hand, the presented microchip assay achieved a lower detection limit for similar assays than was previously reported by methods such as magnetic separation method, fluorescence staining, and electrical detection (104 CFUs/mL and 8 × 10⁴ CFUs/mL, respectively).Citation30,Citation31 Since nucleic acid-based-detection methods require more extensive sample preprocessing, antibody based E. coli detection on a chip presents a simpler alternative method to nucleic acid-based amplification assays on a chip.Citation32,Citation33 The current culture-based systems are subject to giving false negatives since only a small sample can be cultured compared to the whole sample volume, eg, 0.1% of the total blood volume is cultured in sepsis patients. This leads to 7.2 to 21.2% of such cultures providing false negatives.Citation10,Citation11 With the microchip system, larger sample sizes can be processed by continuous flow, giving results much faster than a culture system. The sample can also be reprocessed within either the same or new microchannels; this would be expected to increase the number of pathogens captured from a single sample. However, for detection purposes, this would be not necessary granted that accurate detection results are provided by the chip. Capturing larger numbers of pathogens can be beneficial for other applications such as culturing and downstream genomic analysis.
In this study, we used E. coli as a model pathogen because E. coli have been extensively characterized, and as such it provides simple comparison to existing systems. We transformed BL21 Star™ with EmGFP-expressing plasmid and developed a microfluidic device to rapidly capture and quantify E. coli from various biological samples. The GFP-expressing E. coli was used to facilitate the quantification steps. The bacteria can be visualized either under a microscope in a laboratory setting, or for rapid counts in POC settings, with wide field of view lensless imaging systems for rapid counts for POC settings.Citation20,Citation24,Citation25,Citation34 Also, for characterization of E. coli capture from various biological samples, we employed a GFP-expressing strain for ease of detection under a fluorescence microscope. The extension from a GFP-expressing strain to wild-type strains can be simply achieved using an ELISA-based detection method, as previously reported.Citation35 The characterized microchip can be coupled with POC detection technologies such as surface plasmon resonance,Citation36–Citation38 on-chip ELISA,Citation39 and lensless imagingCitation20,Citation24 to achieve POC testing without reference to laboratory equipment. Additionally, the presented microfluidic approach can be adapted to detect other microorganisms that cause sepsis such as Gram-negative bacteria (E. coli, Klebsiella, Pseudomonas, Enterobacter, and Hemophilus species) and Gram-positive bacteria (Staphylococcus, Streptococcus, and Enterococcus species).Citation40 Also, the current material cost, without the labor and other costs of the microchip, includes 10¢ of glass, 1¢ of PMMA, and 70¢ of antibodies. The antibody cost could be lowered with large-scale production and ordering.
In conclusion, we presented a microfluidic immunoassay to capture E. coli from blood, milk and spinach samples. This microchip enables rapid detection of bacteria in blood samples and food supply. The technology can be potentially adapted for on-site real-time food quality monitoring and for diagnosis of sepsis at the POC.
Acknowledgments
This work was made possible by a research grant that was awarded and administered by the US Army Medical Research and Materiel Command and the Telemedicine and Advanced Technology Research Center, at Fort Detrick, MD. We thank Drs Paul Nisson and John Carney for their feedback and productive discussions on the project. We would also like to thank Mr Noah MacCallum for his feedback.
Disclosure
The authors report no conflicts of interest in this work.
References
- SchlichtingDMcCollamJSRecognizing and managing severe sepsis: a common and deadly threatSouth Med J2007100659460017591313
- RangelJMSparlingPHCroweCGriffinPMSwerdlowDLEpidemiology of Escherichia coli O157:H7 outbreaks, United States, 1982—2002Emerg Infect Dis200511460360915829201
- CrutchfieldSRobertsTFoodReview: The 1990’s: a dynamic decade for the U.S. food systemFood Review Archives2000233
- FrankCWerberDCramerJPEpidemic profile of Shiga-toxin-producing Escherichia coli O104:H4 outbreak in GermanyN Engl J Med2011365191771178021696328
- MartinGSManninoDMEatonSMossMThe epidemiology of sepsis in the United States from 1979 through 2000N Engl J Med2003348161546155412700374
- WisplinghoffHBischoffTTallentSMSeifertHWenzelRPEdmondMBNosocomial bloodstream infections in US hospitals: analysis of 24,179 cases from a prospective nationwide surveillance studyClin Infect Dis200439330931715306996
- ZhaoCWGeBLDe VillenaJPrevalence of Campylobacter spp, Escherichia coli, and Salmonella serovars in retail chicken, turkey, pork, and beef from the Greater Washington DC, areaAppl Environ Microbiol200167125431543611722889
- RodgersGLMortensenJFisherMCPredictors of infectious complications after burn injuries in childrenPediatr Infect Dis J2000191099099511055602
- KeenEFIIIRobinsonBJHospenthalDRIncidence and bacteriology of burn infections at a military burn centerBurns201036446146820045259
- FanSTTeoh-ChanCHLauKFEvaluation of central venous catheter sepsis by differential quantitative blood cultureEur J Clin Microbiol Infect Dis1989821421442498096
- QuiliciNAudibertGConroyMCDifferential quantitative blood cultures in the diagnosis of catheter-related sepsis in intensive care unitsClin Infect Dis1997255106610709402359
- MukkurTKBradleyREDifferentiation of avian thrombocytes from leukocytes by use of Giemsa’s stainPoult Sci1967466159515964170312
- SandersonMWSreeramaSNagarajaTGSensitivity of direct plating for detection of high levels of E. coli O157:H7 in bovine fecal samplesCurr Microbiol200755215816117624573
- JordanJADursoMBReal-time polymerase chain reaction for detecting bacterial DNA directly from blood of neonates being evaluated for sepsisJ Mol Diagn20057557558116258155
- WangSXuFDemirciUAdvances in developing HIV-1 viral load assays for resource-limited settingsBiotechnol Adv201028677078120600784
- ChengXIrimiaDDixonMA microfluidic device for practical label-free CD4(+) T cell counting of HIV-infected subjectsLab Chip20077217017817268618
- ChengXIrimiaDDixonMA microchip approach for practical label-free CD4+ T-cell counting of HIV-infected subjects in resource-poor settingsJ Acquir Immune Defic Syndr200745325726117414933
- KimYGMoonSKuritzkesDRDemirciUQuantum dot-based HIV capture and imaging in a microfluidic channelBiosens Bioelectron200925125325819665685
- LeeWGKimYGChungBGDemirciUKhademhosseiniANano/microfluidics for diagnosis of infectious diseases in developing countriesAdv Drug Deliv Rev2010624–544945719954755
- MoonSKelesHOOzcanAIntegrating microfluidics and lensless imaging for point-of-care testingBiosens Bioelectron200924113208321419467854
- MahalanabisMAl-MuayadHKulinskiMDAltmanDKlapperichCMCell lysis and DNA extraction of gram-positive gram-negative bateria from whole blood in a disposible microfluidic chipLab Chip200992811281719967118
- BennettARMacPheeSBettsRPThe isolation and detection of Escherichia coli O157 by use of immunomagnetic separation and immunoassay proceduresLett Appl Microbiol19962232372438852353
- OnoueYKonumaHNakagawaHHara-KudoYFujitaTKumagaiSCollaborative evaluation of detection methods for Escherichia coli O157:H7 from radish sprouts and ground beefInt J Food Microbiol1999461273610050682
- MoonSGurkanUABlanderJEnumeration of CD4 T-Cells Using a Portable Microchip Count Platform in Tanzanian HIV-Infected PatientsPLoS One201167e2140921754988
- AlyassinMAMoonSKelesHORapid automated cell quantification on HIV microfluidic devicesLab Chip20099233364336919904402
- WangSQEsfahaniMGurkanUAInciFKuritzkesDRDemirciUEfficient on-chip isolation of HIV subtypesLab Chip20121281508151522391989
- HailmanELichensteinHSWurfelMMLipopolysaccharide (LPS)-binding protein accelerates the binding of LPS to CD14J Exp Med199417912692777505800
- YuBHailmanEWrightSDLipopolysaccharide binding protein and soluble CD14 catalyze exchange of phospholipidsJ Clin Invest19979923153249006000
- MolloyMPHerbertBRSladeMBProteomic analysis of the Escherichia coli outer membraneEur J Biochem2000267102871288110806384
- YangLLiYSimultaneous detection of Escherichia coli O157:H7 and Salmonella Typhimurium using quantum dots as fluorescence labelsAnalyst2006131339440116496048
- VarshneyMLiYBSrinivasanBTungSA label-free, microfluidics and interdigitated array microelectrode-based impedance biosensor in combination with nanoparticles immunoseparation for detection of Escherichia coli O157:H7 in food samplesSens Actuators B Chem2007128199107
- MahalanabisMDoJAlmuayadHZhangJYKlapperichCMAn integrated disposable device for DNA extraction and helicase dependent amplificationBiomed Microdevices201012235335920066496
- MinJKimJHLeeYFunctional integration of DNA purification and concentration into a real time micro-PCR chipLab Chip201111225926520967380
- GurkanUAMoonSGeckilHMiniaturized lensless imaging systems for cell and microorganism visualization in point-of-care testingBiotechnol J20116213814921298800
- NekhotiaevaNAwasthiSKNielsenPEGoodLInhibition of Staphylococcus aureus gene expression and growth using antisense Peptide nucleic acidsMol Ther200410465265915451449
- FernandezFHegnerovaKPiliarikMSanchez-BaezaFHomolaJMarcoMPA label-free and portable multichannel surface plasmon resonance immunosensor for on site analysis of antibiotics in milk samplesBiosens Bioelectron20102641231123820637590
- ChinowskyTMSoelbergSDBakerPPortable 24-analyte surface plasmon resonance instruments for rapid, versatile biodetectionBiosens Bioelectron2007229–102268227517223032
- TurkerBGunerHAyasSGrating coupler integrated photodiodes for plasmon resonance based sensingLab Chip201111228228721031227
- WangSZhaoXKhimjiIIntegration of cell phone imaging with microchip ELISA to detect ovarian cancer HE4 biomarker in urine at the point-of-careLab Chip201111203411341821881677
- MahalanabisMAl-MuayadHKulinskiMDAltmanDKlapperichCMCell lysis and DNA extraction of gram-positive and gram-negative bacteria from whole blood in a disposable microfluidic chipLab Chip200991928112817 Epub December 8, 200910.1039/b905065p19967118