 ?Mathematical formulae have been encoded as MathML and are displayed in this HTML version using MathJax in order to improve their display. Uncheck the box to turn MathJax off. This feature requires Javascript. Click on a formula to zoom.
Abstract
The reported work demonstrates and discusses the effect of supercritical fluid density (pressure and temperature of supercritical fluid carbon dioxide) on particle size and distribution using the supercritical antisolvent (SAS) method in the purpose of drug encapsulation. In this study, paracetamol was encapsulated inside L-polylactic acid, a semicrystalline polymer, with different process parameters, including pressure and temperature, using the SAS process. The morphology and particle size of the prepared nanoparticles were determined by scanning electron microscopy and transmission electron microscopy. The results revealed that increasing temperature enhanced mean particle size due to the plasticizing effect. Furthermore, increasing pressure enhanced molecular interaction and solubility; thus, particle size was reduced. Transmission electron microscopy images defined the internal structure of nanoparticles. Thermal characteristics of nanoparticles were also investigated via differential scanning calorimetry. Furthermore, X-ray diffraction pattern revealed the changes in crystallinity structure during the SAS process. In vitro drug release analysis determined the sustained release of paracetamol in over 4 weeks.
Introduction
The use of supercritical fluid (SCF) is an effective and clean method in the production of encapsulated particles. The pressure and temperature of SCF are greater than its critical pressure and temperature while it remains as a single phase. The SCF techniques modify the particle size, distribution, and morphology. The major advantage of supercritical antisolvent (SAS) techniques is that the solvent can be efficiently removed. Furthermore, it is a single-step process and a clean and effective method for nanoencapsulation, and the mild operation temperature avoids thermal degradation. Supercritical solvation power can be readily controlled by adjusting either temperature or pressure; thus, it can be used for selective crystallization and control of particle morphology or crystalline forms.Citation1–Citation3
The conventional processes for encapsulation such as milling, solvent evaporation and spray drying cannot produce fine and pure particles. Particles that are produced by milling method have a large distribution range. Solvent/emulsion evaporation techniques cannot completely remove solvent from the particles, and the spray drying process can thermally denaturate compounds.Citation4
During the SAS processes, the mass transfer between SCF and solution happens very quickly because of very high diffusion of SCF in the solution, which results in the expansion of solution. Therefore, the solubility power is decreased, and a supersaturated solution results in precipitation.
The density of SCF affects mass transfer between organic solvent and SCF during precipitation. The density of SCF depends on the temperature and pressure values of the fluid.Citation5–Citation8 This work has studied the effect of temperature and pressure on particle size and distribution produced by the SAS process.
SAS precipitation description should include important contributions from precipitation kinetics, thermodynamics, and fluid dynamics. Furthermore, study of phase behavior is key in this area.
Materials and methods
Poly-L-lactic acid used in this study (inherent viscosity 2.0 dL/g, as reported by the supplier), as the biodegradable polymer, was obtained from Sigma-Aldrich (St, Louis, MO). Paracetamol (99.9%) was obtained from the Faculty of Medicine and Health Science, UPM, Malaysia. Methylene chloride (purity 99.8%) high-performance liquid chromatography grade, as solvent for biodegradable polymer, was obtained from Sigma-Aldrich. Acetone (purity 99.8%) high-performance liquid chromatography grade, as solvent for paracetamol, was obtained from Fisher Scientific (Loughborough, UK). Purified grade carbon dioxide (CO2) was used as the SCF.
Preparation of nanoparticles
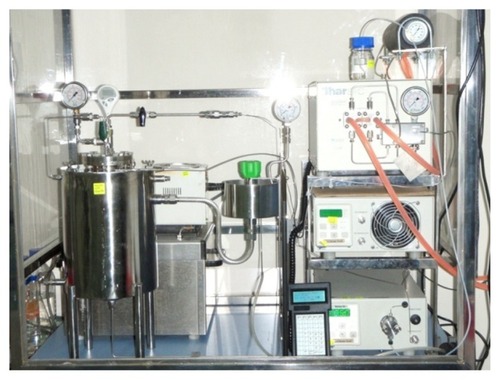
The SAS apparatus consisted of a high-pressure pump (Thar SCF P-50A) and a metering pump (Chrom Tec Series III) used to deliver the supercritical CO2 and feed solution, respectively. During the SAS process, supercritical CO2 fluid diffused and evaporated in the gas phase. Therefore, the density of the solvent decreased and precipitation occurred. The very fast mass transfer between the liquid phase and SCF reduced the surface tension and controlled droplet shape. A stainless steel cylindrical vessel of 490 mL was used as a precipitation chamber. The liquid solution (composed of poly-L-lactic acid and paracetamol [2:1] dissolved in the mixture solvent of dichloromethane and acetone [7:4]) was delivered to the precipitation chamber with a constant flow rate equal to 1.75 mL/minute through a 2 μm diameter stainless steel nozzle. A chiller (Thermo Scientific) and a heat exchanger were used to liquify CO2 from a gas cylinder when the chiller temperature dropped to 3°C and the CO2 was delivered through another inlet port located on the top of the precipitator. The temperature of precipitation chamber was controlled using a water bath in the varied range equal to 30°C, 35°C, 40°C, 45°C, 50°C, and 55°C. The pressure of the precipitator was regulated by a micrometering valve located at the exit of the chamber in the varied range equal to 80 bar, 90 bar, 100 bar, 110 bar, and 120 bar. The produced particles were collected in the precipitator chamber. The SAS apparatus is shown in .
Figure 1 Equipment set-up used in this study for supercritical antisolvent system.
Observation and characterization
Scanning electron microscopy
Scanning electron microscopy (SEM) (Hitachi S-3400 N) was used to characterize the morphology and particle size of the nanoencapsulated particles. The sample was adhered to the adhesive carbon tape on an aluminum stub and coated with gold-palladium. The morphology of the samples was characterized using SEM, and images were taken from a variety of areas of the samples on the stub. Particle size and their distributions were determined using the UTHSCSA Image Tool software, Version 3.00 program, based on the SEM micrographs. More than 500 particles from each sample were taken for image processing.
Transmission electron microscopy
Transmission electron microscopy (TEM) (LEO 912AB) was used to characterize the internal structure of nanoencapsulated particles. One drop of sample was placed on a copper grid and dried. Then, the copper grid was scanned with TEM for investigation of the internal structure.
Energy dispersive X-ray spectroscopy
Element compositions were investigated using a NORAN SYSTEM 6.0 (Thermo Scientific). It was followed with an acquisition time of approximately 5 minutes at 20 KV.
Differential scanning calorimetry
A weighted sample more than 5 mg was collected in an aluminum pan (Al-Crucibles 40 μL) and sealed completely. The system was purged with nitrogen (gas control Ts0800GC1) to prevent oxidation or other undesired reactions. The analysis of samples was performed in the temperature range of 0°C–200°C at the rate of 2°C/min.
X-ray diffraction pattern
The X-ray diffractograms were recorded by Shimadzo XRD-6000 equipment with Ni-filtered Cu-Kα radiation. The operating conditions were 20 mA and 40 KV at room temperature. The X-ray diffractograms were recorded with the scan rate of 4 s/step and step width 0.05°.
In vitro drug release
A total of 25 mg of nanoparticles was placed into 50 mL of phosphate buffered saline (PBS) (pH 7.4) containing 0.025% sodium azide. The sample was placed in a shaking incubator maintained at 50 rpm and 37°C. The paracetamol released into the medium PBS was analyzed using an ultraviolet-visible spectrometer (Shimadzu Model 1650-PC, Japan).
Results and discussion
Particle size, morphology, and internal structure of nanoparticles
SEM micrographs of products produced in the temperature below 45°C show fine spherical particles with all different pressures. By increasing the temperature and thus decreasing the density, the particle size increases due to the plasticizing effect. Supercritical CO2 decreases the glass transition temperature of biodegradable polymers, acting like a plasticizer. Therefore, the polymer with a low glass transition temperature tends to form sticky and aggregated particles.Citation9,Citation10 At temperatures higher than 45°C, which is near the glass transition temperature of polymers, the particles are agglomerated, and large and nonspherical particles are formed.Citation11 The glass transition temperature of some polymers may be decreased after contact with SCF due to taking the place of CO2 for a very short time because of intermolecular interaction between the biodegradable polymer and dissolved SCF.Citation12 The effect of temperature on particle size and their morphology at 120 bar is shown in . The same results occur with other pressures ().
Figure 2 Scanning electron microscopy micrographs of nanoencapsulated paracetamol inside L-polylactic acid at 120 bar and different temperatures: (A) 30°C, (B) 35°C, (C) 40°C, D) 45°C, (E) 50°C, (F) 55°C.
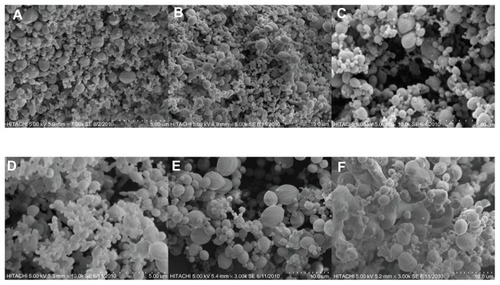
Figure 3 Effect of temperature on particle size.
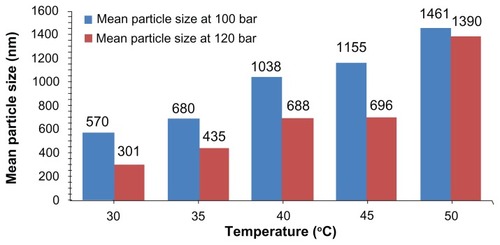
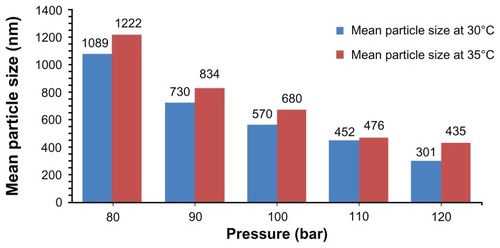
Also, the particles size is reduced through pressure enhancement. In fact, the solubility of solute in the supercritical CO2 depends on the density. Density increment enhances the molecular interaction and thus the solubility. The effect of density on solubility is more considerable at higher densities.Citation13
SEM micrographs of products in different pressures at 30°C are shown in . The same results occur with other pressures ().
Figure 4 Scanning electron microscopy micrographs of nanoencapsulated paracetamol inside L-polylactic acid at 30ºC and different pressures: (A) 80 bar, (B) 90 bar, (C) 100 bar, (D) 110 bar (E) 120 bar.
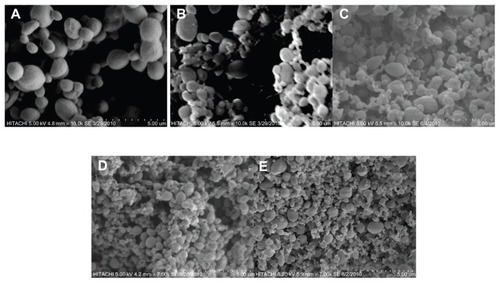
Figure 5 Effect of pressure on particle size.
Other important factors in respect of particle size are nucleation process and rapid mass transfer of antisolvent and solvent leading to high supersaturations for the solute, which results in rapid nucleation and growth of more than one particle per primary droplet.Citation13,Citation14
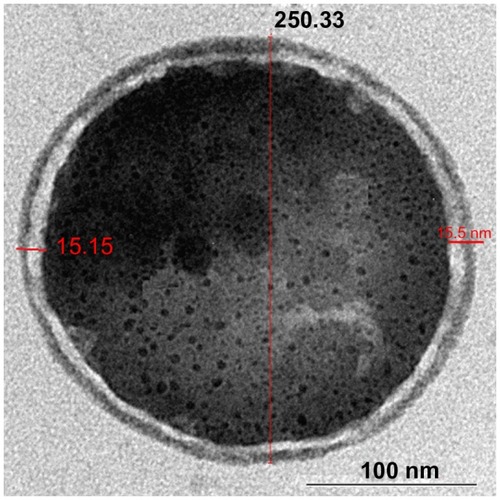
The TEM images revealed the encapsulation of paracetamol inside biodegradable polymer, as shown in .
Figure 6 Internal structure of nanoparticles.
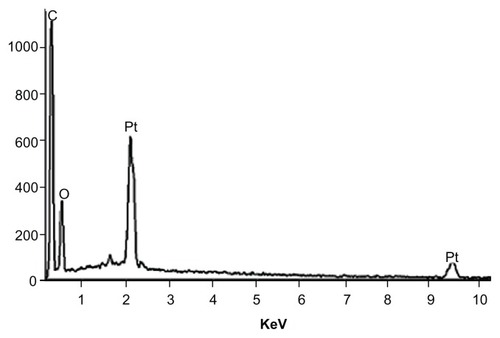
In order to control the washing step, energy dispersive X-ray spectroscopy characterization was carried out (). During the observation with SEM, the electron beams were directed toward the sample and emitted X-rays were examined. The position of X-ray peaks reveals the elements available in the sample. No peaks related to chlorine arising from Di-chloromethan (methylene chloride) solvent in the spectrum of sample were detected. Therefore, the methylene chloride solvent was completely removed from products during the washing step.
Figure 7 Energy dispersive X-ray spectroscopy of nanoparticles revealed the completed washing step.
Structure of nanoparticles
Based on the diffraction patterns, it is distinguished that the based peak of nanoparticle crystallographs are equal to pure polymer (16.64°) due to the higher ratio of polymer over paracetamol in the initial solute (). Furthermore, the crystallinity structure changes during the SAS process due to the very fast mass transfer during the SAS process and produces particles that precipitate very quickly. Therefore, there is not sufficient time to produce particles in the crystal structure. The change in crystallinity is observed on both the X-ray diffraction pattern () and differential scanning calorimetry (DSC) thermograms (). The intensity of crystallinity peaks of nanoencapsulated particles obviously reduced in DSC thermograms. Based on the surface area of exothermal peak and endothermal peak, the percentage of crystallinity in this polymer can be distinguished. In the crystalline phase of polymer, the atoms are arranged regularly; thus, it absorbed a huge energy to break the crystalline structure, but during the melting process the energy was released. The degree of crystallinity is obtained as follows:
Figure 8 X-ray diffraction pattern of pure L-polylactic acid (L-PLA), pure paracetamol, and encapsulated paracetamol inside L-PLA.
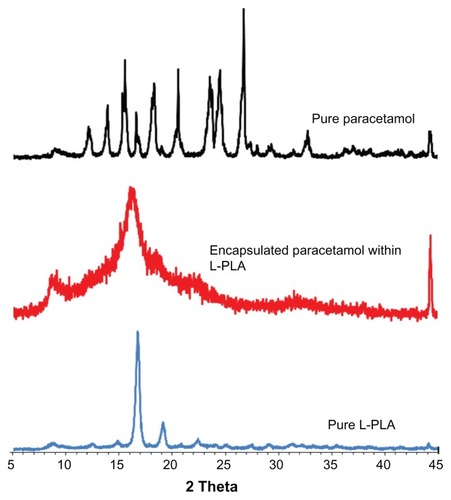
Figure 9 The comparison of melting point and crystallinity of pure L-polylactic acid and nanoparticles produced in different conditions.
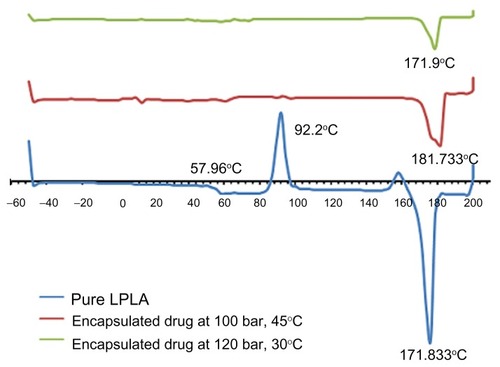
where ΔHm is the enthalpy of fusion and is determined by the area integration of the melting peak (71.18 J/gr), ΔHc is the heat of crystallinity and is determined by the area integration of the crystallinity peak (30.24 J/gr), and ΔHm0 is the enthalpy of fusion of the completely crystalline material or corresponds to an infinite thickness of crystal equal to 81.3 J/gr. The crystallinity of pure polymer is equal to 50.35% based on the DSC thermogram.
In vitro drug release analysis
Sustained release of paracetamol in PBS buffer was investigated over 4 weeks. The first burst happened after 1 week and the cumulative paracetamol release versus time is shown in . The kinetic of releasing is fitted with a zero-order model based on R-square (92.2%). The zero-order kinetic model EquationEq (2)(2) , shows that the drug release rate is independent of its concentration:Citation15
Figure 10 In vitro release profile of paracetamol encapsulated in L-polylactic acid based on the zero-order model.
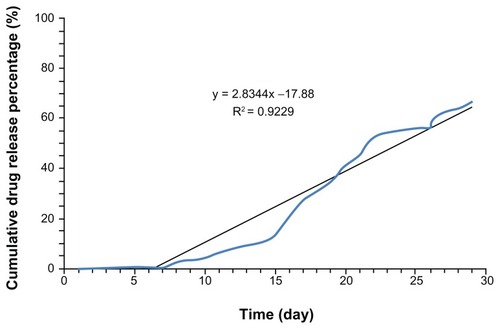
where K is zero-order rate constant expressed and t is the time.
Conclusion
The antisolvent SCF process is a suitable process for pharmaceutical application, and it is possible to control the particle size and its distribution and the shapes and structure of particles in a wide range by adjusting the process parameter and choosing a suitable biodegradable polymer.Citation16 For the SAS process the ternary system is shown in .
Figure 11 Ternary system for the supercritical antisolvent method.
Note: Reprinted from Yulu W, Dave RN, Pfeffer R. Polymer coating/encapsulation of nanoparticles using a supercritical anti-solvent process. J Supercrit Fluids. 2004;28:85–99, Copyright 2004, with permission from Elsevier Limited.Citation18
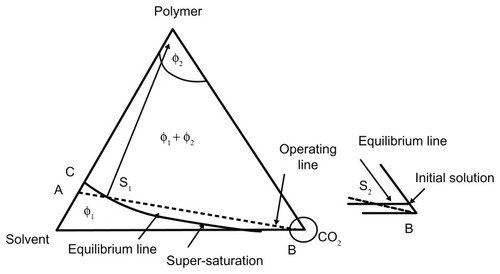
According to this diagram, φ1 is the one-phase region in which the biodegradable polymer dissolves in the solvent. In this region, CO2 may also dissolve in the solution. The φ2 region shows the glassy region, which is a polymer-rich phase. In this region the limited amount of solvent and CO2 makes a solution with polymer. In the two-phase regions (φ1+ φ2), both a solvent-rich phase and a polymer-rich phase exist and are in equilibrium. The curve line from point C to point B shows the polymer solubility in both solvent and SCFs. The polymer solute feeding to SCF is shown with a straight line. By adding the solution to supercritical CO2 fluid (ScCO2), the small amount of the solute dissolves in the ScCO2 (in φ1 region); the process continues until the saturation point of the solute in the mixture of the solvent and ScCO2, the supersaturation point, is reached. Finally, by adding more solute into the SCF, the supersaturation and then the phase transition will take place.
The process conditions during solute spraying can change the properties of biodegradable polymer such as viscosity; thus, the precipitation occurs. It is crucial that the precipitation rate be lower than the atomization rate to produce desirable particle sizes and morphology. In addition, the biodegradable polymer must precipitate during spraying due to avoiding polymeric droplet production and agglomeration.Citation13,Citation17 Increasing the density enhances the molecular interaction and thus the solubility, and this effect is even more sensitive at higher densities. To sum up, this study realized that increasing pressure and decreasing temperature can improve particle size and morphology. Furthermore, it is distinguished that crystallinity structure changes during the SAS process. The nanoparticles showed very slow drug release in a buffer solution.
Disclosure
The authors report no conflicts of interest in this work.
References
- BristowSShekunovTYuBYorkPAnalysis of the supersaturation and precipitation process with supercritical CO2J Supercrit Fluids200121257271
- ByrappaKOharaSAdschiriTNanoparticles synthesis using supercritical fluid technology – towards biomedical applicationsAdv Drug Deliv Rev20086029932718192071
- KikicIVecchioneFSupercritical impregnation of polymersCurrent Opinion in Solid State and Materials Science20037399405
- RantakylMJnittiMAaltonenOHurmeMThe effect of initial drop size on particle size in the supercritical anti-solvent precipitation (SAS) techniqueJ Supercrit Fluids200224251263
- SpasićAMFinely Dispersed Particles: Micro-, Nano-, and Atto-EngineeringNew YorkTaylor and Francis2006
- YuBShekunovTBaldygaJYorkPParticle formation by mixing with supercritical anti-solvent at high Reynolds numbersChem Eng Sci20015624212433
- Sze TuLDehghaniFFosterNRMicronisation and microencapsulation of pharmaceuticals using a carbon dioxide anti-solventPowder Technology2002126134149
- GuptaRBNanoparticle Technology for Drug Delivery. Drugs and the Pharmaceutical SciencesNew YorkTaylor and Francis Group2006
- KikicIVecchioneFSupercritical impregnation of polymersCurr Opin Solid State Mater Sci20037399405
- KawashimaYDrug delivery applications of supercritical fluid technologyAdv Drug Deliv20082
- ReverchonEAntonacciAPolymer microparticles production by supercritical assisted atomizationJ Supercrit Fluids200739444452
- CoceroMJMartinAMatteaFVaronaSEncapsulation and co-precipitation processes with supercritical fluids: Fundamentals and applicationsJ Supercrit Fluids200947546555
- KalaniMYunusRApplication of supercritical anti-solvent method in drug encapsulation: a reviewInt J Nanomedicine201161429144221796245
- LengsfeldCSDelplanqueJBarocasVHRandolphTWMechanism governing microparticle morphology during precipitation by a compressed anti-solvent: atomization vs nucleation and growthJ Phys Chem B20001041227252735
- ShoaibMHTazeenJMerchantHAYousufRIEvaluation of drug release kinetics from ibuprofen matrix tablets using HPMCPak J Pharm Sci200619211912416751122
- JungJPerrutMParticle design using supercritical fluids: literature and patent surveyJ Supercrit Fluids200120179219
- HaoJWhitakerMJSerhatkuluGShakesheffKMHowdleSMSupercritical fluid assisted melting of poly(ethylene glycol): a new solventfree route to microparticlesJ Mater Chem20051511481153
- YuluWDaveRNPfefferRPolymer coating/encapsulation of nanoparticles using a supercritical anti-solvent processJ Supercrit Fluids2004288599