Abstract
Purpose
A lipid-based, nanomicelle-loaded docetaxel (M-DOC) was designed and characterized. Optical imaging was employed to evaluate the pharmacokinetics and antitumor efficacy of docetaxel in vivo.
Materials and methods
The M-DOC was prepared using the emulsion-diffusion method. Transmission electron microscopy and dynamic light scattering were used to assess the morphology and particle size of the M-DOC. Critical micelle concentrations, their stability under physiological conditions, and their encapsulation efficiency – as measured by high-performance liquid chromatography – were assessed. Pharmacological features were evaluated in two different animal models by comparing M-DOC treatments with docetaxel injections (I-DOC). Bioluminescence imaging was used to assess antitumor activity and docetaxel distribution in vivo, using nude mice injected with luciferase-expressing MDA-MB-231 human breast tumor cells. In addition, animals injected with B16 melanoma cells were used to measure survival time and docetaxel distribution.
Results
The M-DOC was prepared as round, uniform spheres with an effective diameter of 20.8 nm. The critical micelle concentration of the original emulsion was 0.06%. Satisfactory encapsulation efficiency (87.6% ± 3.0%) and 12-hour stability were achieved. Xenograft results demonstrated that the M-DOC was more effective in inhibiting tumor growth, without significantly changing body weight. Survival was prolonged by 12.6% in the M-DOC group. Tumor growth inhibitory rates in the M-DOC and I-DOC groups were 91.2% and 57.8% in volume and 71.8% and 44.9% in weight, respectively. Optical bioluminescence imaging of tumor growths yielded similar results. Area under the curve(0–6 hour) levels of docetaxel in blood and tumors were significantly higher in the M-DOC group (15.9 ± 3.2 μg/mL−1, 601.1 ± 194.5 μg/g−1) than in the I-DOC group (7.2 ± 1.7 μg/mL−1, 357.8 ± 86.2 μg/g−1). The fluorescent dye 1,1-dioctadecyl-3,3,3,3′-tetramethylindotricarbocyanine iodide mimicked M-DOC in optical imaging, and accumulated more in tumors in comparison with I-DOC.
Conclusion
These results suggest that the lipid-based nanomicelle system was effective in inhibiting tumor growth, with little toxicity. Moreover, we have developed a noninvasive optical imaging method for antitumor drug evaluation, which merits further analysis for potential clinical applications.
Introduction
Micelles have recently emerged as a promising drug delivery system, with numerous advantages that include improved solubility for some drugs, increased targeting of drugs in tumor areas, and the reduction of adverse drug reactions in patients.Citation1 Micelles are colloidal particles, generally less than 100 nm in diameter, that self-assemble from amphiphilic polymers or surfactants. Hydrophobic drugs can be carried in the hydrophobic cores of the micelles, protected from rapid clearance by the hydrophilic shell.Citation2 Further superior properties, such as small size, high stability, and ease of modification, make micelles an attractive tumor-targeting delivery system.Citation3 For example, SP1049C (Supratek Pharma Inc, Montreal, Canada) is a doxorubicin-loaded micelle, consisting of Pluronic® L61 and F-127 (BASF Corporation, Florham Park, NJ), with a diameter of 22–27 nm. Preclinical studies suggested that SP1049C has superior antitumor properties, and delays or averts the development of doxorubicin resistance.Citation4 Genexol-PM is a micellar paclitaxel formulation consisting of polyethylene glycol (PEG) and poly (D,L-lactic acid). Preclinical in vivo studies with these 20–50 nm micelles demonstrated a three-fold increase in the maximum tolerated dose, and significantly increased antitumor efficacy compared with free paclitaxel.Citation5 However, despite increased interest in micelles, only seven micellar formulations have been approved for clinical trials by the United States Food and Drug Administration to date.Citation6 Most approaches do not achieve clinical use due to poor biocompatibility of carrier material and low stability of micelles.Citation7 These challenges suggest the need for novel polymers as carrier materials.
In light of these drawbacks, Solutol® HS 15 (BASF Ltd, Ludwigshafen, Germany) and phospholipids were chosen to structure the micelles in this study. Solutol® HS 15, the main components of which are polyglycol mono- and di- esters of 12-hydroxystearic acid and approximately 30% free polyethylene glycol, provides many advantages.Citation8 It is used in the delivery of antitumor drugs by injection due to its good biocompatibility, low hemolytic activity, and antimultidrug-resistance effect.Citation9 Furthermore, PEG blocks in Solutol® HS 15 serve as efficient, inexpensive steric protectors in various biologically active particulate delivery systems.Citation10 Lipids formed the other carrier material, as lipid-based conjugate materials can exhibit good stability and longevity, and are able to accumulate in areas with damaged vasculature;Citation11 this is the enhanced permeation and retention effect in leaky areas, such as tumors and infarcts.
As a typically poor water-soluble antitumor drug, docetaxel treatment has been widely used in clinical trials in recent decades. However, clinical intravenous administration of commercially available docetaxel (Taxotere®) is limited by hypersensitivity reactions and side effects induced by excipients containing polysorbate 80, and by its nonspecific distribution throughout the body.Citation12 Therefore, a drug delivery system consisting of Solutol® HS 15 and lipid S100 (Lipoid GmbH) was prepared, yielding docetaxel-carrying micelles; its characteristics, antitumor activity, toxicity, pharmacokinetics (PK), and effects on survival time were evaluated in comparison with Taxotere®, the docetaxel injection (I-DOC). In vivo optical imaging was also utilized in this study, providing real-time information on the longitudinal development of tumors.Citation13
Materials and methods
Materials and cell lines
Solutol® HS 15 and lipid S100 were the main constituents of the nanomicelles. A docetaxel (Haikou Co, Ltd, Hainan, China) injection was prepared according to the commercial formulation of Taxotere®. Dulbecco’s modified Eagle’s medium, fetal bovine serum (FBS), and a 0.25% (w/v) trypsin-0.03% (w/v) ethylenediaminetetraacetic acid solution were purchased from Gibco BRL (Gaithersburg, MD). D-luciferin potassium salt was obtained from Gold Biotechnology Inc (Olivette, MO). Purified deionized water was prepared using the Milli-Q Plus system (Millipore Co, Billerica, MA). All other reagents and chemicals were of analytical grade.
The luciferase-expressing MDA-MB-231 (M2L) human breast tumor cell line and malignant melanoma B16 tumor cell line were kindly provided by the Laboratory of Immunology, School of Medicine, Tsinghua University (Beijing, China). Cells in the logarithmic phase of growth were used in all experiments. Cells were cultured in Dulbecco’s modified Eagle’s medium, supplemented with 10% FBS, 0.125 mg/ml−1 penicillin, and 0.1 mg/mL−1 streptomycin sulfate, in incubators maintained at 5% CO2 and 37°C under fully humidified conditions. Animals were supplied by the Department of Experimental Animals, Tsinghua University, and acclimated at 25°C and 55% humidity under natural light/dark conditions for 1 week before dosing. Animals were housed under standard conditions, with free access to food and water. All animal experiments were carried out in accordance with guidelines evaluated and approved by the ethics committee of Tsinghua University.
Preparation of M-DOC
Docetaxel-loaded lipid-based nanomicelles were prepared by the emulsion-diffusion method. Briefly, 20 mg docetaxel was dissolved in 0.5 g ethanol. 0.36 g PC50 (a 1:1 mixture of S100 and propylene glycol by volume), 0.8 g Solutol® HS 15, and 0.18 g glycerine were added to the stirring solution in sequence, and ethanol was added to make a total volume of 2 mL. The mixture was stirred for 30 minutes at 37°C. After 24 hours, the final concentration of lipid-based nanomicelles was 10 g/L−1. Micelles were diluted in physiological saline before use. The subsequent addition of water to the system caused diffusion of the solvent into the external phase, resulting in nanomicelle formation.Citation14
Characterization of M-DOC
The mean diameter and size distribution of the samples (0.01 mg/mL−1) were measured by dynamic light scattering with a Zetasizer Nano-ZS90 (Malvern Instruments Ltd, Malvern, UK) at 25°C. The morphology of the micelles was assessed by transmission electron microscopy (Hitachi H-7650B; Hitachi Ltd, Tokyo, Japan) with a charge-coupled device camera. Samples (0.01 mg/mL−1) were placed on a carbon-coated copper grid, negatively stained with 1% uranyl acetate solution, and dried at room temperature overnight. Observations were performed at an acceleration voltage of 80 kV.
Critical micelle concentration (CMC)
A surface tension measurement was used to determine the CMC, using the drop-volume method.Citation15 Each surface tension value (γ) was determined from at least five measured values. The standard error of the surface tension data was 0.2 mN/m−1. The measurement temperature was controlled at 25.00°C ± 0.05°C using a thermostat.
Micelle stability in physiological conditions
To determine the kinetics of docetaxel release from micelles, 1 mL of micelle was added to 1 mL of FBS. The mixture was placed in a dialysis bag (molecular weight cutoff 8000) and dialyzed with gentle shaking against 18 mL of PBS (pH 7.4) containing 10% FBS at 37°C. A 200-μL aliquot was removed at designated time points for high-performance liquid chromatography (HPLC) analysis.Citation17
Encapsulation efficiency of M-DOC
Micelles (1 mL, 0.1 mg/mL−1) were filtered through a 0.22-μm syringe filter, then dissolved into 10 mL acetonitrile (HPLC grade; Dikma Co, Beijing, China) and transferred into an HPLC (HP 1200; Agilent Technologies, Santa Clara, CA) vial.Citation16 Chromatographic separation was achieved using an RP-HPLC system (250 × 4.6 mm, 5 μm; Dikma Co) at 30°C. The mobile phase consisted of acetonitrile (HPLC grade; Dikma Co) and deionized water (40:60, v/v). The flow rate was 1.0 mL/min−1, and the UV detection wavelength was 232 nm. The retention time of docetaxel was 6.8 minutes. The measurement was repeated three times. The encapsulation efficiency percentage equaled the weight of the drug in nanomicelles divided by the total weight of the drug in preparation, multiplied by 100%.
In vivo antitumor activity of M-DOC
Luciferase-expressing M2L tumor cells (5–6 × 10⁶ cells per mouse) were injected subcutaneously into BALB/c nude mice (6–8 weeks old, 22 ± 2 g) at the right axilla. When tumor volumes reached approximately 20 mm3, mice were randomly assigned to three treatment groups (five mice per group): saline control, I-DOC, and M-DOC. Mice were intravenously injected four times (on days 0, 7, 14, and 21) with the formulations at a dose of 10 mg docetaxel/kg, or with 0.2 mL normal saline as a control. Tumor diameters were measured every third day in two dimensions with a vernier caliper. Individual tumor volume was calculated using the formula V = (L/W2)/0.5, where length (L) is the longest diameter and width (W) is the shortest diameter perpendicular to length. At the end of the experiment, the animals were sacrificed by cervical dislocation, and the tumor mass was harvested, photographed, and weighed. In addition, for safety evaluation, the mice were weighed every third day. Inhibition of tumor volume growth (%) = 1 − (average volume of DOC-treated)/(average volume of control) × 100%. Inhibition of tumor weight growth (%) = 1 − (average weight of DOC-treated)/(average weight of control) × 100%.
Survival time analysis
B16 melanoma cells (5 × 10⁶ cells per mouse) were inoculated subcutaneously into male C57 mice (6–8 weeks old, 22 ± 2 g) at the right axilla. When tumor volume reached approximately 100 mm3, mice were randomly divided into three treatment groups (10 mice per group) and treated by intravenous injection as described above. Treatments were repeated every third day until death. Survival time was calculated from the first day of administration to the day of the animal’s natural death. Kaplan–Meier survival curves were plotted for each group.
Tissue distribution of M-DOC
HPLC was used to study the PK of the two docetaxel formulations in C57 mice (10 mice per group, two mice per time point). Mice were injected intravenously (via tail vein) with M-DOC and I-DOC (25 mg/kg−1). At 0.5, 1, 2, 4, and 6 hours after injection, 0.5 mL of blood was collected from the eye into heparinized polyethylene tubes, and centrifuged at 1000 g for 10 minutes to obtain plasma. Plasma was stored at −18°C prior to analysis by HPLC. At each time point, the heart, liver, spleen, lung, and kidney were excised and thoroughly washed with ice-cold saline, then blotted dry, weighed, and stored at −18°C.
Docetaxel concentration was assessed by HPLC as follows. Tissues were homogenized before extraction. Liquid–liquid extraction was performed prior to analysis.Citation18 Briefly, 100 μL samples of plasma or tissues were mixed with a 1 mL mixture of acetonitrile and n-butyl chloride (1:4, v/v) containing 20 μl paclitaxel (5 μg/ml−1) as an internal standard. The samples were extracted to a vortex mixer for 2 minutes, then centrifuged at 4000 g for 5 minutes. The organic layer (800 μL) was transferred to a clean tube and evaporated under a gentle stream of nitrogen. The extraction residue was reconstituted in 100 μl methanol and centrifuged at 10,000 g for 5 minutes before HPLC analysis. The determination used the same HPLC method as described in the encapsulation efficiency section, with a mobile phase consisting of acetonitrile and deionized water (45:55, v/v). Good linearity was observed, with all R2 above 0.999, and the recovery rate was above 87.4%. The WinNonlin® practical PK software (Pharsight®, St Louis, MO) was utilized to analyze pharmacokinetic parameters.
Optical imaging of antitumor activity and tumor distribution
To obtain in vivo fluorescence images using the Kodak In-Vivo FX Pro Imaging System (Carestream Health, Inc, Rochester, NY), BALB/c nude mice with luciferase-expressing M2L cell xenografts received an intravenous injection of DOC formulation at 10 mg/kg−1 at each time point (0, 7, 14, and 21 days). On days 0, 7, 14, 21, and 28, tumor diameters were measured in pixels using Carestream molecular imaging software. During each measurement, a luciferase substrate (0.15 g/g−1) was injected through the tail vein. After 20 minutes, M2L cells were imaged (exposure time 2 minutes) and tumor shapes were observed. The individual tumor volume and inhibition of tumor volume growth were calculated.
The near-infrared lipophilic carbocyanine dye 1,1-dioctadecyl-3,3,3,3′-tetramethylindotricarbocyanine iodide (DiR) was used to mimic the distribution of DOC formulations. Mice bearing luciferase-expressing M2L cells were injected with DiR (500 μg/mL−1) mixed with M-DOC or I-DOC (10 mg/kg−1). At 0.5, 1, 2, 4, and 6 hours, the mice were euthanized, the tumors were dissected, and fluorescence images were obtained. The absorption and fluorescence maxima were 730 and 790 nm, respectively, and the exposure time was 30 seconds.Citation19
Statistical methods
Results are presented as mean ± standard error. Statistical comparisons were made by ANOVA and a student’s t-test. The accepted level of significance was P < 0.05.
Results
Characteristics of M-DOC
Particle size and surface morphology
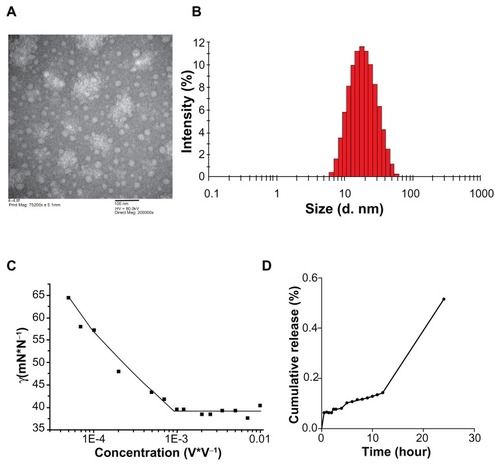
M-DOC micelles were spherical in shape and 20–25 nm in diameter, with a narrow size distribution (). As shown in , the particle size by intensity of M-DOC micelles was 20.8 nm. A narrow polydispersity index of 0.213 was achieved. Dehydration and shrinkage of the micelles during processing for transmission electron microscopy observation might lead to the larger size distribution compared to the results of dynamic light scattering. After 12 hours of storage, the preparation was clarified and transparent.
Figure 1 The physicochemical characterization of M-DOC (A) TEM images of 0.01mg/mL−1 M-DOC negatively stained with 1% uranyl acetate solution; (B) size distribution of 0.01mg/mL−1 M-DOC by the DLS analysis; (C) variation of surface tension with M-DOC concentrations at 25°C; and (D) cumulative release of docetaxel from M-DOC in serum at 25°C.
Notes: DOC analysis was performed by HPLC, as described in the Materials and methods section. Data are given as means ± SD (n = 3).
Abbreviations: DOC, docetaxel; M-DOC, nanomicelle-loaded docetaxel; DLS, dynamic light scattering; HPLC, high-performance liquid chromatography; SD, standard deviation.
CMC
shows the surface tension of M-DOC as a log function of concentration. The surface tension of the original emulsion of docetaxel and surfactants was increased with concentration, and the CMC value of the micelles, determined from the clear breakpoints, was 0.06%.
Stability in physiological conditions
The cumulative release of docetaxel from M-DOC micelles at 25°C is shown in . Drug release from micelles was slow in the beginning, and only 14% of the docetaxel was released from the micelles after 12 hours. Drug release from M-DOC was almost complete at 48 hours, and the amount of drug released was about 99.3% at the end of the test.
Encapsulation efficiency
The mean encapsulation efficiency as determined by HPLC was 86.7% ± 3.0%.
In vivo pharmacodynamic and pharmacokinetic results
In vivo antitumor activity of M-DOC
The tumor growth inhibition by M-DOC in vivo, compared to the control and I-DOC, is shown in . Significant differences between the control and DOC groups were apparent after 3 weeks. In particular, one out of every six M-DOC-treated animals showed complete tumor disappearance by day 20. The final volume inhibitory rate was 91.2% for M-DOC and 57.8% for I-DOC. Tumor weight in M-DOC-treated animals (0.64 ± 0.14 g) was less than that in the I-DOC group (1.25 ± 0.38) and controls (2.27 ± 0.48), and the weight inhibitory rates were 71.8% and 44.9% for M-DOC and I-DOC, respectively, showing a very similar response to the volume inhibitory rate.
Figure 2 (A) Tumor growth curves and representative images of a harvested M2L tumor (left panel). The mice were intravenously injected four times (on days 0, 7, 14, and 21) with the formulations at a dose of 10 mg docetaxel/kg−1 and 0.2 mL normal saline as a control. Tumor size was measured using a caliper, and tumor volume was determined as described in the Materials and methods section at the same intervals for 28 days. The representative tumor images in the left panel were taken on day 28. The results show means ± SD (n = 5 mice/group). (B) Body weight changes in M2L-bearing nude mice treated with different formulations.
Notes: Data represent means ± SD (n = 5 mice/group). *P < 0.05, **P<0.01 as compared to the no-treatment control group.
Abbreviations: SD, standard deviation; M-DOC, nanomicelle-loaded docetaxel; I-DOC, docetaxel injection.
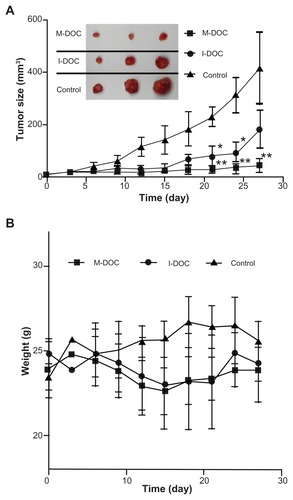
During the experiment, body weight was also monitored (). No serious body weight loss was observed in any experimental group, and the trends of the two docetaxel groups were similar. This result showed that, at the same dose of docetaxel, the lipid-based micelle system was effective in inhibiting growth, with similar systemic toxicity.
Survival time with M-DOC treatment
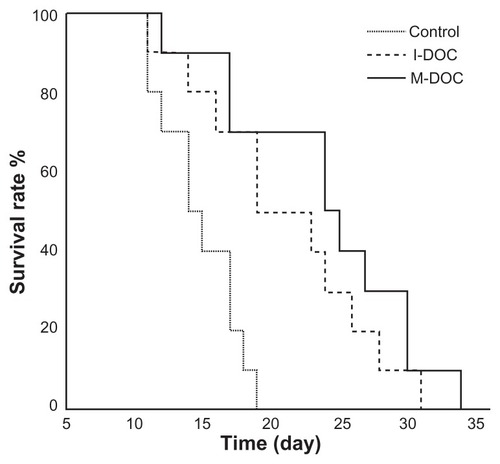
In a separate experiment, the survival of mice bearing B16 tumors in response to M-DOC, I-DOC, and normal saline was determined. The results are presented in a Kaplan–Meier plot in . The average survival times of mice treated with M-DOC, I-DOC, and normal saline were 26.0 ± 2.1, 23.1 ± 2.0, and 15.8 ± 0.9 days, respectively. The average survival time with M-DOC was prolonged by 12.6% compared to that of I-DOC, although there was no significant difference between the two DOC groups (P > 0.05). In this experiment, B16 melanoma tumor cells with high malignant potential were selected. Good tumor formation rate and rapid tumor growth rate may explain why the differences in survival time between M-DOC and I-DOC were not remarkable. Notably, mice bearing B16 tumors did not live as long as those bearing M2L cells.
Figure 3 Survival times of M-DOC and I-DOC in C57 mice burdened with malignant B16 melanoma tumor cells. Every three days, from the day when tumor volumes reached approximately 100 mm3 until the day the mice naturally died, the mice were intravenously injected with the formulations at a dose of 10 mg docetaxel/kg and 0.2 mL normal saline (n = 10 mice/group).
Abbreviations: M-DOC, nanomicelle-loaded docetaxel; I-DOC, docetaxel injection.
Distribution of M-DOC by HPLC
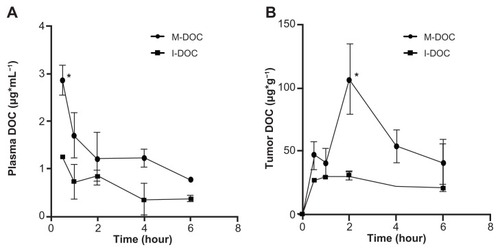
For PK analysis, M-DOC and I-DOC were administered to BALB/c mice at 25 mg/kg−1 by tail vein injection, blood samples were taken at selected time points, and docetaxel was detected by HPLC. The M-DOC blood circulation time was significantly extended compared to I-DOC (; ), with a 1.5-fold higher mean residence time, 2.2-fold higher area under the curve (AUC0–6 hours); P < 0.05. The levels of docetaxel in tumors were highest 2 hours after DOC injection (), with a 3.9-fold higher Cmax. High levels of docetaxel were measured in tumors and plasma at every time point.
Table 1 Relative parameters of distribution in tumors and plasma
Figure 4 In vivo pharmacokinetic profiles of M-DOC and I-DOC in C57 mice bearing malignant B16 melanoma models at a dose of 25 mg/kg−1; the docetaxel in (A) the plasma and (B) the tumors was extracted and measured by HPLC.
Notes: Data represent means ± SD (n = 2 mice/group). *P < 0.05, **P<0.01.
Abbreviations: M-DOC, nanomicelle-loaded docetaxel; I-DOC, docetaxel injection; HPLC, high-performance liquid chromatography; SD, standard deviation.
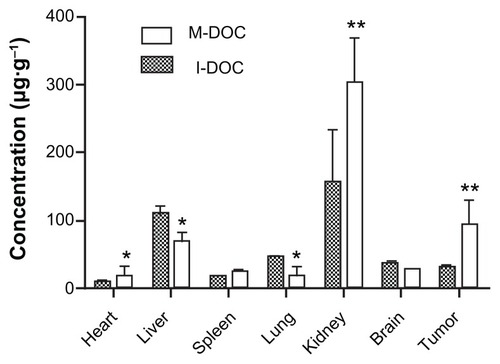
Because the tumor concentrations of docetaxel were highest after 2 hours in M-DOC-injected animals, the tissue distribution of docetaxel at 2 hours after intravenous injection of B16 tumor-bearing mice is shown in . Docetaxel was distributed mainly in the kidneys, tumors, and livers, and was barely detectable in the hearts. The exposure of the organs to M-DOC decreased in the following order: kidney > tumor > liver > brain > spleen > lungs > heart. Compared to the distribution of I-DOC in tissues, docetaxel accumulated more in the tumors, kidneys, and hearts in the M-DOC group, but less in the livers and lungs, which may be indicative of plasma– protein binding of docetaxel.
Figure 5 Biodistribution as delivered by M-DOC and I-DOC. Two hours after DOC-formulations were intravenously administered at 25 mg/g−1 to C57 mice bearing malignant B16 melanomas, docetaxel in the tissues was extracted and measured by HPLC.
Notes: Data represent means ± SD. Error bars correspond to 95% confidence intervals (n = 2 mice/group). *P < 0.05, **P<0.01.
Abbreviations: M-DOC, nanomicelle-loaded docetaxel; I-DOC, docetaxel injection; HPLC, high-performance liquid chromatography; SD, standard deviation.
Optical imaging of antitumor activity and distribution of M-DOC
Bioluminescence of antitumor activity
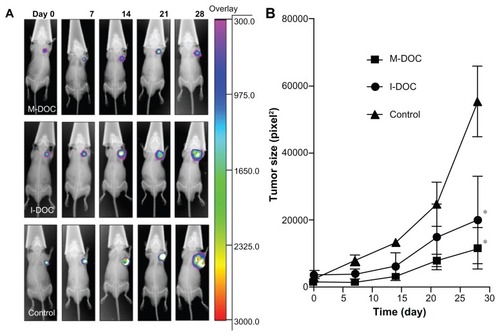
presents the antitumor efficacy of the two formulations. In this experiment, we chose a cell line transfected with the luciferase gene. The cells emit light (bioluminescence), at wavelengths frequently beyond 600 nm, in the presence of oxygen and a substrate.Citation20 Excitation in the presence of luciferase substrate allows for clear imaging of the position and size of tumors. After three weeks of treatment, M-DOC exhibited a significant antitumor effect compared to I-DOC. The volume inhibitory rate was 79.2% in the M-DOC group and 64.0% in the I-DOC group, as shown in .
Figure 6 Biofluorescence imaging of antitumor activity in M2L-bearing BALB/c-nude mice. The mice were intravenously injected four times (on days 0, 7, 14, and 21) with the formulations at a dose of 10 mg docetaxel/kg−1 and 0.2 mL normal saline as a control. (A) Optical imaging; and (B) the inhibition rate of tumor growth, calculated from optical imaging.
Notes: The results show means ± SD (n = 5 mice/group). *P < 0.05, as compared to the no-treatment control group.
Abbreviations: SD, standard deviation; M-DOC, nanomicelle-loaded docetaxel; I-DOC, docetaxel injection.
Fluorescence imaging of tumor distribution
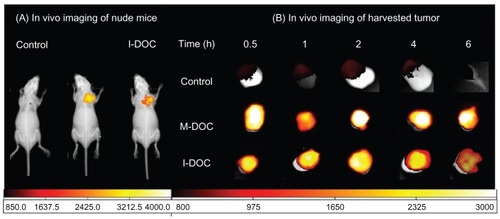
For fluorescence distribution experiments, we employed DiR, a fluorescent dye with acquisition times ranging from 15 to 30 minutes,Citation21 coated on the hydrophobic core of micelles to mimic the distribution behavior of docetaxel. As shown in , the optical signal of DiR mimicked that of DOC formulations; the signals clearly overlapped with solid tumors observed under X-ray. The distribution revealed the fact that M-DOC tends to accumulate at tumor sites. shows that, in the M-DOC group, DiR mimicked docetaxel; this was clearly detectable at the 30-minute mark. A high level of accumulation was seen from 2–4 hours, and lasted up to 6 hours; however, in the I-DOC group, accumulation was seen from 1–2 hours, and was significantly decreased after 6 hours.
Figure 7 Mice were intravenously injected with the formulations at a dose of 10 mg docetaxel/kg−1 and 0.2 mL normal saline mixed with DiR 500 μg · mL−1 to mimic the distribution of the formulations in tumors at 0.5, 1, 2, 4, and 6 hours postintravenous injection. (A) In vivo fluorescence imaging of representations; and (B) harvested tumor only (n = 5 mice/group).
Abbreviations: DiR, 1,1-dioctadecyl-3,3,3,3′-tetramethylindotricarbocyanine iodide; M-DOC, nanomicelle-loaded docetaxel; I-DOC, docetaxel injection.
Discussion
To overcome the poor solubility of docetaxel, a lipid-based nanomicelle consisting of Solutol® HS 15 and lipid S100, was designed. Without the biocompatibility and stability problems of polymer micelles, this self-assembled micelle provides many advantages. A narrow-size distribution, good entrapment efficiency, and good stability in physiological conditions were achieved. These characteristics can be attributed to an optimal particle size that previously showed maximal accumulation and the deepest penetration into tumors.Citation22 The CMC was 0.06%, which retained stability after dilution. Compared to the widely reported CMC of Solutol® HS 15 (0.005%–0.02%), the CMC value (the CMC value calculated as Solutol® HS 15 was 0.024%) was only slightly higher. Thus, the amphiphilic block copolymer HS 15 played an important role in the structures. Its hydrophilic portion, especially the PEG chain, is currently thought to act as a protector to achieve long circulation times of drugs in the blood.Citation23 The hydrophobic segment was incorporated into the inner lipid core, which could decrease CMC and maintain stability after dilution.Citation24
Solid tumors account for more than 85% of cancer mortality. In this study, we chose mice bearing two kinds of solid tumor cell lines in order to study the pharmacological characteristics of the two formulations. First, we analyzed the antitumor activity and distribution of docetaxel in mice bearing M2L tumor cells; second, we examined survival time in animals bearing B16 tumor cells. Our data demonstrated that M-DOC exhibited better antitumor activity in both in vivo tumor models. The M2L model showed significantly greater anti-tumor effects without much systemic toxicity, and the B16 model demonstrated prolonged survival time. In general, there are two main approaches in chemotherapy to increasing antitumor activity and inhibiting tumor growth. One is to increase the concentration and uptake of antitumor drugs in the tumors, and the other is to prolong the time spent in the blood by antitumor drugs.Citation25 The small size of our micelles was designed to allow preferential accumulation and retention in tumor tissues compared to normal tissues, due to the hypervasculature, defective vascular architecture, and deficient lymphatic drainage system of tumor tissues (the enhanced permeation and retention effect).Citation26 Moreover, the core/shell structure of our micelles was formed by phospholipids and HS 15. The application of HS 15 was to prolong the accumulation time of drugs in tumor tissues.Citation27
The size and surface characteristics of a nanomicelle play key roles in its in vivo biodistribution. Our micelles differ from polymer micelles, which have long hydrophobic chains of amphiphilic molecules that can form a tight core; our lipid-based micelles consist of small molecular surfactants, forming a liquid core. Special attention should be paid to the concentration of docetaxel in plasma at the 30-minute mark. The docetaxel concentration in the M-DOC group was over two times higher than that in the I-DOC group. This is probably due to the slower distribution of docetaxel from micelles into tissues, as confirmed by , because the liquid-core micelles were stable and supported sustained release.
The heart is rich in blood vessels; therefore, the accumulation of docetaxel in the M-DOC group was more than that in the I-DOC group, a similar trend to the concentration in plasma (P < 0.05). Docetaxel accumulation in the kidneys was higher in the M-DOC group than in the I-DOC group 2 hours after injection. As described before, M-DOC generated higher docetaxel concentrations than I-DOC in blood, and the particle size of the solubilized I-DOC was less than 25 nm; therefore, it was easily excreted by the kidney. The distribution trend in the liver was somewhat opposite to that in the kidney. Normally, the reticuloendothelial system uptake was inhibited by the “stealth” characteristics of the PEG chain.Citation28 A protective layer around the particles could increase their half-life in the blood circulation from the absorption of opsonin proteins.Citation29 In this micelle system, the PEG chain of Solutol® HS 15 might not be long enough to cover the particle. Free docetaxel exhibited high plasma–protein binding, ranging from 76% to 89%;Citation30 this explains why the accumulation of protein-bound docetaxel was higher in the I-DOC-treated animals.
Optical imaging is the noninvasive mapping of molecular indicators in live animals using bioluminescence and fluorescence imaging.Citation31 Both approaches were used in this study; luciferase imaging for antitumor effects is an example of bioluminescence, and DiR imaging for distribution mapping is an example of fluorescence. Optical imaging has fundamental restrictions both as a research and clinical tool. The technique attains limited penetration depths (a few mm), and reflectance imaging does not allow strict quantification.Citation32 In our study, optical imaging yielded similar results to the traditional methods, which implies that optical imaging is an effective and convenient approach to measuring antitumor activity and PK.
Conclusion
Docetaxel-loaded lipid-based nanomicelles achieved antitumor activity, high encapsulation efficiency, good stability, and ease of preparation, which indicate clinical promise. This study established the ability of a lipid-based micelle system to improve water-insoluble drug solubility and tumor targeting, and strongly supports optical imaging as a noninvasive method for evaluating antitumor efficacy and PK.
Acknowledgments
This work was supported by the National 973 Program (2009CB903300). We are grateful to Professor Liang Xingjie for correcting the English in the manuscript. We greatly appreciate the assistance provided by the Laboratory of Immunology, School of Medicine, Tsinghua University, and by Professor Wang Yilin of the Institute of Chemistry, Chinese Academy of Science.
Disclosure
The authors report no conflicts of interest in this work.
References
- PetrosRADeSimoneJMStrategies in the design of nanoparticles for therapeutic applicationsNat Rev Drug Discov20109861562720616808
- SavicRLuoLEisenbergAMaysingerDMicellar nanocontainers distribute to defined cytoplasmic organellesScience2003300561961561812714738
- KedarUPhutanePShidhayeSKadamVAdvances in polymeric micelles for drug delivery and tumor targetingNanomedicine20106671472920542144
- ValleJWArmstrongANewmanCA phase 2 study of SP1049C, doxorubicin in P-glycoprotein-targeting pluronics, in patients with advanced adenocarcinoma of the esophagus and gastroesophageal junctionInvest New Drugs20112951029103720179989
- LeeKSChungHCImSAMulticenter phase II trial of Genexol-PM, a Cremophor-free, polymeric micelle formulation of paclitaxel, in patients with metastatic breast cancerBreast Cancer Res Treat2008108224125017476588
- Clinicaltrialsgov [homepage on the Internet]Bethesda, MDUS National Library of Medicinec1993–2001 [updated January 5, 2012; cited January 7, 2012]. Available from: http://clinicaltrials.gov/Accessed January 9, 2012
- EngelsFKMathotRAVerweijJAlternative drug formulations of docetaxel: a reviewAnticancer Drugs20071829510317159596
- Pharma-ingredients.basf.com [website on the Internet]GermanyBSFc2011 [updated December 10, 2011; cited January 7, 2012]. Available from: http://worldaccount.basf.com/wa/NAFTA/Catalog/Pharma/info/BASF/exact/solutol_hs_15Accessed January 9, 2012
- CoonJSKnudsonWClodfelterKLuBWeinsteinRSSolutol HS 15, nontoxic polyoxyethylene esters of 12-hydroxystearic acid, reverses multidrug resistanceCancer Res19915138979021988130
- HowardMDJayMDziublaTDLuXPEGylation of nanocarrier drug delivery systems: state of the artJ Biomed Nanotechnol20084213314810.1166/jbn.2008.021.
- MusacchioTTorchilinVPRecent developments in lipid-based pharmaceutical nanocarriersFront Biosci2011161388141221196238
- BakerJAjaniJScottéFDocetaxel-related side effects and their managementEur J Oncol Nurs2009131495919201649
- BakerMWhole-animal imaging: the whole pictureNature2010463728397798020164931
- Mora-HuertasCEFessiHElaissariAPolymer-based nanocapsules for drug deliveryInt J Pharm20103851–211314219825408
- WuCHouYDengMMolecular conformation-controlled vesicle/micelle transition of cationic trimeric surfactants in aqueous solutionLangmuir201026117922792720426428
- WangXWangYChenXWangJZhangXZhangQNGR-modified micelles enhance their interaction with CD13-overexpressing tumor and endothelial cellsJ Control Release20091391566219470394
- WangYYangTWangXMaterializing sequential killing of tumor vasculature and tumor cells via targeted polymeric micelle systemJ Control Release2011149329930621044651
- BakerSDZhaoMHePCarducciMAVerweijJSparreboomASimultaneous analysis of docetaxel and the formulation vehicle polysorbate 80 in human plasma by liquid chromatography/tandem mass spectrometryAnal Biochem2004324227628414690692
- KalchenkoVShivtielSMalinaVUse of lipophilic near-infrared dye in whole-body optical imaging of hematopoietic cell homingJ Biomed Opt200611505050717092148
- BhaumikSGambhirSSOptical imaging of Renilla luciferase reporter gene expression in living miceProc Natl Acad Sci U S A200299137738211752410
- ZhanCGuBXieCLiJLiuYLuWCyclic RGD conjugated poly(ethylene glycol)-co-poly(lactic acid) micelle enhances paclitaxel anti-glioblastoma effectJ Control Release2010143113614220056123
- DreherMRLiuWMichelichCRDewhirstMWYuanFChilkotiATumor vascular permeability, accumulation, and penetration of macromolecular drug carriersJ Natl Cancer Inst200698533534416507830
- ChenJZhouBLiQPLLA-PEG-TCH-labeled bioactive molecule nanofibers for tissue engineeringInt J Nanomedicine201162533254222072887
- TorchilinVPStructure and design of polymeric surfactant-based drug delivery systemsJ Control Release2001732–313717211516494
- JainRKTransport of molecules in the tumor interstitium: a reviewCancer Res19874712303930513555767
- MaedaHWuJSawaTMatsumuraYHoriKTumor vascular permeability and the EPR effect in macromolecular therapeutics: a reviewJ Control Release2000651–227128410699287
- YooJWChambersEMitragotriSFactors that control the circulation time of nanoparticles in blood: challenges, solutions and future prospectsCurr Pharm Des201016212298330720618151
- CalicetiPVeroneseFMPharmacokinetic and biodistribution properties of poly(ethylene glycol)-protein conjugatesAdv Drug Deliv Rev200355101261127714499706
- LukyanovANTorchilinVPMicelles from lipid derivatives of water-soluble polymers as delivery systems for poorly soluble drugsAdv Drug Deliv Rev20045691273128915109769
- BisseryMCPreclinical pharmacology of docetaxelEur J Cancer199531ASuppl 4S167577097
- PortneyNGOzkanMNano-oncology: drug delivery, imaging, and sensingAnal Bioanal Chem2006384362063016440195
- ContagCHRossBDIt’s not just about anatomy: in vivo bioluminescence imaging as an eyepiece into biologyJ Magn Reson Imaging200216437838712353253