Abstract
Detection of micrometastases plays an important role in early-stage and recurrent cancer diagnosis. In the study, a new method of screening micrometastases of lung cancer in peripheral blood by magnetic nanoparticles (MNPs) and quantum dots (QDs) was developed to achieve early diagnosis and recurrence prevention. MNPs were prepared by combining miniemulsion polymerization and Stöber coating methods. QDs were prepared by using Cd(Ac)2 · 2H2O and oxygen-free NaHTe with thioglycolic acid as the stabilizer. The carbodiimide-mediated condensation method was used to couple pan-cytokeratin (pan-ck) antibody (Ab) to the surface of the MNPs, and Lunx and SP-A Abs to the surface of the QDs. After four kinds of epithelial tumor cells were enriched by MNPs coupled with pan-ck Ab (MNP-pan-ck), lung cancer cells A549 and SPC-A-1 were successfully identified by QDs with double-labeled Abs. Finally, 32 patients with non-small cell lung cancer (NSCLC) were collected, out of 26 cases with the enriched circulating tumor cells (CTCs), 21 cases were successfully identified by QDs. Therefore, a new method was established in which MNP-pan-ck collected CTCs and QDs with double-labeled Abs could be used simultaneously to identify CTCs from NSCLC patients.
Introduction
Lung cancer is the leading cause of cancer deaths worldwide. International standards divide lung cancer into two types: small cell lung cancer and non-small cell lung cancer (NSCLC). NSCLC accounts for approximately 85% of all cases of lung cancer. Surgery is the preferred treatment method for NSCLC patients. However, many patients remain at risk of recurrence and metastasis following surgery, and it is difficult for routine histopathology and imageology methods to detect metastasis. Therefore, more sensitive and specific methods are needed to detect lung cancer earlier and identify patients at highest risk for recurrence. In 2002, Bernards and WeinbergCitation1 presented a new model of metastasis where metastatic capacity is gained early during primary tumor development. Micrometastases were originally defined by pathologists as small occult metastases (0.2 cm in their greatest dimension). Currently, single circulating tumor cells (CTCs) are also called micrometastases. Indeed, single CTCs in cancer patients can be detected at early stages of tumor progression in peripheral blood. In order to detect single CTCs in peripheral blood, several different methods have been developed including reverse-transcription polymerase chain reaction, flow cytometry, and the immunomagnetic beads technique.Citation2–Citation7
To date, nanomaterials and nanotechnology have shown great potential in disease diagnosis and therapy. Magnetic nanoparticles (MNPs) are a new type of nanomaterial.Citation8 The application of MNPs in the fields of biomedicine such as magnetic separation, drug delivery, magnetic resonance imaging, cell and tissue targeting, and transfection have drawn considerable attention due to their particularly large surface-to-volume ratio and intrinsic magnetic properties.Citation9,Citation10 Quantum dots (QDs) are nanocrystals of inorganic semiconductors that are restricted in three dimensions to a somewhat spherical shape, typically with a diameter of 2–8 nm.Citation11 QDs are a relatively new class of fluorescent nanomaterials with excellent photophysical properties which include quantum-size effect, high brightness, long-term photostability, high quantum yields, and more importantly, broad absorption spectra coupled to narrow size-tunable photoluminescent emission spectra.Citation12 These properties and advantages of MNPs and QDs have provided a new functional platform for disease diagnosis and therapy.
It is well known that NSCLC is a type of epithelial cancer. Pan-cytokeratin (pan-ck) are currently the usual protein markers for the detection of epithelial tumor cells.Citation13 Lunx, a novel human lung-specific gene, has been reported to be a superior diagnostic marker for the detection of micrometastases in peripheral blood and lymph nodes of NSCLC patients.Citation14 Surfactant protein-A (SP-A) is the most prominent of the four proteins in the pulmonary surfactant system. Moreover, expression of SP-A was also described for a portion of NSCLC facilitating a diagnostic marker for these carcinomas.Citation15,Citation16
Since CTCs have very low concentration in the blood (1 per 106–7 leukocytes), a primary enrichment step must usually be performed to augment the sensitivity of the assay.Citation17 This will be followed by a detection method that will identify CTCs. In the present study, new modified MNPs coupled with pan-ck Ab (MNP-pan-ck) are prepared to enrich peripheral blood CTCs in NSCLC patients. After the CTCs are isolated with the MNPs, QDs conjugated with Lunx and SP-A Ab are used to identify the CTCs.
Materials and methods
Preparation and modification of MNPs
Iron oxide (Fe3O4) MNPs were prepared by coprecipitation of FeCl2/FeCl3 (ratio 1:2) by the Massart method.Citation18 Oleic acid (OA)-modified MNPs were produced by redispersing Fe3O4 MNP precipitate in 150 mL of water and adding an excess amount of OA.Citation19 The dark suspension was stirred for 1 hour at 70°C under the protection of N2. The oily black precipitate was collected, washed three times with water, and then dried in an oven under the protection of N2. Miniemulsion polymerization was used to prepare Fe3O4/polystyrene MNPs according to the following procedure:Citation20 Fe3O4 MNPs were modified by 0.11 g of OA and were dispersed in a solution of 1 mL of styrene and 0.1 g of cyclohexane with the aid of ultrasound to form the oil phase. 80 mg of sodium dodecyl sulfate (SDS) and 8 mg sodium bicarbonate were dissolved in 30 mL of water to form the water phase. A mixture of the oil phase and the water phase was ultrasonicated in an ice-cooled bath for 10 minutes to form a miniemulsion and was transferred to a 250 mL four-necked flask equipped with a condenser, a nitrogen inlet, and a stirrer. 15 mg of potassium persulfate dissolved in 0.5 mL of water was added to initiate the polymerization at 70°C with continual stirring at 300 rpm (magnetic stir bars, 25 mm ×9 mm). After 12 hours, the Fe3O4/polystyrene MNPs were obtained. Fe3O4/polystyrene MNPs were centrifuged for 120 minutes at 21,000 rpm and dried in a desiccator for further characterization. Fe3O4/polystyrene MNPs were prepared by Stöber coating methods. Carboxyl-functionalized Fe3O4/polystyrene MNPs were prepared by copolymerization of acrylic acid and styrene. Transmission electron microscope (TEM) images were recorded using an H-8100 microscope (Hitachi, Tokyo, Japan).
Preparation and modification of aqueous soluble CdTe QDs
Cadmium telluride (CdTe) QDs were synthesized according to the method reported by Zhao.Citation21 Briefly, 0.5 mmol Cd(Ac)2 · 2H2O (Beijing Chemical Int., Beijing, China) was dissolved in 100 mL of high-purity water, then 87 μL of thioglycolic acid (Acros, Geel, Belgium) was added into the mixture under stirring. 1 M NaOH was used to adjust the pH of the solution to 9.5. After the mixture had been degassed by high-purity N2 bubbling for 30 minutes, a 0.25 mmol oxygen-free NaHTe (Beijing Chemical Int.) solution prepared by reducing Te powder by NaBH4 was injected. The resulting mixture was subjected to reflux until the appreciated size was reached by monitoring the ultraviolet–visible curves of the aliquot. Fluorescence spectra of CdTe QDs were measured on a FS900 fluorescence spectrometer (Edinburgh Analytical Instruments, Edinburgh, UK). High-resolution transmission electron microscope (HRTEM) characterizations were performed by using a JSM-3010 (JEOL, Tokyo, Japan) electron microscope. In the experiment, two kinds of CdTe QDs were synthesized, and were named QD552 and QD625, respectively, based on the maximum fluorescence emission of the QDs.
Coupling pan-ck Ab to the surface of MNPs
The carbodiimide-mediated condensation method was used to couple pan-ck Ab to the surface of MNPs. Briefly, 100 μL of MNPs were transferred to a reaction tube and coupling buffer (10 mM K2HPO4, 150 mM NaCl, pH 5.5) was added to a final volume of 1 mL. The reaction tube was shaken vigorously for 1 minute and then the MNPs were separated magnetically by placing the reaction tube in the magnetic separator (Dynal AS, Oslo, Norway) at 4°C for 5 minutes. The supernatant was removed, leaving the MNPs as a wet cake on the container wall. The MNPs were suspended in 1 mL of coupling buffer. 0.25 mg 1-ethyl-3-(3-dimethylaminopropyl) carbodiimide (EDAC) reagent (Sigma-Aldrich, St Louis, MO) was added to the system and stirred briefly. 50 μg pan-ck Ab was added to the reaction system and vortexed for 1 hour. The MNP-pan-ck was magnetically separated and the supernatant was removed. 1 mL of wash buffer (10 mM Tris, 150 mM NaCl, 0.1% BSA, 0.1% NaN3, 1 mM EDTA, pH 7.4) was added and shaken vigorously. The wash step was repeated three times. Finally, the MNP-pan-ck was resuspended in the wash buffer.
Coupling Abs to the surface of CdTe QDs
The resultant CdTe QDs were conjugated to different lung tissue-specific Abs. QD552 was conjugated to rabbit antihuman Lunx Ab (QD552-Lunx) and QD625 was conjugated to rabbit anti-human SP-A Ab (QD625-SP-A) (Santa Cruz Biotechnology, Santa Cruz, CA). Briefly, 100 μL of 1 mM CdTe QD solution was mixed with 400 μL of 0.05 M borate buffer (pH 7.5). Then, 10 μL of 25 mg/mL EDAC freshly dissolved in water was added to a mixture. After incubation for 5 minutes, 20 μg Ab was added to the mixture. The sample was dialyzed against phosphate-buffered saline (PBS; 10 mM, pH 7.4) after incubation in the dark for 2 hours at room temperature. When the dialysis was over, the QDs conjugated to Abs were collected.
Enriching of epithelial cancer cells by MNPs
Lung cancer A549, SPC-A-1, liver cancer HepG2, and colon cancer HCT-8 cell lines were obtained from American Type Culture Collection (Manassas, VA). All cells were maintained in Dulbecco’s modified Eagle’s medium (Gibco, Grand Island, NY) supplemented with 10% fetal bovine serum and were grown in 5% CO2, at 37°C. Diverse proportion cancer cells were mixed with peripheral blood mononuclear cells (PBMC) to achieve cell suspension (the ratios of cancer cells to PBMC of 1:104, 1:5 × 10⁴, 1:105, 1:5 × 10⁵, 1:106, 1:5 × 10⁶, and 1:107). MNPs-pan-ck were added to the cell suspension and mixed gently for 15 minutes. Cancer cells originating from epithelial tumors were magnetically separated and the isolated cells were resuspended using PBS buffer, and then the separated cells were smeared onto a slide. The slides were stained with hematoxylin and eosin (H&E) to identify cancer cells.
Identification of lung cancer cells by immunocytochemistry
A549, SPC-A-1, HepG2, and HCT-8 cells were fixed with a mixture of glacial acetic acid:ethanol (volume ratio of 1:9) for 15 minutes and air-dried for 30 minutes. Fixed cancer cells were penetrated with 0.3% Triton X-100 for 10 minutes. The cells were respectively blocked with H2O2 reagent and normal goat serum for 10 minutes followed by incubating the slides with 1 μg/mL rabbit anti-human Lunx or SP-A Ab at 4°C overnight. 1.5 μg/mL biotinylated goat anti-rabbit IgG was incubated for 30 minutes, and then streptavidin-conjugated horseradish peroxidase was incubated for 30 minutes. Staining was achieved by adding 100 μL of 3,3′diaminobenzidine for 5 minutes. Finally, slides were washed three times with PBS buffer, the nuclei were counterstained with H&E, and then slides were rinsed with water and dehydrated in 70%, 90%, and 100% ethanol, air-dried, and mounted with gum and viewed under an ordinary optical microscope.
Identifying lung cancer cells with double-labeled Lunx and SP-A Abs QDs
After using MNP-pan-ck to enrich the epithelial cancer cells, all cells were identified by using QD552-Lunx and QD625-SP-A Abs QDs. Briefly, enriched cells were incubated with QD552-Lunx and QD625-SP-A Abs at 4°C overnight. Slides were washed three times with PBS buffer, mounted with glycerin reagent, and viewed under fluorescent microscope (Olympus, Tokyo, Japan).
Clinical specimens
Thirty-two patients with primary NSCLC were enrolled between May 2011 and October 2011 at China-Japan Union Hospital, including 16 males and 16 females aged between 45–77 years old. Thirty-two patients were confirmed to have NSCLC after surgical inspection and were diagnosed without history of other epithelial tumors. NSCLC patients were staged using the tumor–node–metastasis system, including seven cases of stage I and 25 cases of stage II–IV. Moreover, 16 patients with benign lung diseases (BLD) and 16 healthy volunteers were enrolled as controls. 10 mL of blood was collected from all participants and PBMC were isolated by density gradient centrifugation. CTCs were enriched from PBMC by MNP-pan-ck and identified by QDs with double-labeled Abs. The study was approved by the Institutional Review Board of the University Hospital. All samples were collected after obtaining written informed consent.
Statistical analysis
All the data were analyzed with SPSS software (v 12.0; SPSS Inc, Chicago, IL). Experiments were performed in triplicate. Results were expressed as mean ± standard error of mean. Statistical significance was set as P < 0.05.
Results and discussion
Characterization of MNPs
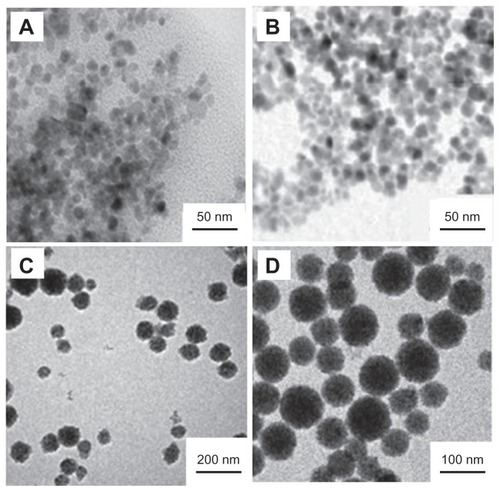
Many approaches have been employed to prepare MNPs including conventional emulsion polymerization,Citation22 soapless emulsion polymerization,Citation23,Citation24 inverse emulsion polymerization,Citation25 miniemulsion polymerization,Citation26 and atom transfer radical polymerization.Citation27,Citation28 Among them, miniemulsion polymerization has been considered as one of the most advantageous encapsulation methods. In the present study, the MNPs with defined structure and controllable magnetite content were successfully prepared from monolayer OAmodified Fe3O4 nanoparticles through miniemulsion polymerization. illustrates the TEM images of different synthetic phases of the MNPs. shows the Fe3O4 nanoparticles. The diameter of the Fe3O4 nanoparticles is in the range from 6 to 15 nm with an average size of 9.6 nm. Despite the OA-modified Fe3O4 nanoparticles, the mean diameter of the Fe3O4 nanoparticles is also 9 nm (), which implies that OA modification does not change the diameter of the Fe3O4 nanoparticles. shows the Fe3O4/polystyrene MNPs. The results demonstrate that there are no pure polystyrene particles and bare magnetite particles without polystyrene coating. shows the carboxyl-functionalized Fe3O4/polystyrene MNPs. A polyacrylic acid layer surfaces the Fe3O4/polystyrene MNPs, which gives a fine hydrophily and biocompatibility to the MNPs.
Figure 1 TEM images of different synthetic phases of the MNPs. (A) Fe3O4 nanoparticles. (B) OA-modified Fe3O4 nanoparticles. (C) Fe3O4/polystyrene MNPs. (D) Carboxyl-functionalized Fe3O4/polystyrene MNPs.
Abbreviations: OA, oleic acid; MNPs, magnetic nanoparticles; TEM, transmission electron microscopy.
Characterization of CdTe QDs
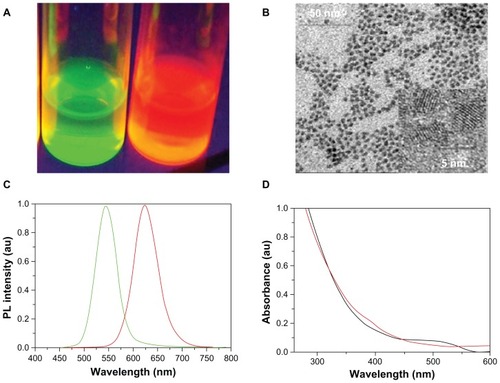
Several methods have been developed to synthesize water-soluble QDs for use in biologically relevant studies.Citation29,Citation30 In the present experiment, two kinds of CdTe QDs were synthesized (). In , two kinds of QDs emit different colors under UV radiation: one emits green light and the other emits red light. The HRTEM study illustrates that the diameter of CdTe QDs ranges from 2.8 nm to 7.3 nm with an average size of 4 nm, which suggests that the CdTe QDs exhibit a good dispersion of particles, and no obvious QD aggregation can be found (). The fluorescence emission spectra of the CdTe QDs are shown in . The maximum fluorescence emission of two kinds of QDs are respectively 552 nm and 625 nm, which were named after QD552 and QD625 in this study. The average full width at half the maximum of the photoluminescence spectra is about 50 nm, which shows that the monodispersity of the QDs is quite good. The two kinds of QDs have a broader absorption spectra which show that a single light source can be used to excite two-color QDs simultaneously without signal overlap (). Therefore, due to these properties, the synthesized QDs provided a powerful foundation for further applications.
Figure 2 Properties of CdTe QDs. (A) Images of two kinds of CdTe QDs solution under ultraviolet light. (B) HRTEM images of CdTe QDs. (C) Photoluminescence spectra of two kinds of QDs. (D) Absorption spectrum of two kinds of CdTe QDs.
Abbreviations: HRTEM, high-resolution transmission electron microscope; QDs, quantum dots; CdTe, cadmium telluride; au, arbitrary units.
MNP-pan-ck enriched epithelial tumor cells
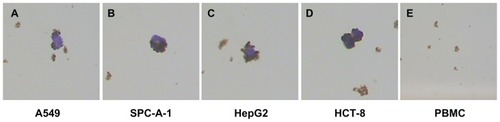
Because pan-ck Ab usually can be used to increase the sensitivity of epithelial tumor cells detection, the study chose MNP-pan-ck to enrich the CTCs in NSCLC patients. In the experiment, it was first verified whether four kinds of epithelial tumor cell lines expressed pan-ck protein by using the immunocytochemistry (ICC) method. The results show that the four kinds of epithelial tumor cells express pan-ck protein (), which proves that pan-ck might be a protein probe for the enrichment of epithelial tumor cells. Secondly, in order to mimic an in vivo environment, the four kinds of epithelial tumor cell lines were mixed with PBMC in different proportions in vitro. Then, MNP-pan-ck was used to enrich the four kinds of epithelial tumor cells. With a ratio of cancer cells to PBMC of 1:5 × 10⁶, the tumor cells were successfully enriched. Furthermore, the enriching of cancer cells was increased by elevating the proportion of cancer cells to PBMC (). After enrichment, the H&E-stained cancer cells demonstrate that the four kinds of epithelial tumor cells are successfully separated from the mixture of cancer cells and PBMC. However, no cells from PBMC were enriched ().
Figure 3 The images of pan-ck protein expression in four kinds of epithelial tumor cells by the ICC method. (A) Lung cancer A549 cells. (B) Lung cancer SPC-A-1 cells. (C) Liver cancer HepG2 cells. (D) Colon cancer HCT-8 cells.
Note: The magnification was 100×.
Abbreviations: ICC, immunocytochemistry; pan-ck, pan-cytokeratin.
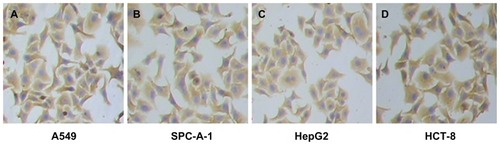
Figure 4 The mean number of enriching cancer cells from the different ratios of cancer cells to PBMC by MNP-pan-ck.
Notes: When the ratio of cancer cells to PBMC is 1:5 × 10⁶ (Group 3), the cancer cells are successfully enriched by MNP-pan-ck, and when the ratios of cancer cells to PBMC increases, the ability to enrich cancer cells is increased. The ratios of cancer cells to PBMC: Group 1, only PBMC; Group 2, 1:107; Group 3, 1:5 × 10⁶; Group 4, 1:106; Group 5, 1:5 × 10⁵; Group 6, 1:105; Group 7, 1:5 × 10⁴; Group 8, 1:104.
Abbreviations: PBMC, peripheral blood mononuclear cells; MNP-pan-ck, MNPs coupled with pan-cytokeratin antibody.
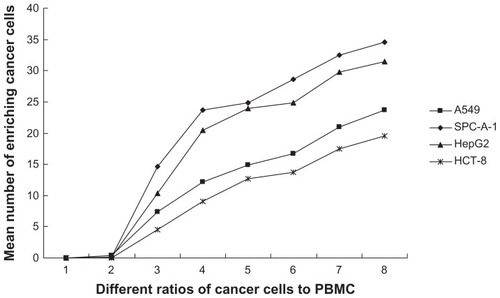
Figure 5 H&E-stained cancer cells enriched by MNPs. (A) A549 cells. (B) SPC-A-1 cells. (C) HepG2 cells. (D) HCT-8 cells. (E) No cells are enriched in the PBMC group.
Note: The magnification was 100×.
Abbreviations: H&E, hematoxylin and eosin; MNPs, magnetic nanoparticles; MNP-pan-ck, MNPs coupled with pan-cytokeratin antibody.
Collectively, in order to mimic an in vivo environment, different kinds of epithelial tumor cells were isolated from the mixture of PBMC and cancer cells by using MNP-pan-ck in vitro. Therefore, it was thought that MNP-pan-ck might separate CTCs in the peripheral blood of NSCLC patients.
Expression of Lunx and SP-A in different cancer cells by ICC and QD methods
Because A549 and SPC-A-1 cells are derived from NSCLC, and Lunx and SP-A protein belong to lung tissue-specific proteins, it is hypothesized that A549 and SPC-A-1 lung cancer cells might also express Lunx and SP-A proteins, while liver cancer HepG2 and colon cancer HCT-8 cells do not express both proteins. To verify expression of Lunx and SP-A protein in the four kinds of cancer cells, QDs conjugated with Lunx and SP-A Ab were combined with the ICC method for detection purposes.
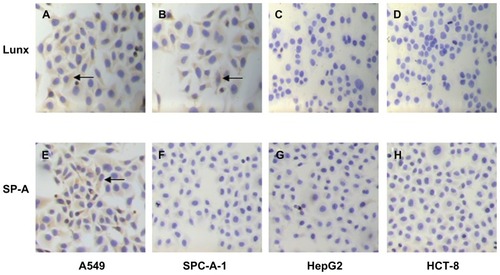
In our study, the traditional ICC method was used first to detect the expression of Lunx and SP-A protein in different cancer cells. We found that both A549 and SPC-A-1 cells express Lunx protein () and positive cell rates are 57.43% ± 2.47% and 48.26% ± 3.42%, respectively, while HepG2 and HCT-8 cells do not express Lunx protein (). At the same time, the results also show that only A549 cells express SP-A protein () and its positive cell rate was 36.25% ± 2.66%, while SPC-A-1, HepG2, and HCT-8 cancer cell lines do not express SP-A protein (). Therefore, the results prove that Lunx and SP-A protein might be lung tissue-specific proteins and important markers of lung cancer cells.
Figure 6 Imaging Lunx and SP-A protein expression in different cancer cells with the ICC method. Following ICC with anti-human Lunx or SP-A Ab, the results were observed in the cytoplasm of different kinds of cancer cells. The brown-colored deposits (arrows) located in the cytoplasm of cancer cells indicates that the cancer cells express the protein. The magnification was 100×. Lunx protein can be expressed in A549 (A) and SPC-A-1 lung cancer cells (B). Lunx protein can not be expressed in HepG2 (C) and HCT-8 cancer cells (D). SP-A protein can be expressed only in A549 lung cancer cells (E). SP-A protein can not be expressed in SPC-A-1 lung cancer cells (F), HepG2 (G) and HCT-8 cells (H).
Abbreviations: ICC, immunocytochemistry; SP-A, surfactant protein-A; Ab, antibody.
Next, in order to assess whether QDs conjuncted with Abs showed similar results with the ICC method, QDs with single-labeled Ab were used to detect the expression of Lunx and SP-A protein in four kinds of cancer cells. After four kinds of cancer cells were single-labeled with QD552-Lunx or QD625-SP-A, both A549 and SPC-A-1 lung cancer cells emit green fluorescence, which indicates that two kinds of lung cancer cells express Lunx protein (), and positive cell rates were 58.37% ± 2.54% and 50.33% ± 2.97%, respectively. On the other hand, A549 cells only emit red fluorescence (), which indicates that only A549 cells express SP-A protein and its positive cell rate is 38.28% ± 3.13%. Furthermore, neither HepG2 nor HCT-8 cells emit any fluorescence signal, which implies that these cells do not express Lunx and SP-A protein. There is no significant difference in the results between the ICC method and the method of QDs with single-labeled Ab (P > 0.05). Therefore, the results of QDs with single-labeled Ab are consistent with the ICC method, which prove that QDs with labeled Ab can be used to detect different tumor cells.
Figure 7 QDs with labeled Abs show Lunx and SP-A protein expression in different cancer cells. A549 cells (A) and SPC-A-1 cells (B) labeled with QD552-Lunx show green fluorescence. A549 cells (E) labeled with QD625-SP-A show red fluorescence and SPC-A-1 cells (F) labeled with QD625-SP-A do not show red fluorescence. A549 cells labeled with both QD552-Lunx and QD625-SP-A show both green and red fluorescence (I). SPC-A-1 cells labeled with both QD552-Lunx and QD625-SP-A show green fluorescence (J). Neither HepG2 nor HCT-8 cells emit any fluorescence signal (C, D, G, H, K and L).
Note: The magnification was 100×.
Abbreviations: Abs, antibodies; SP-A, surfactant protein-A; QDs, quantum dots.
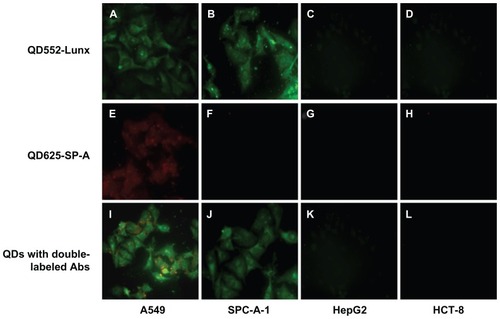
QDs show many excellent photophysical properties. One of the most important is that they have broad absorption spectra and narrow size-tunable photoluminescent emission spectra. Thus, it is hypothesized that QDs with different Abs can be used to simultaneously check different specific markers of tumors. In order to validate this hypothesis, a combination of QD552-Lunx and QD625-SP-A was used to check the above four cancer cells in vitro. As shown in , A549 cells emit not only red fluorescence, but also green fluorescence, and the positive cell rates are 75.78% ± 3.21%, while the results of SPC-A-1, HepG2, and HCT-8 cells are the same as that of QDs with single-labeled Ab. Therefore, the study demonstrates that QDs with double-labeled Abs have more sensitivity than QDs with single-labeled Ab while using the ICC method.
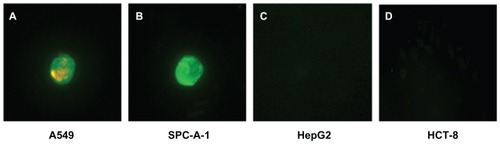
Finally, in order to mimic an in vivo environment, QDs with double-labeled Abs were used to identify four kinds of cancer cells that had been separated from the mixture of cancer cells and PBMC by MNP-pan-ck. illustrates that A549 and SPC-A-1 cells are successfully identified by using QDs with double-labeled Abs (). Because both HepG2 cells and HCT-8 cells did not express Lunx and SP-A proteins, no fluorescence signal was observed ().
Figure 8 QDs with double-labeled Abs were used to identify the four kinds of enriched cancer cells. (A) A549 cells show green and red fluorescence. (B) SPC-A-1 cells show green fluorescence. HepG2 cells (C) and HCT-8 cells (D) do not express Lunx and SP-A proteins, no fluorescence signal was observed.
Note: The magnification was 200×.
Abbreviations: Abs, antibodies; MNP-pan-ck, MNPs coupled with pan-cytokeratin antibody; PBMC, peripheral blood mononuclear cell; QDs, quantum dots.
Collectively, the expressions of Lunx and SP-A proteins were first verified by using the ICC method and QDs with single-labeled Ab. The study shows that the results of the two methods are very similar; A549 cells express both Lunx and SP-A proteins and SPC-A-1 cells only express the Lunx protein, while HepG2 and HCT-8 cells do not express either of them. Then, QDs with double-labeled Abs were used to check four kinds of cancer cells. It was found that this method could greatly improve the sensitivity of detection. Finally, QDs with double-labeled Abs identified lung cancer cells isolated by MNP-pan-ck. Therefore, this experiment found a new method for MNPs separation and QDs with double-labeled Abs identified lung cancer cells from a mixture of cancer cells and PBMC in vitro.
Detection of CTCs from NSCLC patients by MNPs and QDs
After establishment of the method for enriching and identification of lung cancer cells in vitro, the authors wanted to verify if the in vitro method could be used to isolate and identify CTCs in peripheral blood of NSCLC patients. Therefore, the blood from 32 patients with primary NSCLC, 16 patients with BLD, and 16 healthy volunteers was collected. CTCs of 26 cases in 32 NSCLC patients were collected by MNP-pan-ck (). Of 26 cases with the enriched CTCs, 21 cases were successfully identified by QDs with double-labeled Abs, including two cases out of seven Stage I and 19 cases out of 23 Stage II–IV NSCLC patients. The positive rate of identification was 80.77%, which showed that the method had a high sensitivity of isolation and identification of CTCs. No CTCs were obtained from the blood of 16 healthy volunteers and BLD using MNP-pan-ck, indicating a specificity of 100%. The results suggest that a new method had been successfully found: MNP-pan-ck collects CTCs in NSCLC patients and QDs with double-labeled Abs can be used simultaneously to identify CTCs in NSCLC patients. Therefore, the method might contribute to the discovery of early micrometastases, prognosis evaluation, monitoring of recurrence, and preparation of individual postoperative treatments about NSCLC patients. However, further clinical trials may be warranted to assess the practicality of the method.
Table 1 The isolated and identified results of different groups
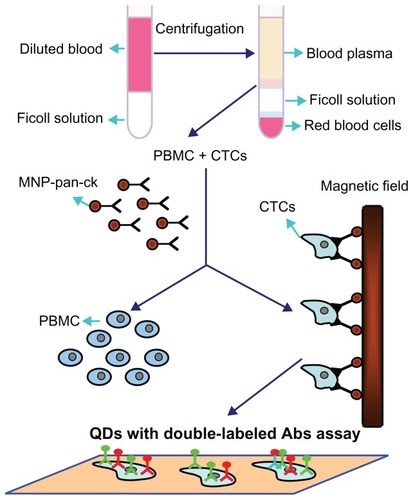
Based on the above studies, schematically illustrates the processes by which the MNP-pan-ck enrich the CTCs from NSCLC patients and QDs with double-labeled Abs are used simultaneously to identify CTCs. Firstly, peripheral blood of different clinical specimens was taken, and then PBMC and CTCs were successfully separated by density gradient centrifugation. After MNP-pan-ck was used to enrich the CTCs from the specimens, QDs with double-labeled Abs were used simultaneously to identify the CTCs.
Figure 9 Schematic illustration of the isolation and identification of CTCs with MNP-pan-ck and QDs with double-labeled antibody.
Abbreviations: Abs, antibodies; CTCs, circulating tumor cells; MNP-pan-ck, MNPs coupled with pan-cytokeratin antibody; PBMC, peripheral blood mononuclear cell; QDs, quantum dots.
Conclusion
In this study, the synthesized MNPs were effectively coupled with pan-ck Ab, and two kinds of synthesized QDs were conjugated with Lunx and SP-A Abs. QDs with double-labeled Abs were first used simultaneously to identify the CTCs of NSCLC patients collected by MNP-pan-ck. Therefore, a new method of screening micrometastases of lung cancer in peripheral blood by MNPs and QDs was successfully developed.
Acknowledgments
This study was supported by a grant from the Science and Technology (No 20082123) of Jilin Province, China. The authors are grateful to the Key Laboratory of Surface and Interface Chemistry of Jilin University for the kind provision of the method of preparation and modification of Fe3O4/polystyrene MNPs (patent delegation NO CN100425627C) and aqueous soluble CdTe QDs, and to Dr Wei Zhang (Chinese Academy of Medical Sciences) for providing the pan-ck Ab.
Disclosure
The authors report no conflicts of interest in this work.
References
- BernardsRWeinbergRAA progression puzzleNature2002418690082312192390
- KogaTTokunagaESumiyoshiYDetection of circulating gastric cancer cells in peripheral blood using real time quantitative RT-PCRHepatogastroenterology200855841131113518705345
- HeWWangHHartmannLCIn vivo quantitation of rare circulating tumor cells by multiphoton intravital flow cytometryProc Nati Acad Sci U S A2007104281176011765
- GauthierLRGranotierCSoriaJCDetection of circulating carcinoma cells by telomerase activityBr J Cancer200184563163511237383
- DevrieseLABosmaAJvan de HeuvelMMCirculating tumor cell detection in advanced non-small cell lung cancer patients by multimarker QPCR analysisLung Cancer201275224224721820198
- SherYPShihJYYangPCPrognosis of non-small cell lung cancer patients by detecting circulating cancer cells in the peripheral blood with multiple marker genesClin Cancer Res200511117317915671543
- LiQQiHZhouHXDetection of micrometastases in peripheral blood of non-small cell lung cancer with a refined immunomagnetic nanoparticle enrichment assayInt J Nanomedicine201162175218122114481
- LuAHSalabasELSchüthFMagnetic nanoparticles: synthesis, protection, functionalization, and applicationAngew Chem Int Ed Engl20074681222124417278160
- DilnawazFSinghAMohantyCDual drug loaded superparamagnetic iron oxide nanoparticles for targeted cancer therapyBiomaterials201031133694370620144478
- JainTKMoralesMASahooSKIron oxide nanoparticles for sustained delivery of anticancer agentsMol Pharm20052319420515934780
- SmithAMNieSChemical analysis and cellular imaging with quantum dotsAnalyst2004129867267715344262
- GoldmanERMedintzILMattoussiHLuminescent quantum dots in immunoassaysAnal Bioanal Chem2006384356056316344927
- PantelKBrakenhoffRHDissecting the metastatic cascadeNat Rev Cancer20044644845615170447
- MitasMHooverLSilvestriGLunx is a superior molecular marker for detection of non-small cell lung cancer in peripheral blood [corrected]J Mol Diagn20035423724214573783
- BetzCPapadopoulosTBuchwaldJSurfactant protein gene expression in metastatic and micrometastatic pulmonary adenocarcinomas and other non-small cell lung carcinomas: detection by reverse transcriptase-polymerase chain reactionCancer Res19955519428342867671236
- DempoKSatohMTsujiSImmunohistochemical studies on the expression of pulmonary surfactant apoproteins in human lung carcinomas using monoclonal antibodiesPathol Res Pract198718256696752825147
- GergesNJabadoNBiomarkers in cancer micrometastasis: where are we at?Bioanalysis20102588189921083219
- MassartRPreparation of aqueous magnetic liquids in alkaline and acidic mediaIEEE Trans Magn198117212471248
- LuSLForcadaJPreparation and characterization of magnetic polymeric composite particles by miniemulsion polymerizationJ Polym Sci Pol Chem2006441341874203
- YanFLiJZhangJJPreparation of Fe3O4/polystyrene composite particles from monolayer oleic acid modified Fe3O4 nanoparticles via miniemulsion polymerizationJ Nanopart Res2009112289296
- ZhaoKLiJWangHZStoichiometric ratio dependent photoluminescence quantum yields of the thiol capping CdTe nanocrystalsJ Phys Chem C20071111556185621
- XuXFriedmanGHumfeldKDSynthesis and utilization of monodisperse superparamagnetic colloidal particles for magnetically controllable photonic crystalsChem Mater200214312491256
- WangPCChiuWYLeeCFSynthesis of iron oxide/poly(methyl methacrylate) composite latex particles: Nucleation mechanism and morphologyJ Polym Sci Pol Chem2004422256955705
- SacannaSPhilipseAPPreparation and properties of monodisperse latex spheres with controlled magnetic moment for field-induced colloidal crystallization and (dipolar) chain formationLangmuir20062224102091021617107023
- DengYWangLYangWPreparation of magnetic polymeric particles via inverse microemulsion polymerization processJ Magn Magn Mater200325716978
- RamírezLPLandfesterKMagnetic polystyrene nanoparticles with a high magnetite content obtained by miniemulsion processesMacromol Chem Phys200320412231
- WangYTengXWWangJSSolvent-free atom transfer radical polymerization in the synthesis of Fe2O3@polystyrene core–shell nanoparticlesNano Lett200336789793
- VestalCRZhangZAtom transfer radical polymerization synthesis and magnetic characterization of MnFe2O4/polystyrene core/shell nanoparticlesJ Am Chem Soc200212448143121431312452698
- MichaletXPinaudFFBentolilaLAQuantum dots for live cells, in vivo imaging, and diagnosticsScience2005307570953854415681376
- GaoXCuiYLevensonRMIn vivo cancer targeting and imaging with semiconductor quantum dotsNat Biotechnol200422896997615258594