Abstract
Recently published reports have described possible cellular therapy approaches to regenerate muscle tissues using arterial route delivery. However, the kinetic of distribution of these migratory stem cells within injected animal muscular dystrophy models is unknown. Using living X-ray computed microtomography, we established that intra-arterially injected stem cells traffic to multiple muscle tissues for several hours until their migration within dystrophic muscles. Injected stem cells express multiple traffic molecules, including VLA-4, LFA-1, CD44, and the chemokine receptor CXCR4, which are likely to direct these cells into dystrophic muscles. In fact, the majority of intra-arterially injected stem cells access the muscle tissues not immediately after the injection, but after several rounds of recirculation. We set up a new, living, 3D-imaging approach, which appears to be an important way to investigate the kinetic of distribution of systemically injected stem cells within dystrophic muscle tissues, thereby providing supportive data for future clinical applications.
Introduction
Attempts to repair muscle damage in Duchenne muscular dystrophy (DMD) by transplanting myogenic progenitors directly into muscles are facing the problem of cell survival and the limited migration of these cells in the muscles.Citation1 The delivery of myogenic stem cells to the sites of muscle lesions via systemic circulation is a potential alternative approach to treat this disease.Citation2,Citation3 However, intravenously injected cells may become trapped in other organs (eg, liver, spleen, lung), resulting in only a small portion entering the muscle microvasculature and migrating into dystrophic muscles.Citation4 The authors of this paper contributed to the development of a cellular therapy to regenerate muscle tissues using arterial route delivery. The success of this protocol was mainly due to widespread distribution of donor stem cells through the muscle capillary network.Citation5
Elucidation of the kinetic of distribution of intra-arterially injected stem cells within injected muscular dystrophy animal models is unknown. Therefore, in the present paper, we focused on the stem cell trafficking of intra-arterially injected dystrophic muscle tissues, using living X-ray computed microtomography (micro-CT). Using this approach, we reached resolutions in the submicron range (up to 300 nm), which provided the opportunity to track intra-arterially injected stem cells in living DMD animal modelsCitation6 with high single-cell sensitivity.
Micro-CT is one of the most advanced non-invasive techniques aimed at the qualitative and quantitative three-dimensional evaluation of tissues under different conditions, providing high spatial resolution images (from 10 μm to 1 μm) with high signal-to-noise ratio.Citation7,Citation8 We explored the use of micro-CT and synchrotron X-ray radiation for the detection of stem cells, in order to achieve high spatial resolution of 7.5 μm and a wide range of grayscale values (corresponding to different X-ray absorption coefficients). Compared to MRI, the major limitation of micro-CT is radiation exposure, which depends on the detector technology used and the required resolution. It is worth noting that, with the new advanced scanners for micro-CT, volume scans with isotropic spatial resolution of approximately 10 μm can be acquired with dedicated systems within a few minutes, while an X-ray exposure below 100 mGy for scanning a whole rat (or below 20 mGy for scanning the skull) makes small-animal micro-CT feasible.Citation9 A major strength of small-animal micro-CT is that it provides clinically relevant information regarding pathophysiology, organ motion, and/or dynamic distribution of contrast agents. In addition, it provides, for the first time, a 3D visualization of labeled stem cell distribution, after intra-arterial injection. It can offer image data at resolutions much higher than what is achievable with clinical scanners, providing deeper insights into pathophysiological processes. For all these reasons, micro-CT imaging could be applied when investigating the homing specificity of various stem cell subtypes or genetically engineered stem cells in different cell-based therapies.Citation7,Citation8
Unfortunately, due to mechanical limitations and for the safety of the animals, we were only able to scan and visualize the injected leg. Therefore, to circumvent this problem and to monitor the presence of human cells in the other muscles and organs of the body, the injected stem cells were quantified, thereby combining real-time PCR analysis with the micro-CT technique.
In fact, the majority of the intra-arterially injected stem cells accessed the muscle tissues not immediately after the intra-arterial injection, but after several rounds of recirculation, during the first two hours after infusion. This is the first study of the kinetic of distribution of intra-arterially injected human stem cells into the capillary system of downstream dystrophic muscles. The efficient transplantation of stem cells into the muscle of dystrophin-deficient mice reinforced the utility of intra-arterial delivery of cells as a viable approach for cell-based clinical therapies of neuromuscular disease, such as DMD.
Materials and methods
Isolation of human CD133+ cells from blood
Peripheral blood was obtained from normal volunteers after informed consent, according to the guidelines of the Committee on the Use of Human Subjects in Research at the Policlinico Hospital of Milan (Milan, Italy). Each blood sample was formed by a pool of four samples collected from 18- to 50-year-old healthy volunteers. One hundred milliliters of blood were diluted 1:1 in RPMI 1640 medium (Invitrogen Life Technologies, Grand Island, NY) and centrifuged for 10 minutes at 1500 rpm to remove the platelet-rich plasma phase. Mononuclear cells (MNC) were obtained using Histopaque® 1.077 g/mL (Sigma-Aldrich, St. Louis, Missouri, USA) density centrifugation. The CD133+ MNC fraction was isolated with microbead selection, using MidiMACS™ and LS columns (Miltenyi Biotech, Bergisch-Gladbach, Germany). The MNC cells were suspended in PBS 0.1% BSA and 2 mM EDTA buffer, and directly labeled by incubation for 30 minutes at 4°C with a monoclonal antibody (clone AC133, epitopa1) coupled with microbeads. The cells were washed in separation buffer and laid on an LS column placed in a magnetic field. The magnetically labeled CD133+ cells were retained on the column, while unlabeled CD133+ cells passed through. After removing the column from the magnetic field, the magnetically retained CD133+ cells were eluted as a positively selected fraction. Living cells were counted with a Burker chamber, using trypan blue exclusion. After selection, an aliquot of the CD133+ cell fraction was analyzed for assessment of purity.
Labeling of CD133+ cells with Endorem
Stem cells were labeled with 250 μg/mL nanoparticles of Fe3O4 (Endorem) (Laboratorie Guerbet, Aulnay-Sous-Bois, France). Endorem, which is available in the form of an aqueous colloid, is a commercially available contrast agent based on dextran-coated iron oxide nanoparticles; it has been approved for human use. The crystal size varies from 4.3 to 5.6 nm, and the whole particle size is 150 nm. The mean iron concentration in a 2 mL sample, containing 1 million cells, was 88.5 μg/mL, which corresponds to an average value of 177 pg of iron per cell. It is known that NP can enter into cells and accumulate in mitochondria, vesicles, phagosomes, and lysosomes, although toxic effects caused by NP exposure still remain controversial. Although the mechanism underlying NP-induced cytotoxicity is not completely understood, it could be related to inflammatory response and oxidative stress. In particular, it was demonstrated that iron oxide NP, similar to Endorem, could be internalized in HUVEC cells quite efficiently within a few hours; however, it can provoke cell death 24 hours post-exposure, most likely through the oxidative stress pathway. Although these NPs are eliminated through urine when injected in vivo, they could induce toxicity in some organs, while sparing the brain and heart. According to this evidence, we decided to label our cells at different time-points, not exceeding 24 hours. Cells were visualized as blue spots after Prussian blue staining, and counted.
In vivo transplantation
A breeding colony of homozygous scid/mdx mice was previously established.Citation6 The animals were analyzed at different time-points (0, 2, 13, and 24 hours). At each time-point, the mice were anesthetized with ketamine hydrochloride (80 mg/kg) and xylazine (10 mg/kg) – providing anesthesia during the entire scanning period – and injected intra-arterially with 5 × 10⁵ labeled CD133+ cells (n = 3 for each time-point), resuspended in 100 μL of PBS. The animals were euthanized by cervical dislocation at the end of micro-CT acquisition, and muscle tissues were removed and frozen in liquid-nitrogen-cooled isopentane. All procedures involving living animals conformed to Italian law (DL vo 116/92).
Micro-CT procedure
For in vivo scans, the mice were anesthetized and positioned with the right leg fully fixed in a cylindrical plastic holder. Only the leg was radiated, thus minimizing the effects of radiation. A micro-CT system (European Synchrotron Radiation Facility, Grenoble, France) was used to scan the leg of each mouse, at an isotropic pixel size of 7.5 μm, with a monochromatic beam and a sample–detector distance of 2 mm. Selection of the scan energy and voxel size (scanning increment) was based on optimizing the requirements of scanning time and tissue detail, and minimizing exposure to radiation. Accuracy in the images was determined by the X-ray dose given to the animal. Dose is a special concern for in vivo micro-CT and is a function of the energy deposited through photon absorption and energy loss via Compton scattering interactions. The smaller micro-CT voxels (relative to clinical CT) require much higher doses, as any voxel, independent of its size, must interact with a certain number of X-ray photons for adequate image quality. Therefore, in order to compensate for the reduction of voxel size, the photon fluence must be much larger in micro-CT, to achieve a high signal-to-noise ratio.Citation10 The total radiation dose for each mouse during the synchrotron acquisition was limited to 40–50 Gy, and the X-ray energy values to 24 keV. An energy level of 24 keV was considered, and in each measurement, 700 projections were obtained with a counting time of 0.15 seconds per projection. The resolution of 7.05 microns results in a field of view of approximately 14.5 × 14.5 × 7 mm3. A Gadox scintillator associated with a FReLoN 2048 · 2048 pixel CCD camera was used as a detector, with the pixel size set to 1.65 μm, yielding a field of view of about 3 mm. Isotropic slice data were obtained and reconstructed into 2D images. We performed investigations on three different consecutive regions of interest (ROI), along the z direction (ie, parallel to the femur), for a total thickness of 5.4 mm ().
Figure 1 Micro-CT procedure. (A) Tomograms of the tight region at 0, 2, 13, and 24 hours after injection; the femur zone has been subtracted to calculate the volume fraction of the Endorem-marked cells. Some marked cells are necessarily cut out in this way, but their amount is negligible with respect to the total amount present in the region of interest. (B) Histogram and detail for the investigated mouse, injected with 500,000 cells.
Abbreviation: CT, computed tomography.
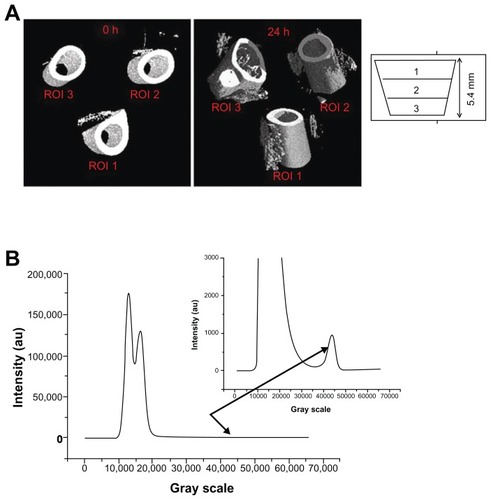
Image reconstruction
Microcomputed tomography uses the attenuation of X-rays by tissues as the signal for generating an image.Citation11 To create a CT image, a series of projection images are taken around the animal or sample, in equally spaced angular intervals.Citation12 The X-ray source produces a cone-shaped beam, which is projected through the specimen, with the resultant radiographic density of the specimen projected onto a 2D detector. The multiple projections are combined, using a reconstruction method that is based on the filtered back projection, implemented with a projection algorithm, as previously published.Citation13 The resultant micro-CT scan is a 3D matrix of voxels with values proportional to the mean linear attenuation coefficient of the material within each voxel. The image obtained on the CCD-based detector depends on the linear absorbing coefficients of the phases/materials that compose the investigated specimen. In the current study, in order to distinguish the injected cells, they were marked with Endorem, resulting in higher X-ray-absorbing features than the tissues around them. Once the reconstruction of the field of view area was accomplished, using specific algorithms, the obtained volume was analyzed using VGStudio MAX 1.2 software, which allows visualizing and quantifying the different phases/materials present in the investigated volume.Citation14–Citation16 The histogram for the analyzed mouse is shown in . The first peak (from the left) corresponds to air, the second one is an overlapping of the signal coming from fat and muscle, and the third one (zoomed for better viewing) comes from labeled cells and bone. Using the segmentation facility in the VGStudio MAX software, it was possible to quantify the fat, muscle, bone, and cells present in the investigated volume. As it was experimentally impossible to view exactly the same volume for the four measurements (at 0, 2, 13, and 24 hours), we corrected the position by quantifying the total fat + muscle volume for each of the four measurements and rescaling it (horizontally) until an overlap was achieved. The investigated area of the leg was divided vertically into 1000 slices, 0 corresponding to the upper part of the field of view, and 1000 to the lower part.
Absolute real-time PCR (Q-PCR)
RNA was extracted from the ischium-crural (IC), quadriceps (QUA), diaphragm (DIA), and gastrocnemius (GAS)Citation17 of both legs and kidney, spleen, liver, heart, and lung. The weight of each muscle/organ was taken. This procedure was followed for the mice injected with 5 × 10⁵ labeled CD133+ cells at five different time points (0, 30, 60, 90, and 120 minutes). In addition, three samples of 5 × 10⁵ CD133+ cells were collected. Total RNA was extracted with TRIzol ® Reagent, as described by the manufacturer’s protocol (Invitrogen Life Technologies, Grand Island, NY). The samples were treated with RNase-Free DNase (Promega, Madison, WI), in order to avoid amplification of genomic DNA. First strand cDNA was prepared by using SuperScript® III First-Strand Synthesis System for RT-PCR (Invitrogen Life Technologies, Grand Island, NY), starting from 2 μg total RNA with oligo(dT) primers.Citation12–Citation18 Absolute real-time PCR (Q-PCR) was used in order to have an absolute quantification of human GAPDH in the muscles of the injected mice. The calibration curve was accomplished by means of a plasmid carrying the sequence of human GAPDH: 2 ng of plasmid cDNA were serially diluted (1:10) eight times. This curve was used to obtain an absolute quantitation of human cells in murine muscles and organs. The sequences of GAPDH gene were F: 5′-GTGGCAAAGTGGAGATTGTTGCC-3′; R: 5′-GTAGATGACCCGTTTGGCTCC-3′. GAPDH levels were measured in real time by SYBR® Green technique (EuroClone, Pero, Milan, Italy). The expression of each sample of the mouse-specific GAPDH housekeeping gene was also determined. Analysis of statistical significance was determined by one-way ANOVA (P < 0.05).
Results
Labeling of CD133+ cells with Endorem
Human mononucleated cells obtained from peripheral blood were sorted for the expression of CD133 antigen, as previously described. The human stem cells isolated from peripheral blood for the expression of CD133 were labeled with iron oxide nanoparticles (Fe3O4) (Endorem). Cells were visualized as blue spots after Prussian blue staining (), and their count revealed that increasing the labeling times does not increase the number of labeled cells or the number of iron oxide particles inside the cells. After 24 hours of labeling, the percentage of labeled cells increased 85.6% ± 8.3%.
Figure 2 Endorem+ CD133+ stem cells.
Notes: CD133+ stem cells labeled with iron oxide nanoparticles (Endorem). Cells were stained with Prussian blue and taken at 40× magnification.
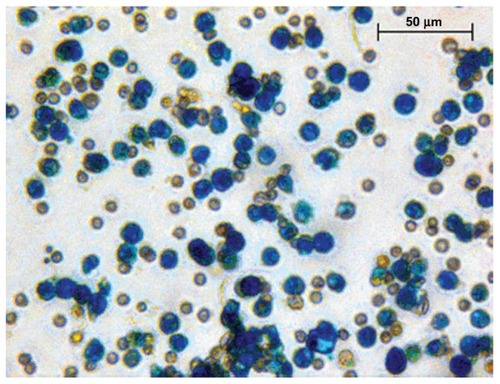
Next, whether labeling affects cell viability or function was investigated. Up to 120 hours after labeling with iron oxide nanoparticles, trypan blue uptake in the labeled CD133+ stem cells was not significantly different from the controls, with 96.1% ± 2.1% of the cells being negative for trypan blue after labeling (n = 6). The staining performed by Prussian blue confirmed the presence of iron oxide particles inside the cell, observed as endoplasmic, reticulum membrane-bound clusters within the cell cytoplasm (data not shown). Vesicles containing Fe particles surrounded by a membrane indicated an endocytotic process of Fe uptake (data not shown).
In vivo micro-CT experiments after injection of blood-derived labeled CD133+ cells
To evaluate the fate of the cells after injection into the model animals, the scid/mdx mice were injected with 5 × 10⁵ cells, and the visualization of the labeled CD133+ cells was repeated in the same mouse, immediately after the injection (T = 0) and at 2, 13, and 24 hours after the treatment (T = 2, 13, 24, respectively). The images obtained depend on the linear absorbing coefficients of the phases/materials that compose the investigated specimen. In order to be able to distinguish the injected cells, they were labeled with Endorem, resulting in higher X-ray absorbing properties with respect to the tissues around them. As the mouse was alive during the experiment, the cells remaining inside the vessels, and thus moving into the bloodstream, could not be reconstructed in the tomographic images. Thus, the visualized cells are only those that actually migrated into the muscular tissue.
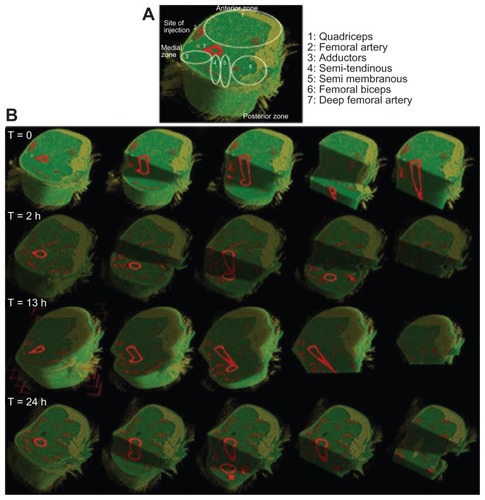
Regarding cellular distribution (), as expected, immediately after the transplantation, the injected stem cells localized around the site of injection, in close proximity to the femoral artery (). Then, the major part of the injected stem cells entered the blood circulation, and within 2 hours, they moved through the femoral artery into its branches, such as the lateral femoral circumflex, the profunda femoris, and its perforating branches, and reached the IC muscles – semi-tendinous and semi-membranous – in the posterior part of the leg (). After a longer time, circulating injected stem cells reached the anterior part of the injected leg and localized in the QA muscle. It was calculated that 10% of the injected stem cells in the scanned volume could be visualized immediately at the site of injection (ie, around the femoral artery within the vastus medial quadriceps), whereas 90% of the rest of the scanned cells distributed in the IC and QA muscle tissues within two hours after the injection. These observations suggested a progressive distribution and migration of the injected cells that entered into the circulation system and spread over all the muscles. Considering that the mouse’s weight was 25–30 grams, the blood volume was around 1.5 mL, and cardiac output was 24 mL per minute, we calculated approximately 16 complete blood circulations per minute. This means that the injected cells, visualized by micro-CT inside the dystrophic muscles after two hours, correspond to approximately 200 passages of injected cells into the circulation of the injected limbs.
Figure 3 Micro-CT images of injected muscle. (A) Reconstruction of the muscle injected with human cells and its muscle compartments. (B) Images of micro-CT showing the distribution of the cells after each time-point.
Abbreviation: CT, computed tomography.
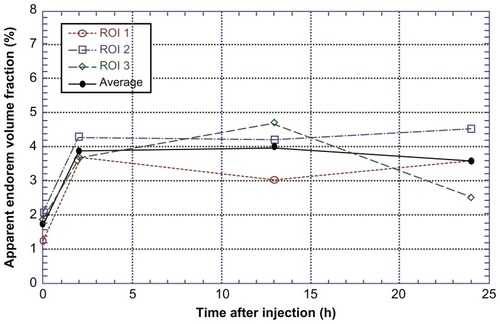
It was possible to distinguish and quantify the fat, muscle, bone, and cell volumes in the investigated ROI. As it was experimentally impossible to view exactly the same volume for the four measurements (at 0, 2, 13, and 24 hours), in order to be sure to consider exactly the same region for Endorem volume fraction evaluation, the position was corrected by quantifying the total fat + muscle volume as a function of the slice number in the z direction for each of the four measurements, and rescaling it until an overlap was achieved (). The investigated area of the leg was divided vertically into 1000 slices, 0 corresponding to the upper part of the field of view and 1000 to the lower part. The Endorem volume fraction increased within two hours after injection, reaching a plateau and then remaining constant until 24 hours ().
Figure 4 Quantification of different volumes in the investigated ROI.
Notes: Overlapping of the fat + muscle signal for the four measurements in mice injected with 500,000 cells: from the left, the first peak corresponds to air; the second one is an overlapping of the signal coming from fat and muscle. In the magnification, the third one comes from labeled cells and bone.
Abbreviation: ROI, region of interest.
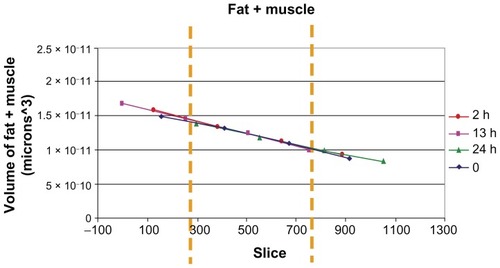
Figure 5 Endorem volume fraction in injected muscles.
Note: The apparent Endorem volume fraction increased up to two hours, then in reached a plateau and remained constant until 24 hours.
Abbreviation: ROI, region of interest.
QPCR measurements
In parallel with these studies, a QPCR was performed of the muscles and organs of the injected scid/mdx mice, euthanized 0, 30 minutes, 60 minutes, 90 minutes, and 2 hours after cellular transplantation. We decided to investigate different organs, such as the liver, spleen, and kidneys, for the presence of human cells, in order to verify their correct amount and the efficacy of their migration in the circulation. As we constructed a plasmid expressing human GAPDH, we calculated the picograms of human GAPDH per muscle/organ per grams of muscle/organ. We demonstrated that a large amount of cells were present in the IC and in DIA of the mice, and their peak was reached two hours after the transplantation, with a significant increase of the cells with the time elapsed from the injection (). In the other muscles of the injected leg, QUA and GAS, the presence of human cells was not as noticeable, and only in GAS did their distribution seem to be in correlated with time (). As mentioned above, we also investigated the organs and found that the major concentration of cells was present in the filter organs, such as the spleen and kidneys, while in the lungs, and especially in the liver, their presence was significantly diminished ().
Figure 6 Q-PCR analysis of injected muscles and organs. Q-PCR of injected scid/mdx mice euthanized 0, 30 minutes, 60 minutes, 90 minutes, and 2 hours after cellular transplantation: the graphs are related to (A) muscles of injected leg; (B) muscles of contralateral leg; (C) DIA; and (D) organs.
Abbreviations: DIA, diaphragm; Q-PCR, real-time polymerase chain reaction.
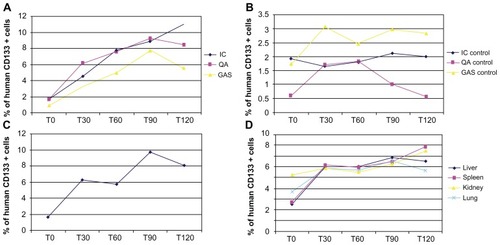
From a clinical point of view, it would be interesting to assess whether and how many transplanted cells were able to reach the non-injected leg. We conducted the same experiments for the contralateral muscles, and we demonstrated that transplanted CD133+ cells were able to reach these muscles also, being present in various concentration in all muscles analyzed (). We calculated that only 4% of the 500,000 intra-arterially injected cells were visualized in the scanned limb at the time of infusion (QUA 1.7%, GAS 0.9%, IC 1.7%); 30 minutes after the infusion, the percentage of visualized cells increased three-fold: QUA 6%, GAS 3.2%, IC 4.5%; 60 minutes after the infusion, the number of cells increased significantly, to 20%, and remained plateaued 120 minutes after infusion (QUA 8.4%, GAS 5.6%, IC 11%) (). In the contralateral muscle tissues, we found a slight increase in the number of injected cells, from T0 (QUA 0.6%, GAS 1.7%, IC 1.9%) to T120 (QUA 0.5%, GAS 2.9%, IC 2%), only in the GAS () and, similarly in the DIA (). The number of injected cells entrapped into the tested organs remained unchanged (about 12% of the total injected stem cells) during all the time-points after infusion ().
Discussion
In the past decade, different techniques have been developed to allow efficient visualization of biological processes in living animals, and, especially, not to alter the biological processes themselves. Detection by MRI of magnetic nanoparticle-labeled stem cells might serve as a suitable means to achieve this objective; however, this technique has some limitations, such as the gradual loss of MRI cell signal due to cell division.Citation18 Moreover, other techniques, such as in vivo BLICitation19 and in vivo fluorescence imaging,Citation20,Citation21 are limited by the large number of cells required and by the poor quality of the images visualized.Citation22 Micro-CT is now a well established imaging methodology that can be used to scan small animals, such as mice, and generate 3D image datasets, providing image resolution scaled to small animals, as well as contrast equivalent to that provided by clinical whole-body CT.Citation23 To allow a high-quality detection of tracking cells injected in vivo, this method requires either a monochromatic X-ray source, which is best achieved with synchrotron radiation. Combining nanoparticle cell labeling and synchrotron radiation, we explored the use of X-ray micro-CT as an experimental technique with high spatial resolution of 1.65 μm, for the detection of stem cells. By using this approach, it was possible to obtain 3D highly spatial resolution of the scanned areas of the injected leg during the first hours after intra-arterial infusion, providing, for the first time, an idea of the kinetics of distribution of injected stem cells within dystrophic muscle tissues. Moreover, the combination of this technique with Q-PCR made it possible to visualize and count the human cells injected into the muscle and organ tissues of dystrophic mice. The 3D images of the scanned injected leg 120 minutes after infusion show that the injected cells were first located in the anterior part of the muscles, they reached the medial and posterior zones, and then finally returned to the anterior zone. We calculated that only 4% of intra-arterially injected cells were visualized in the scanned limb at the time of infusion, whereas the number of cells increased significantly with time, distributing into the other muscular compartments and organs. In particular, we found a slightly increase in the number of injected cells in the contralateral GAS muscle (starting at 1.5% and ranging to 2.8% 120 minutes after infusion), while in IA and QUA, the percentage of visualized cells remained more or less the same.
All these data suggest that the majority of the stem cells injected intra-arterially entered into the circulation system and migrated within dystrophic muscles after serial passages within the capillaries of the injected leg. The environment of the dystrophic muscles made it possible to recruit the transplanted cells from the vessels following the secretion of specific cytokines and other inflammatory molecules. In the muscle, human CD133+ cells fused with dystrophic myofibers and participated in muscle regeneration. Since the publication of several works regarding intra-arterial injection of stem cells, this is the first demonstration of the kinetics of distribution of transplanted stem cells, characterized by serial passages of these cells through the arteries of the treated leg after their injection.
In our work, we demonstrated that migration of intra-arterially delivered stem cells to dystrophic muscles is time dependent, and that the number of migrating cells increases specifically in damaged muscle tissues. Moreover, our findings suggest that a better understanding of the kinetic of distribution and migration of the stem cells is crucial for enhancing the therapeutic potential of these cells in tissue repair.
Acknowledgements
This work was supported in part by grants from the Fondazione Cariplo and Optistem (Grant number 223098) and by the Associazione Amici del Centro Dino Ferrari and Associazione La Nostra Famiglia Fondo DMD Gli Amici di Emanuele.
Disclosure
No competing financial interests exist.
References
- TeoAKVallierLEmerging use of stem cells in regenerative medicineBiochem J20104281112320423328
- FariniARaziniPErraticoSTorrenteYMeregalliMCell based therapy for Duchenne muscular dystrophyJ Cell Physiol2009221352653419688776
- JinKSunYXieLComparison of ischemia-directed migration of neural precursor cells after intrastriatal, intraventricular, or intravenous transplantation in the ratNeurobiol Dis200518236637415686965
- ChenJSanbergPRLiYIntravenous administration of human umbilical cord blood reduces behavioral deficits after stroke in ratsStroke200132112682268811692034
- BenchaouirRMeregalliMFariniARestoration of human dystrophin following transplantation of exon-skipping-engineered DMD patient stem cells into dystrophic miceCell Stem Cell20071664665718371406
- FariniAMeregalliMBelicchiMT and B lymphocyte depletion has a marked effect on the fibrosis of dystrophic skeletal muscles in the scid/mdx mouseJ Pathol2007213222923817668421
- VillaCErraticoSRaziniPIn vivo tracking of stem cell by nanotechnologies: future prospects for mouse to human translationTissue Eng Part B Rev201117111120846051
- VillaCErraticoSRaziniPStem cell tracking by nano-technologiesInt J Mol Sci20101131070108120480000
- BooneJMVelazquezOCherrySRSmall-animal X-ray dose from micro-CTMol Imaging20043314915815530250
- BadeaCTDrangovaMHoldsworthDWJohnsonGAIn vivo small-animal imaging using micro-CT and digital subtraction angiographyPhys Med Biol20085319R31935018758005
- SchusterDMHalkarRKMolecular imaging in breast cancerRadiol Clin North Am2004425885908vivii15337423
- HoldsworthDWThorntonMMDrostDWatsonPHFraherLJHodsmanABRapid small-animal dual-energy X-ray absorptiometry using digital radiographyJ Bone Miner Res200015122451245711127209
- FangSWangJJiangHExperimental study on the therapeutic effect of positron emission tomography agent [18F]-labeled 2-deoxy-2-fluoro-d-glucose in a colon cancer mouse modelCancer Biother Radiopharm201025673374021204768
- PeyrinFSalomeMCloetensPLaval-JeantetAMRitmanERuegseggerPMicro-CT examinations of trabecular bone samples at different resolutions: 14, 7 and 2 micron levelTechnol Health Care199865–639140110100941
- SalomeMPeyrinFCloetensPA synchrotron radiation microtomography system for the analysis of trabecular bone samplesMed Phys199926102194220410535638
- TorrenteYGavinaMBelicchiMHigh-resolution X-ray microtomography for three-dimensional visualization of human stem cell muscle homingFEBS Lett2006580245759576417022981
- BoydSKDavisonPMullerRGasserJAMonitoring individual morphological changes over time in ovariectomized rats by in vivo micro-computed tomographyBone200639485486216757220
- LouieAYHuberMMAhrensETIn vivo visualization of gene expression using magnetic resonance imagingNat Biotechnol200018332132510700150
- MayerhoferRArakiKSzalayAAMonitoring of spatial expression of firefly luciferase in transformed zebrafishJ Biolumin Chemilumin19951052712758533608
- BrownEBCampbellRBTsuzukiYIn vivo measurement of gene expression, angiogenesis and physiological function in tumors using multiphoton laser scanning microscopyNat Med20017786486811433354
- PaderaTPStollBRSoPTJainRKConventional and high-speed intravital multiphoton laser scanning microscopy of microvasculature, lymphatics, and leukocyte-endothelial interactionsMol Imaging20021191512920856
- KimDHongKSSongJThe present status of cell tracking methods in animal models using magnetic resonance imaging technologyMol Cells200723213213717464188
- RitmanELSmall-animal CT – its difference from, and impact on, clinical CTNucl Instrum Methods Phys Res A2007580296897018836514