Abstract
Quantum dots (QDs) show promise as novel nanomaterials for sentinel lymph node (SLN) mapping through their use in noninvasive in vivo fluorescence imaging, and they have provided remarkable results. However, in vivo fluorescence imaging has limitations mainly reflected in the strong autofluorescence and low deepness of tissue penetration associated with this technique. Here, we report on the first use of self-illuminating QDs for mouse axillary SLN mapping by bioluminescence resonance energy transfer, which was found to overcome these limitations. We used CdTe/CdS QDs synthesized in aqueous solution to conjugate a mutant of the bioluminescent protein, Renilla reniformis luciferase. The nanobioconjugates obtained had an average hydrodynamic diameter of 19 nm, and their luminescence catalyzed by the substrate (coelenterazine) could penetrate into at least 20 mm of hairless pigskin, which could be observed using an in vivo imaging system equipped with a 700 nm emission filter. Conversely, the fluorescence of the nanobioconjugates penetrated no more than 10 mm of pigskin and was observed with a strong background. When 80 μL of the nanobioconjugates (containing about 0.5 μmol/L of QDs) and 5 μL of coelenterazine (1 μg/μL) were intradermally injected into a mouse paw, the axillary SLN could be imaged in real time without external excitation, and little background interference was detected. Furthermore, the decayed luminescence of QD-Luc8 in SLNs could be recovered after being intradermally reinjected with the coelenterazine. Our data showed that using self-illuminating QDs, as opposed to fluorescence QDs, has greatly enhanced sensitivity in SLN mapping, and that the SLN could be identified synchronously by the luminescence and fluorescence of the self-illuminating QDs.
Introduction
During the past decade, semiconductor quantum dots (QDs) have come under the spotlight as biomedical imaging and diagnostic probes, due to their excellent optical properties compared with organic fluorescent dyes, such as a broad absorption, a narrow fluorescence emission, and a high quantum yield.Citation1–Citation6 One of the most attractive applications of such fluorescent QDs is their use for in vivo sentinel lymph node (SLN) mapping and imaging,Citation7–Citation15 as SLN mapping is a popular management option in cancer surgery. It is known that SLN is the first lymph node (or group of nodes) to receive lymphatic drainage from a primary tumor.Citation16 SLN mapping and biopsies are very important techniques for surgeons to decide whether a patient requires more or less surgery, as lymph node metastasis is one of the most important prognostic signs of the spread of cancer. QDs subcutaneously injected into animal bodies can migrate easily and quickly into lymph nodes near the injection site through passive targeting, and the fluorescence emitted by the QDs trapped in the SLN, deep within the tissue, can be directly visible through skin and muscle. In addition, visual inspection would help the surgeon to judge whether or not all of the SLNs have been removed from the node field.Citation17 SLN visual mapping using vital blue dyes is a traditional method that is widely used in current cancer clinics.Citation18 However, blue dyes located within deep tissue are hard to observe through their blue color, unless the tissue is exposed to air after surgical management. SLN mapping using QD fluorescence can reduce the need for surgical management; this is a great advantage over the traditional methods.
However, two challenges facing in vivo fluorescent imaging are that the strong background autofluorescence is difficult to avoid, and a part of the external exciting light is absorbed and scattered by the tissue,Citation19 so that the fluorescence intensity emitted by the QDs in deep tissue is sometimes too low to be detected or just simply too weak to be distinguished from the background autofluorescence. To overcome this limitation, So et al,Citation20,Citation21 Xing et al,Citation22 Ma et al,Citation23 and Kim et al,Citation24 developed self-illuminating QDs based on the principle of bioluminescence resonance energy transfer (BRET). The fluorescence emitted by these QDs can be illuminated by the bioluminescence produced by the reaction between the enzymes and substrate around the QD surface. Therefore, self-illuminating QDs can emit bright fluorescence with no requirement for external excitation, which exhibits extremely high sensitivity for use in in vivo imaging. Recently, Kosaka et alCitation25 applied self-illuminating QDs to in vivo lymphatic imaging in mice. However, the luminescence life of the self-illuminating QDs in vivo was short, and how to recover the luminescence was not investigated.
In this work, we report the use of self-illuminating QDs for SLN mapping and imaging. We found that the decayed luminescence of self-illuminating QDs in SLN could be reilluminated after being intradermally reinjected with coelenterazine and the SLN could be identified synchronously by the luminescence and fluorescence of the self-illuminating QDs. We used 3-mercaptopropionic acid (MPA)-capped CdTe/CdS QDs with a fluorescence spectrum exceeding 700 nm in wavelength (near-infrared [NIR] region) to prepare self-illuminating QDs for mouse SLN mapping and imaging. When compared with the organometallic approaches used to synthesize CdTe QDs, the QDs synthesized via such aqueous solution synthetic methods can be obtained easily because of the simplicity, safety, relatively low reaction temperature, and low cost associated with such aqueous methods.Citation26,Citation27 Therefore, CdTe/CdS QDs used in this study were synthesized in aqueous solution.
Experimental
Materials
The fusion protein purification kit was purchased from TOYOBO (Osaka, Japan). 1-ethyl-3-(3-dimethylaminopropyl)-carbodiimide (EDC) was purchased from J&K (Atlanta, Georgia). Coelenterazine (native), the substrate of Luc8, was purchased from Promega (Madison, Wisconsin). All other reagents, such as CdCl2·2.5H2O, Te powder, and NaBH4 were purchased from Sinopharm Chemical Reagent Co, Ltd (Shanghai, China). The nude mice were provided by the Sino-British Sippr/BK Lab Animal Ltd. (Shanghai, China).
Synthesis of CdTe/CdS QDs
CdTe QDs were synthesized in aqueous solution (pH = 9.0) using CdCl2, fresh NaHTe (NaHTe solution was prepared by dissolving Te powder into a NaBH4 solution under a N2 atmosphere), and MPA as precursors. The reaction volume was 1000 mL, and the solution was reacted at 95 °C. The concentration of CdCl2 was 3.4 mmol/L, and the molar ratio of Cd:Te:MPA in the reaction solution was 1:0.47:6.76. When the fluorescence emission wavelength of the solution exceeded 700 nm, Na2S was introduced into the CdTe solution and reacted at 60 °C for 1 hour. The molar ratio of Cd to S was about 1:0.01. The CdTe/CdS QD solution was then stored at 4 °C prior to use.
Expression and purification of Luc8
The plasmid, pBAD-Rluc8, containing a gene encoding eight-mutation variants of Renilla reniformis luciferase (Luc8) with a C-terminal six-histidine tag, was kindly provided by Professor Jianghong Rao (Stanford University School of Medicine, Stanford, CA). The pBAD-Rluc8 plasmid was transferred into the Escherichia coli Rosetta strain, and the bacteria was cultured at 37 °C on a shaking-table at 180 rpm. When the absorbance of the culture reached 0.6, arabinose was added at a final concentration of 0.2% to induce expression of the Luc8. Then, the culture was incubated at 30 °C for another 12 hours. The thalli were collected by centrifugation (12,000 rpm, 10 minutes), and the Luc8 was purified using the fusion protein purification kit mentioned above.
Preparation of QD-Luc8 bioconjugates
The QD bioconjugation was prepared according to the procedures reported by So et al.Citation21 Briefly, EDC (1 μL, 4 nmol/μL) was added to the QD aqueous solution (400 μL, 1 μmol/L), which was dissolved in phosphate buffer (397 μL, pH = 7.4). After 30 minutes, 2 μL of Luc8 was introduced into the solution, which was then incubated with the QDs at 4 °C for 12 hours. The QD-Luc8 bioconjugate solution obtained was prepared and stored at 4 °C in a refrigerator.
Characterization
The fluorescence and bioluminescence emission spectra were measured using a fluorescence spectrophotometer equipped with a xenon lamp (F-2500; Hitachi, Tokyo, Japan). For detecting the bioluminescence, the excitation light was blocked using a black plastic filter, and the emission spectra were collected from a wavelength region of 400–800 nm. The morphologies of the QDs before and after conjugation of Luc8 were observed with a high-resolution transmission electron microscope (JEOL-2010; JEOL, Tokyo, Japan) operating at 200 kV. The size distributions were ascertained using photon correlation spectroscopy (3000HS; Malvern Instruments, Malvern, UK). Each sample was measured three times. The size distribution data were analyzed with respect to their intensity.
In vitro fluorescence and luminescence imaging
Eighty microliters of phosphate-buffered saline (PBS)-dissolved QD and QD-Luc8 bioconjugate solutions (all containing ~0.5 μmol/L of QDs) were placed side by side in the chamber of an in vivo imaging system (NightOWL LB983; Berthold Technologies, Bad Wildbad, Germany). A 630 nm excitation filter and 700 nm emission filter (long pass) were used for collecting the fluorescence images of the above three samples. For detecting the luminescence signals, three methanol-dissolved coelenterazine (1 μL, 1 μg/μL) solutions were each added into those three samples, and the luminescence images were then acquired with and without the 700 nm emission filter in place. For comparing the depth of tissue penetration of the QD fluorescence with that of the QD-Luc8 luminescence, the samples were covered with hairless pigskin of different thicknesses (2, 5, 10, and 20 mm), and the fluorescence (excitation filter: 630 nm) and luminescence images, all with the 700 nm emission filter, were acquired. All images were analyzed using the IndiGo software provided with the in vivo imaging system (Berthold Technologies).
SLN mapping and imaging in nude mice
A nude mouse (~25 g) was first anesthetized using 200 μL of chloral hydrate (4 wt.%) and then fixed in the chamber of the same in vivo imaging system as described above. PBS-dissolved QD-Luc8 bioconjugates (80 μL, QDs: ~0.5 μmol/L) mixed with 5 μL of coelenterazine (1 μg/μL) was injected intradermally into the mouse paw. The fluorescence (excitation filter: 630 nm) and luminescence images were then alternately taken (with a 700 nm emission filter in place) immediately after injection and monitored from 1 to 100.3 minutes. At 120 minutes after injection of the mixture of QD-Luc8 and coelenterazine, 5 μL of coelenterazine (1 μg/μL) was injected intradermally again into the mouse paw at the same site as the first injection, and the same method was then used to acquire the luminescence images. After the in vivo imaging had been completed (~3 hours after injection with the QD-Luc8 bioconjugates), the lymph node in the axillary location at the injection side was resected for fluorescence and luminescence imaging using the in vivo imaging system via the same method as described above.
To repeat the above animal experiment and determine the long-time stability of QD-Luc8 signal in mouse SLN imaging, PBS-dissolved QD-Luc8 bioconjugates (80 μL, QDs: ~ 0.5 μmol/L) mixed with 5 μL of coelenterazine (1 μg/μL) were injected intradermally into another mouse paw, and the coelenterazine (5 μL, 1 μg/μL) was reinjected into the mouse paw at 307 (~5 hours) and 595 minutes (~10 hours) after the first injection, respectively. The mouse fluorescence and luminescence images were recorded using the same method as described above. After imaging, the mouse SLN was resected for cryosectioning at −20 °C using a cryostat (CM 3050 S; Leica, Nussloch, Germany), and the frozen section images were taken on a fluorescence microscope (Nikon, Yokohama, Japan).
To compare the SLN imaging using QDs-Luc8 and QDs alone, PBS-dissolved QDs (80 μL, QDs: ~0.5 μmol/L) without Luc8 were intradermally injected into the third mouse paw. The fluorescent imaging method was the same as that described above.
Unless otherwise stated, the exposure times for all fluorescence and luminescence were 0.1 and 30 seconds, respectively.
Results and discussion
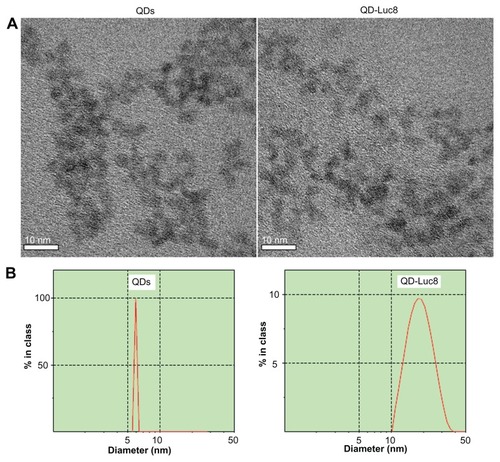
We first expressed and purified Luc8 with a maximal luminescence emission at 480 nm, and then we conjugated the Luc8 variants onto the MPA-capped QDs using EDC as the cross-linking reagent (see Method). The QD-Luc8 bioconjugates obtained could still be well dispersed in water and did not obviously aggregate, compared with the QDs before conjugation (). Although the Luc8 molecules on the QD surface were difficult to observe clearly using high-resolution transmission electron microscopy, the hydrodynamic diameter of the QD-Luc8 (19 ± 13.5 nm) was obviously larger than that of the QDs (6.0 ± 0.4 nm) without Luc8 (). It has been demonstrated that the ideal contrast agent for SLN mapping should be 10–50 nm in size;Citation28,Citation29 therefore, the QD-Luc8 nanocomposites provided by this work are of a suitable diameter to be passively delivered into the lymphatic system.
Figure 1 (A) High-resolution transmission electron microscopy images and (B) hydrodynamic diameters of QDs before and after conjugating with Luc8.
Abbreviations: Luc8, Renilla reniformis luciferase; QDs, quantum dots.
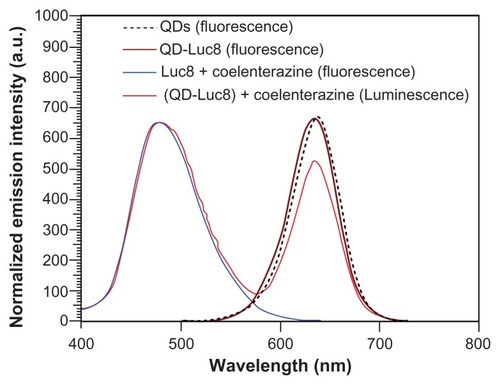
The fluorescence peak of the as-prepared QD-Luc8 bioconjugates located at 634.5 nm are slightly blue-shifted by 3 nm compared with that of the QDs without Luc8. However, the fluorescence spectra obtained for both the QDs and QD-Luc8 bioconjugates have long tails exceeding 700 nm in wavelength (). After addition of coelenterazine, the QD-Luc8 bioconjugates exhibited two maximum emission peaks at 480 and 630 nm, respectively, and the latter spectrum exceeded 700 nm (). The peak at 480 nm was due to bioluminescence caused by the reaction between Luc8 and coelenterazine, and the peak at 630 nm was due to the QD fluorescence caused by BRET. In this work, the QDs were synthesized in aqueous solution. Their surface defects are usually greater than those of QDs synthesized in organic solution. This may be the main reason why the BRET ratio is not high.
Figure 2 Fluorescence emission spectrum of QDs and bioluminescence emission spectra of the Luc8 and QD-Luc8 bioconjugates.
Abbreviations: Luc8, Renilla reniformis luciferase; QDs, quantum dots.
Both the QDs and QD-Luc8 bioconjugates, when excited with a 630 nm light, were found to emit a bright NIR fluorescence as observed using an in vivo imaging system equipped with a 700 nm emission filter (, left). After the addition of coelenterazine, the Luc8 and QD-Luc8 bioconjugate solutions immediately emitted luminescence without any emission filter, and the luminescence intensity of the QD-Luc8 bioconjugates was significantly brighter than that of Luc8 alone (, right). When the luminescence was filtered using the 700 nm emission filter, nearly no signal from the Luc8 solution could be detected, but a bright emission from the QD-Luc8 solution could be detected (, middle). These results indicate that BRET had occurred between Luc8 and the QDs in the mixed solution of QD-Luc8 and coelenterazine, so that the NIR fluorescence of the QD-Luc8 bioconjugates could be detected by the in vivo imaging system without any further external light excitation.
Figure 3 The fluorescence and bioluminescence images of QDs, Luc8, and QD-Luc8 bioconjugates and the depth of tissue penetration of the QD fluorescence and QD-Luc8 bioluminescence acquired by the in vivo imaging system. (A) Left: Fluorescence image of the samples acquired with a 700 nm emission filter; middle and right: bioluminescence images of the QDs and the coelenterazine-catalyzed Luc8 and QD-Luc8 bioconjugates acquired with a 700 nm emission filter (middle) and without any filter (right). (B) Left: Fluorescence and bioluminescence (right) images of the QDs, Luc8, and QD-Luc8 bioconjugate samples, covered with hairless pig skins of 2, 5, 10, and 20 mm thicknesses, respectively.
Abbreviations: Luc8, Renilla reniformis luciferase; QDs, quantum dots.
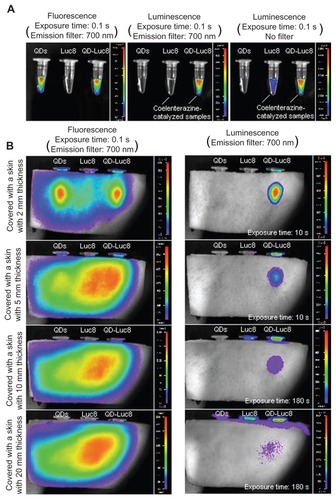
To compare the depth of tissue penetration achievable by the QD fluorescence with that of the QD-Luc8 luminescence, hairless pigskins with different thicknesses were used to cover the above three samples (QDs, Luc8, and QD-Luc8) for the detection of the corresponding fluorescence and luminescence signals. As shown in , the fluorescence of the QDs and QD-Luc8 bioconjugates could penetrate no more than 10 mm of skin tissue, and the fluorescence signals associated with the QDs, as well as the QD-Luc8 bioconjugates, were difficult to distinguish from the strong background autofluorescence of the skins, even when the 700 nm emission filter was used to reduce the autofluorescence signal. However, the luminescence of the QD-Luc8 bioconjugates could penetrate at least 20 mm of skin tissue, and little background signal could be detected. With the 700 nm emission filter in place, the bioluminescence of Luc8 without QD conjugation could not penetrate any thickness of pigskin provided by this work. The deep penetration ability and reduced background interference of the self-illuminating QD-Luc8 bioconjugates are expected to be of great benefit for in vivo bioimaging.
We then investigated the use of NIR luminescence emitted by the self-illuminating QD-Luc8 bioconjugates for mouse axillary SLN mapping. We intradermally injected 80 μL of QD-Luc8 (QDs: ~0.5 μmol/L) and 5 μL of coelenterazine (1 μg/μL) as a substrate into a nude mouse paw and used the in vivo imaging system equipped with a 700 nm emission filter to monitor the migration of the QD-Luc8 bioconjugates into the axillary SLN by means of NIR luminescence. As shown in , the mouse axillary region emitted bright luminescence as early as 1 minute after injection, and it could be observed clearly without the need to excise skin and muscle. The luminescence intensity at the axillary region increased during the initial 20 minutes after injection, but then decreased during the subsequent period ( left). This may be due to the following two factors: (1) that successively more QD-Luc8 nanoparticles migrated from the injection site into the lymphatic vessel, finally becoming trapped by the SLN during the initial period (eg, ~1–20 minutes after injection), and (2) that the number of coelenterazine molecules in the axillary region was slowly reduced during the subsequent period (eg, ~ 30–100 minutes after injection) because of reaction with the QD-Luc8 bioconjugates and their diffusion into the surrounding tissue. In spite of this, the luminescence signal emitted by the axillary region persisted for at least 100 minutes after the injection. It is interesting that when the luminescence intensity of the QD-Luc8 bioconjugates in the axillary region decayed to close to zero, the luminescence signal could be recovered after being intradermally re-injected with the coelenterazine substrate into the mouse paw at the same site as the first injection ( right). Furthermore, the recovered luminescence signal persisted for at least 50 minutes after the second injection.
Figure 4 SLN mapping in a nude mouse using the self-luminescence of the QD-Luc8 bioconjugates catalyzed by coelenterazine and the luminescence emitted by SLN varying with time. (A) The mouse before and after being injected with 80 μL of QD-Luc8 (QDs: ~0.5 μmol/L) and 5 μL of coelenterazine (1 μg/μL). (B) The mouse after being reinjected with 50 μL of coelenterazine (0.1 μg/μL), 120 minutes after the first injection of QD-Luc8 and coelenterazine. (C) Integral luminescence intensity emitted by SLN, varying with time (left: data shown in (A); right: data shown in (B)). The same mouse was used for (A) and (B). An emission filter of 700 nm wavelength was used. The exposure time was 30 seconds.
Abbreviations: Luc8, Renilla reniformis luciferase; SLN, sentinel lymph node; QDs, quantum dots.
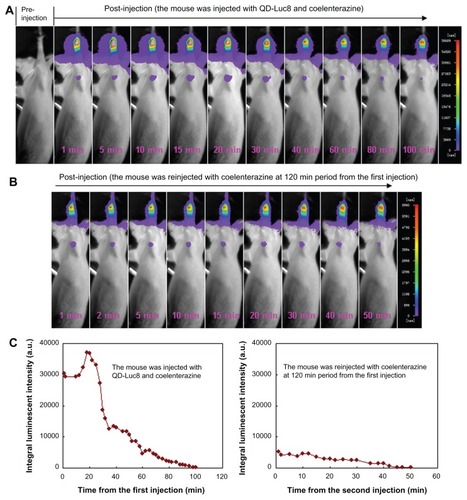
It is also clearly shown that nearly no autobioluminescence associated with the mouse could be detected, and only the injection site and the axillary region exhibited bright luminescence signals. Therefore, the axillary SLN could be found easily in real time in deep tissue using the self-illuminating QD-Luc8 bioconjugates. In addition, we found that there is enough time to identify and ensure complete resection of the SLN, as the luminescence of the QD-Luc8 bioconjugates trapped within the SLN can be retained for a long time and can be reilluminated through reinjection of the coelenterazine substrate.
To compare the self-luminescence and fluorescence of the QD-Luc8 bioconjugates for SLN imaging, the fluorescence images of the same mouse, as described above, were taken using the in vivo imaging system during the corresponding luminescence imaging intervals. As shown in , the SLN imaging using the QD fluorescence is hampered by the strong autofluorescence produced by the liver, stomach, intestines, and skin of the mouse. Although these tissues usually only emit yellow or green fluorescence, they have a broad emission spectra. Therefore, the autofluorescence of these tissues could not be completely filtered by the 700 nm emission filter.
Figure 5 SLN mapping in a nude mouse using the fluorescence of the QD-Luc8 bioconjugates. The mouse is the same one shown in . These fluorescence images were taken during the corresponding luminescence imaging intervals. The excitation and emission filters were 630 and 700 nm, respectively. The exposure time was 0.1 second.
Abbreviations: Luc8, Renilla reniformis luciferase; SLN, sentinel lymph node; QDs, quantum dots.

Approximately 3 hours after injection of the QD-Luc8 bioconjugates, the skin and muscle at the luminescence region of the axillary region were dissected, and the SLN was exposed to air. It should be noted that, before resection from the mouse body, the exposed SLN emitted both luminescence and fluorescence, as detected using the in vivo imaging system (). However, the luminescence of the QD-Luc8 bioconjugates in the SLN could not be observed after resection (, top). This is because the lymphatic vessel has been cut off, thereby preventing the flow of coelenterazine substrate molecules into the SLN to react with the QD-Luc8 bioconjugates. It can be seen, however, that the resected SLN still emitted bright fluorescence, and its fluorescence intensity was at least twice that of the maximal intensity of the in vivo SLN, because the resected SLN was no longer covered by skin and muscle.
Figure 6 Postresection inspections of the surgical field and the resected lymph nodes and their luminescence and fluorescence images. (A) Postresection evaluation of the surgical field of the same mouse shown in and , hours after injection with QD-Luc8 bioconjugates. (B) top: the SLN resected from the mouse shown in (A); bottom: a control lymph node from a mouse without injection with QDs and Luc8. Emission filter was 700 nm. The exposure times for fluorescence and luminescence were 0.1 and 30 seconds, respectively.
Abbreviations: Luc8, Renilla reniformis luciferase; SLN, sentinel lymph node; QDs, quantum dots.
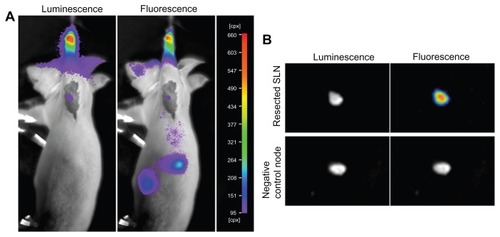
Therefore, combining the luminescence of the QD-Luc8 conjugates for in vivo imaging and the fluorescence of the QD-Luc8 for in vitro imaging may be a more efficient strategy for SLN mapping and imaging. As a control, the resected lymph node of another mouse, without injection of QDs, exhibited little or no bioluminescence or fluorescence after being filtered by the 700 nm emission filter (, bottom).
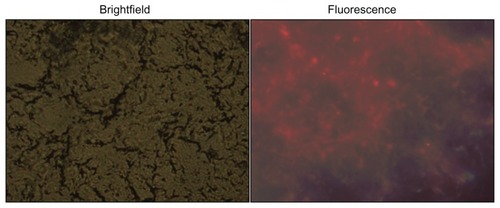
In order to monitor the long-time stability of QD-Luc8 in mouse SLN, QD-Luc8 bioconjugates (80 μL, QDs: ~0.5 μmol/L) mixed with coelenterazine (5 μL, 1 μg/μL) was injected intradermally into another mouse paw, and the axillary SLN luminescence was imaged. As shown in , the luminescence of the SLN persisted for at least 100 minutes after the injection, which was similar to the first mouse results shown (). This indicates that using the luminescence of the QD-Luc8 conjugates for SLN mapping is a repeatable technique. When coelenterazine (5 μL, 1 μg/μL) was intradermally reinjected into the mouse paw at the same site of the first injection, 307 minutes after the first injection, the extinct luminescence was recovered, and the recovered luminescence signal persisted for about 40 minutes after the second injection (). This suggests that some Luc8 molecules remained on the surfaces of the QDs and retained bioactivity in the mouse body for about 347 (307 ± 40) minutes from the first injection. However, when coelenterazine (5 μL, 1 μg/μL) was injected into the mouse paw for the third time, 595 minutes after the first injection, nearly no luminescence signal could be detected (), which suggests that the bioactivity of Luc8 on the QD surfaces in the mouse body disappeared about 10 hours after the first injection. Although the luminescence signal of QD-Luc8 bioconjugates in SLN disappeared, these bioconjugates still emitted bright fluorescence about 10 hours after the first injection, which could be observed whether the axillary skin and muscle were resected or not (). The fluorescent image of the ultrathin section showed that a large amount of QDs was trapped in the mouse SLN ().
Figure 7 Long-time stability of light signal from QD-Luc8 trapped in SLN. The experimental method was similar to that shown in and . (A) The mouse before and after being injected with 80 μL of QD-Luc8 (QDs: ~0.5 μmol/L) and 5 μL of coelenterazine (1 μg/μL). The mouse was reinjected with 50 μL of coelenterazine (0.1 μg/μL) at (B, C) 307 and (D) 595 minutes from the first injection of QD-Luc8 and coelenterazine. (C) Integral luminescence intensity (from B) emitted by SLN, varying with time. (E) Fluorescence (excitation filter: 630 nm) emitted by SLN at 622–624 minutes from the first injection of QD-Luc8. Emission filter was 700 nm. Unless otherwise stated (eg, D), the exposure times for all fluorescence and luminescence were 0.1 and 30 seconds, respectively.
Abbreviations: Luc8, Renilla reniformis luciferase; SLN, sentinel lymph node; QDs, quantum dots.
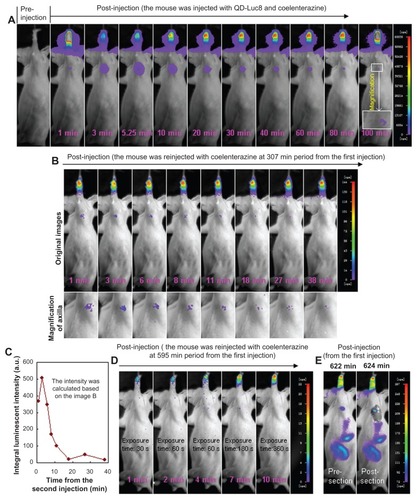
Figure 8 Frozen sections of the SLN resected from the mouse shown in .
Abbreviations: Luc8, Renilla reniformis luciferase.
Finally, we intradermally injected QDs alone (80 μL, 0.5 μmol/L) into the third nude mouse paw, and found that the axillary SLN emitted bright fluorescence even about 10 hours after the injection (). Combining the results shown in (or ), , and , we can conclude that the Luc8 enzyme on the QD surfaces does not obviously influence the QDs passively targeting the SLN.
Figure 9 SLN mapping in a nude mouse using the fluorescence of QDs (80 μL, ~0.5 μmol/L) emitted by SLN, varying with time. Excitation and emission filters were 630 and 700 nm, respectively. The mouse was injected with QDs only. The exposure time was 0.1 second.
Abbreviations: SLN, sentinel lymph node; QDs, quantum dots.

Conclusion
In summary, water-soluble CdTe/CdS QDs synthesized in aqueous solution were used for conjugating with R. reniformis luciferase (Luc8). The bright luminescence of the QD-Luc8 bioconjugates obtained could be illuminated quickly through BRET when the bioconjugates were reacted with a substrate (coelenterazine). Using an in vivo imaging system equipped with a 700 nm emission filter, SLN mapping of a mouse using the NIR luminescence of the QD-Luc8 bioconjugates catalyzed by the coelenterazine substrate has great advantages over using the NIR fluorescence of the QD-Luc8 bioconjugates, because of their high sensitivity resulting from the limited background interference, as well as the high depth of tissue penetration of the luminescence. In addition, the bright luminescence trapped within the SLN was retained for at least 100 minutes after injection of the QD-Luc8 bioconjugates and the coelenterazine substrate, and the extinct luminescence could be reilluminated by reinjection of the substrate. The strategy described in this study indicates that the QD-Luc8 bioconjugates are a smart nanostructure that may be applicable as a novel imaging tool for use in in vivo SLN mapping, due to their highly sensitive self-luminescence.
Acknowledgments
We gratefully acknowledge Professor Jianghong Rao for providing the pBAD-Rluc8 plasmid. This work was supported in part by the National Natural Science Foundation of China (30870711), the Key Technologies R&D Program in the 11th Five-year Plan of China (2009ZX09103–701), the 863 National High Technology Research and Development Program of China (No. 2007 AA03Z319), and the Program for New Century Excellent Talents in University (No. NCET-07–0618).
Disclosure
The authors report no conflicts of interest in this work.
References
- AlivisatosAPSemiconductor clusters, nanocrystals, and quantum dotsScience19962715251933937
- BruchezMMoronneMGinPWeissSAlivisatosAPSemiconductor nanocrystals as fluorescent biological labelsScience19982815385201320169748157
- ChanWCWNieSMQuantum dot bioconjugates for ultrasensitive nonisotopic detectionScience19982815385201620189748158
- MitchellPTurning the spotlight on cellular imagingNat Biotechnol200119111013101711689841
- ChanWCWMaxwellDJGaoXHBaileyREHanMYNieSMLuminescent quantum dots for multiplexed biological detection and imagingCurr Opin Biotechnol2002131404611849956
- MichaletXPinaudFFBentolilaLAQuantum dots for live cells, in vivo imaging, and diagnosticsScience2005307570953854415681376
- KimSLimYTSolteszEGNear-infrared fluorescent type II quantum dots for sentinel lymph node mappingNat Biotechnol2004221939714661026
- ChuMQZhuoSXuJShengQHouSKWangRFLiposome-coated quantum dots targeting the sentinel lymph nodeJ Nanopart Res2010121187197
- BallouBErnstLAAndrekoSSentinel lymph node imaging using quantum dots in mouse tumor modelsBioconjug Chem200718238939617263568
- PicEPonsTBezdetnayaLFluorescence imaging and whole-body biodistribution of near-infrared-emitting quantum dots after subcutaneous injection for regional lymph node mapping in miceMol Imaging Biol201012439440519936843
- HikageMGondaKTakedaMNano-imaging of the lymph network structure with quantum dotsNanotechnology2010211818510320388975
- PonsTPicELequeuxNCadmium-free CuInS2/ZnS quantum dots for sentinel lymph node imaging with reduced toxicityACS Nano2010452531253820387796
- CassetteEPonsTBouetCSynthesis and characterization of near-infrared Cu-In-Se/ZnS core/shell quantum dots for in vivo imagingChem Mater2010222261176124
- TamALGuptaNZhangZYücelYHQuantum dots trace lymphatic drainage from the mouse eyeNanotechnology2011224242510121934199
- InoueYKiryuSWatanabeMOyaizuNOhtomoKFluorescence lymph node mapping in living mice using quantum dots and a compression techniqueJ Fluoresc201020259960620082211
- MortonDLWenDRWongJHTechnical details of intra-operative lymphatic mapping for early stage melanomaArch Surg199212743923991558490
- UrenRFCancer surgery joins the dotsNat Biotechnol2004221383914704701
- ThevarajahSHustonTLSimmonsRMA comparison of the adverse reactions associated with isosulfan blue versus methylene blue dye in sentinel lymph node biopsy for breast cancerAm J Surg2005189223623915720998
- TroyTJekic-McMullenDSambucettiLRiceBQuantitative comparison of the sensitivity of detection of fluorescent and bioluminescent reporters in animal modelsMol Imaging20043192315142408
- SoMKXuCLoeningAMGambhirSSRaoJSelf-illuminating quantum dot conjugates for in vivo imagingNat Biotechnol200624333934316501578
- SoMKLoeningAMGambhirSSRaoJCreating self-illuminating quantum dot conjugatesNat Protoc2006131160116417406398
- XingYSoMKKohALSinclairRRaoJImproved QD-BRET conjugates for detection and imagingBiochem Biophys Res Commun2008372338839418468518
- MaNMarshallAFRaoJNear-infrared light emitting luciferase via biomineralizationJ Am Chem Soc2010132206884688520441172
- KimYPDanielWLXiaZXieHMirkinCARaoJBioluminescent nanosensors for protease detection based upon gold nanoparticle-luciferase conjugatesChem Commun (Camb)2010461767820024298
- KosakaNMitsunagaMBhattacharyyaSMillerSCChoykePLKobayashiHSelf-illuminating in vivo lymphatic imaging using a bioluminescence resonance energy transfer quantum dot nano-particleContrast Media Mol Imaging201161555921351373
- ZhouDLinMChenZLSimple synthesis of highly luminescent water-soluble CdTe quantum dots with controllable surface functionalityChem Mater2011232148574862
- RogachALFranzlTKlarTAAqueous synthesis of thiolcapped CdTe nanocrystals: state-of-the-artJ Phys Chem C2007111401462814637
- JosephsonLMahmoodUWunderbaldingerPTangYWeisslederRPan and sentinel lymph node visualization using a near-infrared fluorescent probeMol Imaging200321182312926234
- OhnishiSLomnesSJLaurenceRGGogbashianAMarianiGFrangioniJVOrganic alternatives to quantum dots for intraoperative near-infrared fluorescent sentinel lymph node mappingMol Imaging20054317218116194449