Abstract
Background
The applications of ligand-polyethylene glycol (PEG)-modified nanocarriers have now emerged, as well as recognized strategies to provide the vectors with active targeting properties. In this research, premodification and postmodification were compared using the same ligand, ie, a novel conjugated mannan-containing PEG and L-α-phosphatidylethanolamine (PE).
Methods
Premodified and postmodified solid lipid nanoparticles were prepared and the characteristics of the two kinds of vehicles were evaluated. The modified vectors were then administered intravenously to rats and the in vivo targeting behavior of the complexes was investigated in liver macrophages.
Results
By carefully formulating the carriers with an optimal ratio of mannan-containing PEG-PE, postmodified vehicles displayed more efficient gene expression in rat Kupffer cells both in vitro and in vivo.
Conclusion
Postmodified gene carriers are superior to premodified gene vectors, although the latter is also promising for targeted gene delivery. This discovery could guide our future research.
Introduction
The prospect of gene nanomedicine holds great promise for alleviation and cure of many presently untreatable diseases.Citation1 Ideally, a gene delivery system should be stable, biocompatible, nontoxic, cost-effective, and able to be delivered (targeted) to a specific site, transfer highly anionic exogenous genetic materials, and have maximum therapeutic efficacy.Citation2 However, the lack of efficient site-specific delivery systems has impeded the realization of gene therapy in practice.Citation3
Compared with viral vectors, nonviral pharmaceutical vectors, such as polymeric nanoparticles, liposomes, micelles, nanocapsules, solid lipid nanoparticles (SLN), niosomes, and other vectors are potentially less toxic, less immunogenic, relatively easy to produce on a large scale, and able to be modified.Citation4–Citation6 Surface modification of nanovectors could improve their longevity, bioavailability, targeting ability, and intracellular penetration, and thus provide a range of opportunities for efficient delivery of anticancer drugs, genes, and diagnostic agents.Citation7–Citation10
In terms of modification, they could be classified in two different ways, ie, premodification and postmodification. Premodification complexes could be prepared by mixing drugs/genes with modified vectors, while postmodification complexes can be obtained by surface modification using conventional drug-/gene-loaded carriers.Citation7 Examples include the post-pegylated lipoplexes reported by Peeters et al to be more promising vehicles for gene delivery than pre-pegylated lipoplexes in retinal pigment epithelium cells.Citation11 Both premodification and postmodification methods have advantages. Premodified vehicles could be more stable, and loading of drugs/genes would not change the targeting ability of the vectors,Citation12–Citation15 whereas postmodified carriers might be modified more efficiently and have better targeting capability.Citation16,Citation17 However, which method is better for targeted gene delivery is unknown and is a focus of our ongoing investigations.
Targeted macrophages are one of the promising strategies for treating diseases such as human immunodeficiency virus infection, because macrophages play a major role in the immune response to foreign antigens.Citation18 Kupffer cells are liver-specific resident macrophages that play an integral part in the physiological homeostasis of the liver. They have a significant role in the acute and chronic responses of the liver to bacterial and viral infections, toxic or carcinogenic attack, and mediate hepatotoxicity.Citation19 It has been shown that human and murine macrophages express the mannose receptor on their surface, and several studies have confirmed the feasibility of using mannose or mannan-modified nanocarriers to target macrophages.Citation20
In the present study, a novel conjugated ligand, mannan-polyethylene glycol-L-α-phosphatidylethanolamine (MN-PEG-PE) was synthesized, and MN-PEG-PE-modified SLN were investigated. In this study we compared the two strategies for modification using the same ligands (MN-PEG-PE) in an attempt to identify which kind of nanomedicine is preferable for targeted gene therapy, ie, premodified or postmodified gene-loaded SLN/DNA. Cationic SLN were used as the vectors and plasmid-enhanced green fluorescent protein (pEGFP) was used as the model gene. The properties of these two kinds of modified vehicles were compared using in vitro and in vivo transfection in a rat Kupffer cell model. Unmodified gene-loaded complexes were used as controls.
Materials and methods
Materials
Stearic acid, dimethyldioctadecylammonium bromide, mannan, PE, concanavalin A (Con A), and MTT (3-[4,5-dimehyl-2-thiazolyl]-2,5-diphenyl-2H-tetrazolium bromide) were purchased from Sigma-Aldrich Co, Ltd (St Louis, MO). Injectable soya lecithin was obtained from Shanghai Taiwei Pharmaceutical Co, Ltd (Shanghai, China). Butyl carbonyl (Boc)-NH-PEG2000-COOH was purchased from Shanghai Yarebio Co, Ltd (Shanghai, China). pEGFP-N1 was provided by Shandong University (Shandong, China). Quant-iT™ PicoGreen® dsDNA quantitation reagent was obtained from Invitrogen by Life Technologies (Carlsbad, CA). All other chemicals were of analytical grade or higher.
Animals
Adult male Wistar rats (aged 10–12 weeks) were purchased from the Medical Animal Test Center of Shandong Province and housed under standard laboratory conditions. All animal experiments complied with the requirements of the National Act on the Use of Experimental Animals (People’s Republic of China).
Synthesis of MN-PEG-PE ligands
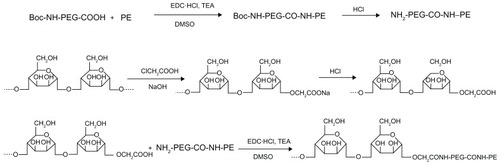
MN-PEG-PE ligands were synthesized as described in . Boc-NH-PEG-COOH 100 mg was dissolved in dimethyl sulfoxide (DMSO) and stirred with PE 36 mg as a mixture. 1-[3-(dimethylamino)propyl]-3-ethylcarbodiimide (EDC · HCl) 72 mg and triethylamine (1 equivalent of EDC · HCl) were dissolved in DMSO and added dropwise into the mixture in an ice bath and stirred for 36 hours, following which concentrated hydrochloric acid was used to detach the Boc group, to produce NH2-PEG-CO-NH-PE. Mannan 100 mg was dissolved in 1 M sodium hydroxide 1 mL and stirred for 30 minutes for alkalinization. Chloroacetic acid (20%, 1 mL) was then added to the solution and stirred in an oil bath at 60°C for 6 hours. After that, 1 M hydrochloric acid was added until a pH of 2–3 was reached, to complete the carboxymethylation of mannan. Carboxymethylated mannan was then stirred with NH2-PEG-CO-NH-PE in DMSO solution, and EDC · HCl mixed with triethylamine (1 equivalent of EDC · HCl, in DMSO) was added dropwise into the solution in an ice bath and stirred for 24 hours. DMSO was moved by rotary evaporation, and the product was dialyzed against Milli-Q water (Millipore Corporation, Billerica, MA) for 24 hours for final formation of MN-PEG-PE.
Figure 1 General reaction scheme for synthesis of MN-PEG-PE.
Abbreviations: DMSO, dimethylsulfoxide; MN, mannan; PEG, polyethylene glycol; PE, L-α-phosphatidylethanolamine; TEA, triethylamine.
Preparation of cationic SLN
SLN were prepared using the nanoprecipitation method (solvent displacement technique).Citation20–Citation22 Stearic acid 50 mg and injectable soya lecithin 30 mg were accurately weighed and dissolved in 10 mL of acetone. The organic phase was added dropwise into the 0.2% dimethyldioctadecylammonium bromide solution, under stirring at 600 rpm and at room temperature. When complete evaporation of the organic solvent had occurred, the redundant stabilizers were separated by ultracentrifugation at 1000 g and at 4°C for 20 minutes. The pellet was vortexed and resuspended in Milli-Q water, washed three times, filtered through a 0.45 μm membrane, and adjusted to pH 7.0 ± 0.2 with sodium hydroxide. The SLN suspensions obtained were stored at 2°C–8°C.
Preparation and optimization of MN-PEG-PE-modified SLN/DNA
Premodification
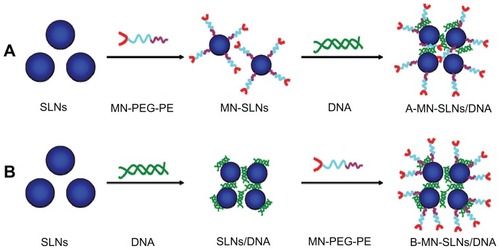
Pre-MN-PEG-PE-modified SLN/DNA (A-MN-SLN/DNA) complexes were prepared by firstly modifying the SLN with MN-PEG-PE to form new vehicles, followed by complexation of the vectors with pEGFP ().
Figure 2 Preparation of pre- (A) and post- (B) MN-PEG-PE-modified SLN/DNA.
Abbreviations: SLN, solid lipid nanoparticles; MN, mannan; PEG, polyethylene glycol; PE, L-α-phosphatidylethanolamine; A-MN-SLNs/DNA, pre-MN-PEG-PE-modified SLN/DNA; B-MN-SLNs/DNA, post-MN-PEG-PE-modified SLN/DNA.
Briefly, MN-PEG-PE ligands were dissolved in 5 mL of phosphate-buffered saline (pH 7.4). The solution was then added dropwise into 20 mL of SLN and stirred at 600 rpm and room temperature, leading to immediate modification. Subsequently, free MN-PEG-PE was removed from the modified SLN/DNA by gel chromatography using a Sephadex® G-50 column. The complexes obtained were resuspended in Milli-Q water, washed three times, and filtered through a membrane with an 0.80 μm pore size to obtain MN-PEG-PE modified SLN.
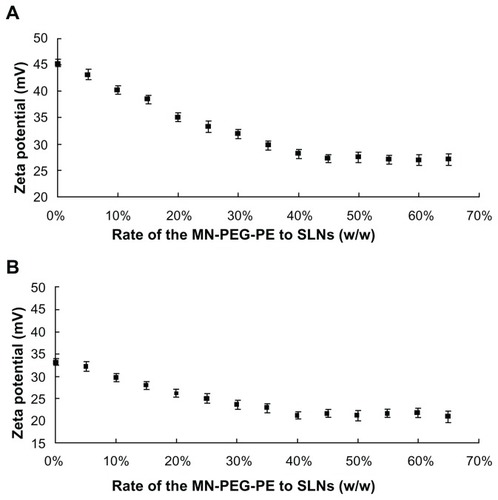
MN-PEG-PE ligands were continuously coated onto the surface of the SLN. During the progress of modification, the positive surface charge would have been masked, and this process caused a decrease in the zeta potential. The optimum formulation was obtained when there was no obvious change in the potential. To optimize the modification ratio, MN-PEG-PE ligands dissolved in phosphate-buffered saline were designed at different weight ratios to the SLN (w/w). The change in zeta potential of the complexes was determined using a Zetasizer Nano-ZS instrument (Malvern, Worcestershire, UK).
The reporter gene, pEGFP, was mixed with the premodified SLN by vortexing the suspension with a 1 mg/mL solution of pEGFP for 20 seconds. Incubation of the mixture for 30 minutes at room temperature facilitated formation of the A-MN-SLN/DNA.
Postmodification
Post-MN-PEG-PE-modified SLN/DNA (B-MN-SLN/DNA) complexes were prepared by incubating the SLN with pEGFP to form SLN/DNA, followed by modification of SLN/DNA with MN-PEG-PE (). Briefly, pEGFP was mixed with SLN by vortexing the particles with a 1 mg/mL solution of pEGFP for 20 seconds. Incubation of the mixture for 30 minutes at room temperature facilitated formation of SLN/DNA.
MN-PEG-PE ligands were dissolved in 5 mL of phosphate- buffered saline (pH 7.4). The solution was then added dropwise to 20 mL of SLN/DNA complexes and stirred at 600 rpm in room temperature, leading to immediate modification. Subsequently, free MN-PEG-PE was removed from the modified SLN/DNA by gel chromatography using a Sephadex G-50 column. The complexes obtained were resuspended in Milli-Q water, washed three times, and filtered through a membrane with a pore size of 0.80 μm to obtain B-MN-SLN/DNA. During this procedure, the MN-PEG-PE ligands were continuously coated onto the surface of the SLN/DNA which would also have caused a decrease in the zeta potential. To optimize the modification ratio, MN-PEG-PE ligands dissolved in phosphate-buffered saline were designed at different weight ratios to the SLN (w/w), and the zeta potential of the complexes was determined. PEG-PE ligands without mannan were dissolved in 5 mL of phosphate-buffered saline and modified onto the SLN/ DNA surface using the same method as described earlier for preparation of PEG-PE-SLN/DNA as a control.
Characterization of premodified and postmodified SLN/DNA
Gene-loading capacities: PicoGreen fluorometry assay
A PicoGreen fluorometry assay was used to quantitate and compare the gene-loading abilities of premodified and postmodified SLN/DNA.Citation23–Citation25 The pEGFP was isolated from the A-MN-SLN/DNA and B-MN-SLN/DNA by centrifugation at 1000 g and 4°C for 20 minutes. The concentration of pEGFP was determined by fluorescence, and compared with the supernatant from SLN. The amount of pEGFP loaded into the SLN was calculated according to the linear calibration curve for pEGFP (10 to 2000 ng/mL, R2 = 0.9993). Gene loading quantity (%) = (total amount of pEGFP – amount of free pEGFP)/total amount of DNA × 100.
Determination of modification: Con A agglutination study
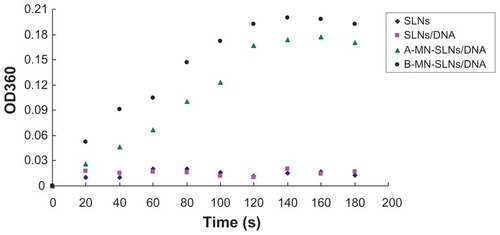
Binding of the terminal α-mannose residues to Con A causes agglutination of the complexes in solution, resulting in an increase in turbidity.Citation26–Citation28 To confirm that the MN-PEG-PE ligands were successfully modified onto the SLN/DNA surface, a Con A agglutination assay was performed. Briefly, 100 μL each of A-MN-SLN/DNA, B-MN-SLN/DNA, and unmodified SLN/DNA complexes were added separately into 500 μL of Con A (1 mg/mL) in phosphate-buffered saline (pH 7.4) with 5 mM of CaCl2 and 5 mM of MgCl2. The increase in turbidity at 360 nm (OD360) was monitored for 180 seconds.
Isolation and culture of Kupffer cells
Kupffer cells were isolated from Wistar rats under pentobarbitone anesthesia using a method described elsewhere.Citation29 The rat portal veins were cannulated and perfused with Hank’s buffered salt solution for 10 minutes at room temperature. During this time, the liver was excised and the perfusate discarded. The liver was then perfused with 0.2% pronase (60 mL at room temperature) which was discarded. Next, the liver was perfused with a recirculating solution of 0.05% pronase and 0.05% collagenase (60 mL at room temperature) until the liver was digested, as judged by softening of the liver parenchyma beneath the capsule. The liver was then cut into small pieces, suspended in 100 mL of solution containing 0.02% pronase, 0.05% collagenase, and 0.005% DNase, and agitated at room temperature for 20 minutes. Following digestion, the liver homogenate was filtered through sterile gauze and centrifuged (at 1000 g and 4°C for 10 minutes). The supernatant was removed and the pellet was resuspended in 10 mL of Percoll gradient. Aliquots (5 mL) of this cell suspension were added to 5 mL aliquots of Percoll gradient. These were carefully overlaid with 5 mL of Hank’s buffered salt solution and centrifuged at 1000 g and 4°C for 20 minutes. The nonparenchymal cell-enriched layer observed at the interface between the two layers was carefully harvested and diluted with 10 mL of Hank’s buffered salt solution. The suspension was then centrifuged (1000 g and 4°C for 20 minutes) to precipitate the Kupffer cells, which were then seeded into a 96-well microtiter plate at a density of 2 × 10⁴ cells/well in 200 μL RPMI-1640 supplemented with 10% fetal bovine serum and antibiotics. After incubation at 37°C for 2 hours in a 5% CO2 atmosphere, the culture medium was replaced by 200 μL of fresh RPMI-1640 to yield the purified Kupffer cells.
The isolated rat liver Kupffer cells were defined, and about 8.15 × 10⁷ cells were obtained, with a purity of about 91.2% (8.94 × 10⁷/rat liver nonparenchymal cells). The isolated and purified rat Kupffer cells retained their in vivo morphological, biological, and immunological characteristics.
In vitro cytotoxicity evaluation
The in vitro cytotoxicity of A-MN-SLN/DNA and B-MN-SLN/ DNA against Kupffer cells was evaluated by MTT assay.Citation30 The Kupffer cells were incubated with modified and unmodified SLN/DNA at various concentrations (10, 20, 50, 100, and 200 μg/mL) for 48 hours at 37°C and in a 5% CO2 atmosphere. Cell viability was then assessed by MTT assay. Next, MTT 5 mg/mL in phosphate-buffered saline was added to each well and the plate was incubated for a further 4 hours at 37°C in a 5% CO2 atmosphere. The MTT containing the medium was then removed, and the crystals formed by living cells were dissolved in 100 μL of DMSO. The absorbance at 570 nm was determined by a microplate reader. Untreated cells were taken as a control with 100% viability, and cells without the addition of MTT were used as a blank to calibrate the spectrophotometer to zero absorbance. The relative cell viability (%) compared with control cells was calculated using (Abssample/Abscontrol) × 100.
In vitro release of MN-SLN/DNA
The in vitro release studies of premodified and postmodified MN-SLN/DNA were performed in phosphate-buffered saline (pH 7.4).Citation31 Typically, aliquots of complexes were suspended in 1 mL of phosphate-buffered saline (in Eppendorf® tubes) and vortexed for 30 seconds. The tubes were then placed in a 37°C shaking water bath at 100 rpm. Separate tubes were used for different data points. At predetermined time intervals, the suspensions were centrifuged at 1 500 g for 30 minutes, and the amount of DNA released in the supernatant was analyzed using the PicoGreen assay. Background readings were obtained using the supernatants from the blank SLN.
In vitro transfection analysis
The Kupffer cells were seeded into 24-well plates at a density of 8 × 10⁴ cells/well in 1 mL of RPMI-1640 with 10% fetal bovine serum. After about 24 hours, the medium was replaced by 500 μL of transfection medium containing A-MN-SLN/DNA and B-MN-SLN/DNA. Unmodified SLN/DNA complexes and PEG-PE ligand-modified SLN/ DNA without mannan (PEG-PE-SLN/DNA) were used as controls. The original incubation medium was replaced with 1 mL of complete medium after incubation at 37°C for 4 hours in a 5% CO2 atmosphere. The cells were incubated and studied until 72 hours after transfection. The fluorescent cells were observed using an inversion fluorescence microscope, at which time pictures were taken for the record.
In vivo gene delivery
Adult male Wistar rats were divided into five groups (six rats in each group) and injected intravenously with 1 mL of naked DNA, SLN/DNA, PEG-PE-SLN/DNA, A-MN-SLN/ DNA, or B-MN-SLN/DNA (containing 60 μg of pEGFP). At predetermined time intervals (24, 48, and 72 hours), the rats were euthanized and their Kupffer cells were isolated and cultured as described earlier. The fluorescent cells were observed using an inversion fluorescence microscope, at which time pictures were taken for the record. After that, the cells were washed with 1 mL of phosphate-buffered saline (100 g and 4°C for 5 minutes) and were detached with trypsin/ EDTA. The supernatant was discarded and resuspended with 300 μL of phosphate-buffered saline and added into the flow cytometer to quantitate the amount of Kupffer cells which has been successfully transfected.
Statistical analysis
All studies were repeated three times and the measurements were carried out in triplicate. Results were reported as the mean ± standard deviation. Statistical significance was analyzed using the Student’s t-test. Differences between experimental groups were considered significant at P < 0.05.
Results
Structure confirmation of MN-PEG-PE ligands
The structure of MN-PEG-PE was confirmed by infrared spectroscopy and nuclear magnetic resonance (1H NMR) spectroscopy. Infrared ν/cm−1: 3517.3 (–NH–, –OH); 1820.4 (–C=O); 1667.9 (–HN–CO–); 1635.2 (–HN–CO–, evidence of the mannan linked with PEG-PE); and 1093.2 (–C–O–C–, secondary alcohol structure in mannan). 1H NMR (DMSO-d6, 300 MHz) δ: 2.47 (CH2CO), 3.26 (CH2N) 6.05 (NH), and δ (3.0–6.5). Similar peaks were observed as the spectra of mannan, ie, δ (0–3.0), and the peaks were in accordance with PEG-PE. The production rate was around 70%.
Optimization of modification ratio and quantitation of binding capacity
The optimization of ligand to carrier ratio and binding capacity of the optimized vectors were as follows:
Premodified SLN/DNA
MN-PEG-PE ligands were previously coated onto the SLN surface. The ratio of ligands to carriers was optimized by measuring the change in zeta potential. As illustrated in , the optimized ratio of MN-PEG-PE to SLN was 40%. This ratio was used for further experiments. MN-SLN were then incubated with pEGFP to form A-MN-SLN/DNA. The gene loading efficiency of A-MN-SLN/DNA was around 80%.
Figure 3 Optimization of the modification ratios for (A) pre-MN-PEG-PE-modified SLN/DNA and (B) post-MN-PEG-PE-modified SLN/DNA.
Abbreviations: SLN, solid lipid nanoparticles; MN, mannan; PEG, polyethylene glycol; PE, L-α-phosphatidylethanolamine.
Postmodified SLN/DNA
SLN were firstly incubated with pEGFP to form SLN/DNA. The MN-PEG-PE ligands were next coated onto the SLN/DNA surface to form B-MN-SLN/DNA. As shown in , the optimized ratio of MN-PEG-PE to SLN/DNA was 40%. This ratio was used for the further experiments. The gene loading efficiency of B-MN-SLN/DNA was around 87%.
Characterization of premodified and postmodified MN-SLN/DNA
The mean particle size, polydispersity index, and zeta potential of SLN, MN-SLN, SLN/DNA, A-MN-SLN/DNA, and B-MN-SLN/DNA were characterized and are shown in .
Table 1 Particle size and zeta potential of different vectors
Determination of MN-PEG-PE modification
A Con A agglutination assay was used to confirm further that the MN-PEG-PE ligands were successfully modified onto the vector surface. As shown in , the turbidity of A-MN-SLN/ DNA and B-MN-SLN/DNA appeared to increase, while the SLN and SLN/DNA formulations appeared to show no significant increase in turbidity.
Figure 4 Con A agglutination assay of different vectors.
Abbreviations: SLN, solid lipid nanoparticles; A-MN-SLNs/DNA, pre-MN-PEG-PE-modified SLN/DNA; B-MN-SLNs/DNA, post-MN-PEG-PE-modified SLN/DNA; MN, mannan; PEG, polyethylene glycol; PE, L-α-phosphatidylethanolamine.
In vitro cytotoxicity evaluation
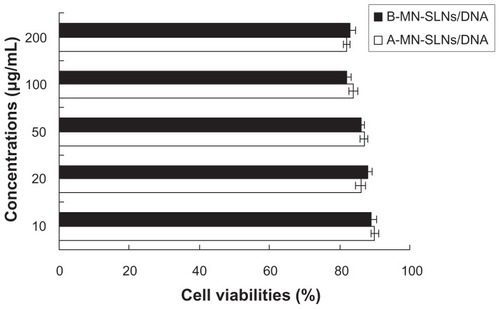
The in vitro cytotoxicity of A-MN-SLN/DNA and B-MN-SLN/ DNA against Kupffer cells was evaluated at various concentrations by MTT assay. The cell viability of the vectors over the studied concentration range (10–200 μg/mL) was between 80% and 100% compared with controls ().
Figure 5 Viability of Kupffer cells targeted with A-MN-SLN/DNA and B-MN-SLN/DNA.
Abbreviations: SLN, solid lipid nanoparticles; A-MN-SLNs/DNA, pre-MN-PEG-PE-modified SLN/DNA; B-MN-SLNs/DNA, post-MN-PEG-PE-modified SLN/DNA; MN, mannan; PEG, polyethylene glycol; PE, L-α-phosphatidylethanolamine.
In vitro release and in vitro transfection analysis
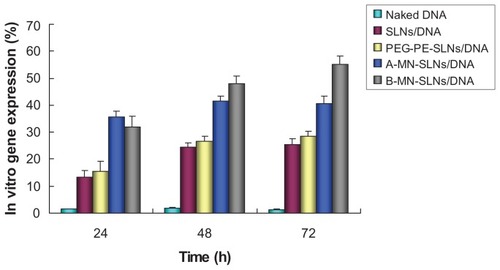
The in vitro release profiles for A-MN-SLN/DNA and B-MN-SLN/ DNA are shown in . Both the premodified and postmodified SLN/DNA reached over 80% gene release after 72 hours. The in vitro transfection efficiency of A-MN-SLN/ DNA and B-MN-SLN/DNA in Kupffer cells after 72 hours of transfection was analyzed and compared with naked DNA, unmodified SLN/DNA, and PEG-PE-SLN/DNA (). B-MN-SLN/DNA showed higher transfection efficiency than A-MN-SLN/DNA at 48 and 72 hours after transfection (P < 0.05).
Figure 6 In vitro release profiles of A-MN-SLN/DNA and B-MN-SLN/DNA.
Abbreviations: SLN, solid lipid nanoparticles; A-MN-SLNs/DNA, pre-MN-PEG-PE-modified SLN/DNA; B-MN-SLNs/DNA, post-MN-PEG-PE-modified SLN/DNA; MN, mannan; PEG, polyethylene glycol; PE, L-α-phosphatidylethanolamine; pEGFP, plasmid-enhanced green fluorescent protein.
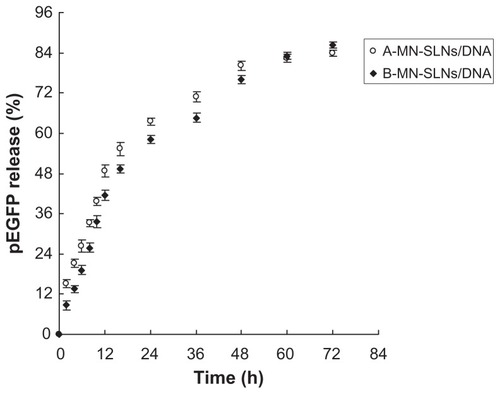
Figure 7 In vitro transfection efficiency of A-MN-SLN/DNA and B-MN-SLN/DNA in Kupffer cells after transfection for 24, 48, and 72 hours.
Abbreviations: SLN, solid lipid nanoparticles; A-MN-SLNs/DNA, pre-MN-PEG-PE-modified SLN/DNA; B-MN-SLNs/DNA, post-MN-PEG-PE-modified SLN/DNA; MN, mannan; PEG, polyethylene glycol; PE, L-α-phosphatidylethanolamine.
In vivo gene delivery
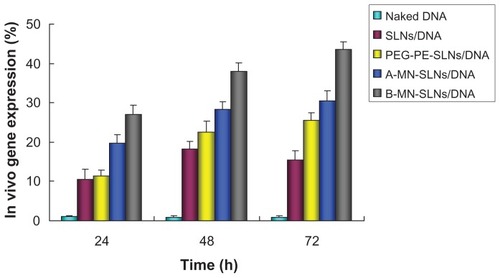
The in vivo transfection efficiency of A-MN-SLN/DNA and B-MN-SLN/DNA was observed and is shown in . B-MN-SLN/DNA had higher transfection efficiency at different time intervals compared with the other vectors. Flow cytometry was used to quantitate further the amount of cells which had been successfully transfected. As shown in , B-MN-SLN/DNA showed a remarkably higher transfection efficiency compared with A-MN-SLN/DNA and unmodified SLN/DNA (P < 0.05).
Figure 8 Fluorescent images of Kupffer cells transfected with naked pEGFP (A), SLN/DNA (B), PEG-PE-SLN/DNA (C), A-MN-SLN/DNA (D), and B-MN-SLN/DNA (E) at 24, 48, and 72 hours after transfection.
Abbreviations: SLN, solid lipid nanoparticles; A-MN-SLNs/DNA, pre-MN-PEG-PE-modified SLN/DNA; B-MN-SLNs/DNA, post-MN-PEG-PE-modified SLN/DNA; MN, mannan; PEG, polyethylene glycol; PE, L-α-phosphatidylethanolamine; pEGFP, plasmid-enhanced green fluorescent protein.
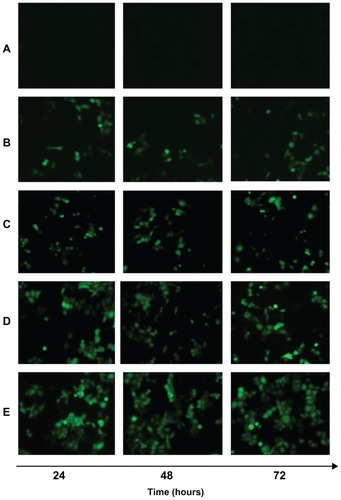
Figure 9 In vivo transfection efficiency of A-MN-SLN/DNA and B-MN-SLN/DNA in Kupffer cells after transfection for 24, 48, and 72 hours.
Abbreviations: SLN, solid lipid nanoparticles; A-MN-SLNs/DNA, pre-MN-PEG-PE-modified SLN/DNA; B-MN-SLNs/DNA, post-MN-PEG-PE-modified SLN/DNA; MN, mannan; PEG, polyethylene glycol; PE, L-α-phosphatidylethanolamine.
Discussion
The applications of ligand-PEG modification of nanocarriers have emerged as well recognized strategies to provide these vectors with active targeting properties using a wide assortment of covalently attached targeting ligands.Citation32 A series of PEG-PE conjugates has been used for the modification of various vehicles to create active targeting nanocarriers capable of spontaneous accumulation at specific sites.Citation33–Citation36 In this research, novel conjugated mannan-containing PEG-PE ligands were synthesized and MN-PEG-PE-modified SLN were investigated. Here, mannan is the target moiety which can bind to the mannose receptor in the macrophage, and PEG-PE is the spacer linked onto the surface of the SLN. It has been suggested that the length and flexibility of the spacer between the carbohydrate head group and carrier surface mainly influences the target specificity and uptake of vectors by macrophages.Citation37 Use of PEG-PE conjugates has been reported and TATp-PEG2000-PE conjugates have been applied for modification of nanocarriers to form active targeting vectors,Citation38 so PEG2000-PE was used as the anchor.
In our research, we are investigating which form of modification is better, ie, premodification to form newly modified vectors or postmodification after DNA has been loaded. In this study, we compared the two methods of modification using the same ligands. Our investigation began with preparation and optimization of the MN-PEG-PE modification ratio for the two kinds of modification. As shown in , A-MN-SLN/DNA refers to SLN which had been previously modified by MN-PEG-PE to form MN-SLN and then incubated with pEGFP; whereas B-MN-SLN/DNA were prepared by firstly binding DNA with SLN followed by coating of the MN-PEG-PE ligands. The modification ratios of A-MN-SLN/DNA and B-MN-SLN/DNA were approximately the same (40%, ligands/vectors, w/w). The gene loading efficiency of B-MN-SLN/DNA was slightly higher than that of A-MN-SLN/DNA (80%–87%). This may be explained as follows. The complexation of genes by SLN was void-free, and subsequent coating of ligands did not affect the gene binding capacity, whereas premodified SLN were coated with ligands first and this may have had some influence on gene complexation caused a slight decrease in loading efficacy.
When the modification ratios of the two kinds of vectors had been determined, A-MN-SLN/DNA and B-MN-SLN/ DNA were prepared and characterized. The mean particle sizes of A-MN-SLN/DNA and B-MN-SLN/DNA were about 223 nm and 185 nm, respectively. The premodified vectors was larger than the postmodified vectors, which might be because complexation of A-MN-SLN with DNA was not as tight as for B-MN-SLN/DNA. The polydispersity index of B-MN-SLN/DNA was smaller than for A-MN-SLN/DNA, which had a relatively narrow size distribution. These differences in physical properties may have affected the chemical characteristics of the vehicles. The zeta potentials of the two types of carrier were approximately +20 mV, and the positive surface charge could have enhanced the combination of the vectors with the negative charged cell surfaces and facilitated endocytosis.
Con A was the first legume lectin recognized as one of the mannose-specific lectins, and is believed to play a role in recognition of mannose-containing vectors.Citation39,Citation40 It has been used extensively for evaluation of glycoconjugates.Citation41,Citation42 Binding of the terminal α-mannose residues to Con A causes agglutination of the complexes in solution, resulting in an increase in turbidity. As shown in , when incubated with Con A solution, both A-MN-SLN/DNA and B-MN-SLN/ DNA appeared to show an increase in turbidity, whereas SLN and SLN/DNA formulations appeared to show no significant increase in turbidity. This could be evidence of the success of mannan-containing ligands modified onto an SLN surface using both premodification and postmodification methods.
An in vitro release study was carried out in order to show the release profiles of the two kinds of vectors. The release of premodified carriers was faster during the 48 hours of study (), which may be because the complex was not as tight as for the postmodified vehicles, and DNA release from SLN was easier. After 48 hours, the accumulated gene release from B-MN-SLN/DNA caught up with the steps of A-MN-SLN/DNA. Both the premodified and postmodified SLN/DNA reached over 80% gene release at 72 hours. Could the faster release of A-MN-SLN/DNA during 48 hours win some efficiency at the same time points in transfection studies? Or maybe the compact B-MN-SLN/DNA would be more effective?
Kupffer cells are liver-specific resident macrophages that play an integral part in the physiological homeostasis of the liver. In this study, rat Kupffer cells were isolated and used as model cells for in vitro cytotoxicity evaluation and transfection analysis. As shown in , modified carriers showed obviously higher efficiency than PEG-PE- SLN/ DNA, unmodified SLN/DNA, or naked DNA (P < 0.05). At 24 hours after transfection, the transfection ability of A-MN-SLN/DNA and B-MN-SLN/DNA was almost the same (P > 0.05). A-MN-SLN/DNA showed higher transfection efficiency than B-MN-SLN/DNA at 48 and 72 hours following transfection (P < 0.05). The results are interesting here because the in vitro release of A-MN-SLN/DNA was less than for B-MN-SLN/DNA at 48 hours, while the in vitro transfection efficiency was better. Could this phenomenon be evidence of better targeting ability for the postmodified system? This question should be answered on completion of our in vivo gene delivery studies.
In vivo gene delivery and expression assays were used in an animal model to compare the gene-delivering ability of premodified and postmodified gene vectors. After intravenous injection, rats in this study were euthanized, and their Kupffer cells were isolated and analyzed using inverted fluorescence microscopy () and flow cytometry (). B-MN-SLN/DNA showed better transfection efficiency than A-MN-SLN/DNA at 24, 48, and 72 hours. These results demonstrate that the postmodified SLN had more significant targeting ability for rat liver Kupffer cells, could deliver more genes into the cells, and displayed higher transfection efficiency. The high transfection efficiency at 72 hours after injection indicates the controlled-release features of the vehicles.
This in vitro and in vivo evidence of gene transfection strongly supports the active targeting ability of mannan-containing PEG-PE-modified gene-loaded SLN. Moreover, the results indicate that postmodified gene carriers are superior to premodified gene vectors, although the latter are also promising for targeted gene delivery. This observation will guide our future research, and could be a reference for modification of nanocarriers for targeted gene delivery.
Conclusion
The results of this study are consistent with the observations of other researchers in this area, ie, that mannose-mediated targeting can successfully deliver genes into cells that express the mannose receptor. We conclude that postmodification of gene-loaded nanomedicine has an advantage over premodification. By carefully formulating the carriers with an optimal ratio of MN-PEG-PE, postmodified vehicles displayed more efficient gene expression in rat Kupffer cells both in vitro and in vivo. This evidence strongly supports the active targeting ability of mannan-containing PEG-PE-modified gene carriers. Most importantly, the proof of superiority of postmodified gene delivery vectors has provided a reference point for further studies on this area.
Abbreviations
| UL | = | upper left |
| UR | = | upper right |
| LL | = | lower left |
| LR | = | lower right |
| SLN | = | solid lipid nanoparticles |
| A-MN-SLN/DNA | = | pre-MN-PEG-PE-modified SLN/DNA |
| B-MN-SLN/DNA | = | post-MN-PEG-PE-modified SLN/DNA |
| MN | = | mannan |
| PEG | = | polyethylene glycol |
| PE | = | L-α-phosphatidylethanolamine |
| pEGFP | = | plasmid-enhanced green fluorescent protein |
Supplementary data
In vivo gene delivery ()
Details of the experiments and data analysis are as follows: Cells were washed in cold phosphate-buffered saline three times and the fluorescence intensity of the cells was determined using a flow cytometer equipped with a 488 nm argon laser for excitation. For each sample, about 10,000 events were collected and fluorescence was detected. Signals were amplified in logarithmic mode for fluorescence to determine the positive events by a standard gating technique. The percentage of positive events was calculated as the events within the gate divided by the total number of events, excluding cell debris. The percentage of cells transfected with plasmid-enhanced green fluorescent protein appeared at the upper right and lower right quadrants of the diagram. The data for the quadrantal diagram of the in vivo study are as follows:
Naked plasmid-enhanced green fluorescent protein 24 hours post transfection
Quad X mean Y mean Events%Total%Gated
UL 6.8 18.3 5 0.04 74.01
UR 107.6 78.6 31 0.26 1.18
LL 2.4 8.5 11986 97.42 24.33
LR 43.8 14.1 65 0.54 0.47
Gene expression UR + LR = 1.65%
Naked plasmid-enhanced green fluorescent protein 48 hours post transfection
Quad X mean Y mean Events%Total%Gated
UL 6.8 18.3 5 0.04 69.27
UR 107.6 78.6 31 0.26 2.03
LL 2.4 8.5 11986 97.42 28.38
LR 43.8 14.1 65 0.54 0.32
Gene expression: UR + LR = 2.35%
Naked plasmid-enhanced green fluorescent protein 72 hours post transfection
Quad X mean Y mean Events%Total%Gated
UL 6.8 18.3 5 0.04 71.36
UR 107.6 78.6 31 0.26 1.47
LL 2.4 8.5 11986 97.42 26.39
LR 43.8 14.1 65 0.54 0.75
Gene expression: UR + LR = 2.22%
SLN/DNA 24 hours post transfection
Quad X mean Y mean Events%Total%Gated
UL 6.8 18.3 5 0.04 61.72
UR 107.6 78.6 31 0.26 5.56
LL 2.4 8.5 11986 97.42 27.86
LR 43.8 14.1 65 0.54 4.86
Gene expression: UR + LR = 10.42%
SLN/DNA 48 hours post transfection
Quad X mean Y mean Events%Total%Gated
UL 6.8 18.3 5 0.04 58.24
UR 107.6 78.6 31 0.26 12.41
LL 2.4 8.5 11986 97.42 23.79
LR 43.8 14.1 65 0.54 5.52
Gene expression: UR + LR = 17.93%
SLN/DNA 72 hours post transfection
Quad X mean Y mean Events%Total%Gated
UL 6.8 18.3 5 0.04 58.24
UR 107.6 78.6 31 0.26 12.41
LL 2.4 8.5 11986 97.42 23.79
LR 43.8 14.1 65 0.54 5.52
Gene expression: UR + LR = 17.93%
PEG-PE-SLN/DNA 24 hours post transfection
Quad X mean Y mean Events%Total%Gated
UL 6.8 18.3 5 0.04 70.06
UR 107.6 78.6 31 0.26 6.40
LL 2.4 8.5 11986 97.42 18.61
LR 43.8 14.1 65 0.54 4.93
Gene expression: UR + LR = 11.33%
PEG-PE-SLN/DNA 48 hours post transfection
Quad X mean Y mean Events%Total%Gated
UL 6.8 18.3 5 0.04 52.16
UR 107.6 78.6 31 0.26 16.87
LL 2.4 8.5 11986 97.42 25.30
LR 43.8 14.1 65 0.54 5.65
Gene expression: UR + LR = 22.52%
PEG-PE-SLN/DNA 72 hours post transfection
Quad X mean Y mean Events%Total%Gated
UL 6.8 18.3 5 0.04 49.35
UR 107.6 78.6 31 0.26 19.08
LL 2.4 8.5 11986 97.42 25.05
LR 43.8 14.1 65 0.54 6.52
Gene expression: UR + LR = 25.6%
A-MN-SLN/DNA 24 hours post transfection
Quad X mean Y mean Events%Total%Gated
UL 6.8 18.3 5 0.04 57.53
UR 107.6 78.6 31 0.26 11.42
LL 2.4 8.5 11986 97.42 22.82
LR 43.8 14.1 65 0.54 8.23
Gene expression: UR + LR = 19.65%
A-MN-SLN/DNA 48 hours post transfection
Quad X mean Y mean Events%Total%Gated
UL 6.8 18.3 5 0.04 46.36
UR 107.6 78.6 31 0.26 22.48
LL 2.4 8.5 11986 97.42 25.25
LR 43.8 14.1 65 0.54 5.88
Gene expression: UR + LR = 28.36%
A-MN-SLN/DNA 72 hours post transfection
Quad X mean Y mean Events%Total%Gated
UL 6.8 18.3 5 0.04 48.78
UR 107.6 78.6 31 0.26 20.93
LL 2.4 8.5 11986 97.42 20.77
LR 43.8 14.1 65 0.54 9.52
Gene expression: UR + LR = 30.45%
B-MN-SLN/DNA 24 hours post transfection
Quad X mean Y mean Events%Total%Gated
UL 6.8 18.3 5 0.04 49.74
UR 107.6 78.6 31 0.26 17.78
LL 2.4 8.5 11986 97.42 23.14
LR 43.8 14.1 65 0.54 9.34
Gene expression: UR + LR = 27.12%
B-MN-SLN/DNA 48 hours post transfection
Quad X mean Y mean Events%Total%Gated
UL 6.8 18.3 5 0.04 44.73
UR 107.6 78.6 31 0.26 25.15
LL 2.4 8.5 11986 97.42 17.21
LR 43.8 14.1 65 0.54 12.88
Gene expression: UR + LR = 38.03%
B-MN-SLN/DNA 72 hours post transfection
Quad X mean Y mean Events%Total%Gated
UL 6.8 18.3 5 0.04 37.26
UR 107.6 78.6 31 0.26 32.67
LL 2.4 8.5 11986 97.42 19.23
LR 43.8 14.1 65 0.54 10.83
Gene expression: UR + LR = 43.5%
Disclosure
The authors report no conflicts of interest in this work.
References
- PathakAVyasSPGuptaKCNano-vectors for efficient liver specific gene transferInt J Nanomedicine200831314918488414
- TorchilinVPTargeted pharmaceutical nanocarriers for cancer therapy and imagingAAPS J200792E12814717614355
- KimSKParkKMSinghaKGalactosylated cucurbituril-inclusion polyplex for hepatocyte-targeted gene deliveryChem Commun (Camb)201046569269420087489
- BoulaizHMarchalJAPradosJMelguizoCAránegaANon-viral and viral vectors for gene therapyCell Mol Biol (Noisy-le-grand)200551132216171561
- ZhaoXBLeeRJTumor-selective targeted delivery of genes and antisense oligodeoxyribonucleotides via the folate receptorAdv Drug Deliv Rev20045681193120415094215
- TorchilinVPMultifunctional nanocarriersAdv Drug Deliv Rev200658141532155517092599
- YuWZhangNSurface modification of nanocarriers for cancer therapyCurr Nanosci200952123134
- LiSDHuangLSurface-modified LPD nanoparticles for tumor targetingAnn N Y Acad Sci200610821817145918
- Juillerat-JeanneretLSchmittFChemical modification of therapeutic drugs or drug vector systems to achieve targeted therapy: looking for the grailMed Res Rev200727457459017022028
- ChavanpatilMDKhdairAPanyamJNanoparticles for cellular drug delivery: mechanisms and factors influencing deliveryJ Nanosci Nanotechnol200669–102651266317048473
- PeetersLSandersNNJonesADemeesterJDe SmedtSCPostpegylated lipoplexes are promising vehicles for gene delivery in RPE cellsJ Control Release2007121320821717630013
- KolhatkarRBKitchensKMSwaanPWGhandehariHSurface acetylation of polyamidoamine (PAMAM) dendrimers decreases cytotoxicity while maintaining membrane permeabilityBioconjug Chem20071862054206017960872
- KojimaCKonoKMaruyamaKTakagishiTSynthesis of polyamidoamine dendrimers having poly(ethylene glycol) grafts and their ability to encapsulate anticancer drugsBioconjug Chem200011691091711087341
- PatriAKKukowska-LatalloJFBakerJRJrTargeted drug delivery with dendrimers: comparison of the release kinetics of covalently conjugated drug and non-covalent drug inclusion complexAdv Drug Deliv Rev200557152203221416290254
- ForrestMLZhaoAWonCYMalickAWKwonGSLipophilic prodrugs of Hsp90 inhibitor geldanamycin for nanoencapsulation in poly(ethylene glycol)-b-poly(epsilon-caprolactone) micellesJ Control Release2006116213914916926059
- WeissBSchneiderMMuysLCoupling of biotin-(poly(ethylene glycol))amine to poly(D,L-lactide-co-glycolide) nanoparticles for versatile surface modificationBioconjug Chem20071841087109417590034
- LiSDChenYCHackettMJHuangLTumor-targeted delivery of siRNA by self-assembled nanoparticlesMol Ther200816116316917923843
- YamadaMNishikawaMKawakamiSTissue and intrahepatic distribution and subcellular localization of a mannosylated lipoplex after intravenous administration in miceJ Control Release200498115716715245897
- KitaniHTakenouchiTSatoMYoshiokaMYamanakaNA novel isolation method for macrophage-like cells from mixed primary cultures of adult rat liver cellsJ Immunol Methods20103601–2475520600081
- YuWLiuCLiuYZhangNXuWMannan-modified solid lipid nanoparticles for targeted gene delivery to alveolar macrophagesPharm Res20102781584159620422265
- LobovkinaTJacobsonGBGonzalez-GonzalezEIn vivo sustained release of siRNA from solid lipid nanoparticlesACS Nano20115129977998322077198
- ZhangSYunJShenSFormation of solid lipid nanoparticles in a microchannel system with a cross-shaped junctionChem Eng Sci2008632356005605
- AhnSJCostaJEmanuelJRPicoGreen quantitation of DNA: effective evaluation of samples pre- or post-PCRNucleic Acids Res19962413262326358692708
- RenXXuQHLabel-free DNA sequence detection with enhanced sensitivity and selectivity using cationic conjugated polymers and PicoGreenLangmuir2009251434719209388
- IkedaYIwakiriSYoshimoriTDevelopment and characterization of a novel host cell DNA assay using ultra-sensitive fluorescent nucleic acid stain “PicoGreen”J Pharm Biomed Anal2009494997100219217735
- LeeJYCheongIWKimJHAgglutination study of poly(allyl-alpha-D-glucopyranose/ styrene) latex particles in the presence of concanavalin AColloids Surf B Biointerfaces2005412–320320815737548
- CuiZHanSJHuangLCoating of mannan on LPD particles containing HPV E7 peptide significantly enhances immunity against HPV-positive tumorPharm Res20042161018102515212168
- CuiZMumperRJTopical immunization using nanoengineered genetic vaccinesJ Control Release2002811–217318411992690
- KongFZhouFGeLLiuXWangYMannosylated liposomes for targeted gene deliveryInt J Nanomedicine201271079108922393297
- GaoYGuWChenLXuZLiYA multifunctional nano device as non-viral vector for gene delivery: in vitro characteristics and transfectionJ Control Release2007118338138817321625
- YuWLiuCYeJZouWZhangNXuWNovel cationic SLN containing a synthesized single-tailed lipid as a modifier for gene deliveryNanotechnology200920121510219423923
- van VlerkenLEVyasTKAmijiMMPoly(ethylene glycol)-modified nanocarriers for tumor-targeted and intracellular deliveryPharm Res20072481405141417393074
- LukyanovANGaoZMazzolaLTorchilinVPPolyethylene glycoldiacyl lipid micelles demonstrate increased accumulation in subcutaneous tumors in micePharm Res200219101424142912425458
- TorchilinVPRecent advances with liposomes as pharmaceutical carriersNat Rev Drug Discov20054214516015688077
- TorchilinVPMicellar nanocarriers: pharmaceutical perspectivesPharm Res200724111617109211
- YangLWangLSuXQSuppression of ovarian cancer growth via systemic administration with liposome-encapsulated adenovirus-encoding endostatinCancer Gene Ther2010171495719609295
- YuWZhangNLiCSaccharide modified pharmaceutical nanocarriers for targeted drug and gene deliveryCurr Pharm Des200915323826383619925431
- SawantRMHurleyJPSalmasoS“SMART” drug delivery systems: double-targeted pH-responsive pharmaceutical nanocarriersBioconjug Chem200617494394916848401
- SummerJBHowellSFThe identification of the hemagglutinin of the jack bean with concanavalin AJ Bacteriol193632222723716559945
- BarreABourneYVan DammeEJPeumansWJRougePMannose- binding plant lectins: different structural scaffolds for a common sugar-recognition processBiochimie200183764565111522393
- KizhakkedathuJNCreaghALShenoiRAHigh molecular weight polyglycerol-based multivalent mannose conjugatesBiomacromolecules201011102567257520804173
- WolfendenMLCloningerMJMannose/glucose-functionalized dendrimers to investigate the predictable tunability of multivalent interactionsJ Am Chem Soc200512735121681216916131163