
Abstract
Introduction
Small extracellular vesicles (sEVs), thanks to their cargo, are involved in cellular communication and play important roles in cell proliferation, growth, differentiation, apoptosis, stemness and embryo development. Their contribution to human pathology has been widely demonstrated and they are emerging as strategic biomarkers of cancer, neurodegenerative and cardiovascular diseases, and as potential targets for therapeutic intervention. However, the use of sEVs for medical applications is still limited due to the selectivity and sensitivity limits of the commonly applied approaches.
Methods
Novel sensing solutions based on nanomaterials are arising as strategic tools able to surpass traditional sensor limits. Among these, Si nanowires (Si NWs), realized with cost-effective industrially compatible metal-assisted chemical etching, are perfect candidates for sEV detection.
Results
In this paper, the realization of a selective sensor able to isolate, concentrate and quantify specific vesicle populations, from minimal volumes of biofluid, is presented. In particular, this Si NW platform has a detection limit of about 2×10⁵ sEVs/mL and was tested with follicular fluid and blastocoel samples. Moreover, the possibility to detach the selectively isolated sEVs allowing further analyses with other approaches was demonstrated by SEM analysis and several PCRs performed on the RNA content of the detached sEVs.
Discussion
This platform overcomes the limit of detection of traditional methods and, most importantly, preserves the biological content of sEVs, opening the route toward a reliable liquid biopsy analysis.
Introduction
Various biomarkers have been discovered and characterized as novel tools to quickly and easily monitor a patient’s health state related to different diseases.Citation1–Citation5 Among these, extracellular vesicles (EVs) and their content have taken on an increasingly important role in the last few years. EVs, commonly identified as a heterogeneous membrane vesicle populationCitation6–Citation9 including large EVs (lEVs) and small EVs (sEVs) carry proteins, lipids, RNA, and DNA, from one cell to another.Citation10–Citation12 The analysis of their cargo has found different applications in precision medicine providing diagnostic, prognostic, and/or therapeutic information. In oncology research and diagnosis,Citation10,Citation13,Citation14 liquid biopsy represents the most promising application. The isolation and purification of sEVs from biological fluids, (serum or plasma) and the molecular analysis of their cargo offer the possibility of monitoring tumor state without the use of invasive surgical procedures. The liquid biopsy strategy has also been proposed for other diseases such as cardiovascular diseasesCitation15 or atherosclerosis.Citation16 Moreover, in In vitro Fertilization (IVF) procedures sEV analysis may be able to predict the success of a pregnancy, replacing the more invasive pre-implantation genetic diagnosis technologies.Citation17 Despite remarkable progress in EV research, the complexity and challenges associated with the lack of standard methods to accurately isolate, characterize and quantify them remain considerable.Citation18
The most widely used techniques to isolate sEVs (ultracentrifugation, density gradients, precipitation, filtration, size exclusion chromatography, and immunoisolation) have many drawbacks including the co-isolation of EV subtypes, sample contamination with protein aggregates, low RNA yield, and the modification of the biophysical properties of the isolated vesicles.Citation18–Citation20 In the last few years, new methods able to distinguish EV subpopulations from EV isolates have been proposed. Capillary electrophoresis (CE) that separates analytes in a capillary tube under the influence of an electric field according to their different charge-to-hydrodynamic radius ratios, has recently been described for the characterization of EV preparations with ultraviolet (UV) or fluorescence detection.Citation21–Citation23 In 2019, Zhang and Lyden optimized asymmetric-flow field-flow fractionation technology for separating and characterizing extracellular nanoparticles, particularly exosomes.Citation24
Moreover, these procedures require bulky and expensive instrumentation, time-consuming and laborious processing, and large amounts of the starting samples.Citation28 Considering that their concentration in biological fluids depend on the number of cells involved in the secretion and up-take as well as changes in different physiological or pathological conditions (infectious diseases, cellular senescence, age-related neurodegenerative diseases, and cancer), the concentration may be very low to make impossible their isolation and an accurate quantification. For example, in the fluid produced by the embryo during the early stages of preimplantation development (blastocoel fluid) their concentrations are so low that it is not possible to isolate and measure them with the techniques available today.Citation17
An interesting approach is micro-Nuclear Magnetic Resonance (µNMR), based on the labeling of sEVs through magnetic beads (diameter around 500 nm) that are read in a microfluidic chip after filtering larger vesicles.Citation25 Despite the remarkable limit of detection (LOD) of 107 Ex/mL this sensor requires a microfluidic approach with high costs that limit its application.
The innovative properties of nanomaterials, as well as their increased high surface to volume ratio, make nanotechnology a strategic tool to overcome standard sensor limits.Citation26–Citation28 Surface Plasmon Resonance (SPR) is based on the refractive index change upon the target binding to the transduction sensor interface.Citation29–Citation33 A nanoplasmonic system called nPLEX has a LOD 100 times better than ELISA (whose LOD is around 108 EX/mL) for sEV detection.Citation34 A drawback is the high cost of the microelectronics-grade fabrication requirement of this platform, which makes a capillary diffusion of these sensors difficult.Citation34
Sensors do not couple selectivity, high sensitivity, and small volume analysis that are indeed considered strategic for several EV applications and they are commonly characterized by a high production cost and the incompatibility of their synthesis approaches with current industrial technology.
A silicon-based platform is of absolute interest for real marketable applications and 1D materials such as Si NW are emerging as an integrable solution with the standard technology offering a robust platform with very a high aspect ratio and exposed surface.Citation35–Citation40 Si NW-based sensors are commonly based on the electrical signal variation in field effect transistor configuration with a very high cost of fabrication and electrical addressing due to the lithographic processes required.Citation41,Citation42
Recently, we have demonstrated the realization of room temperature (RT) luminescent Si NWs by a cost-effective, fast, and industrially compatible approachCitation43–Citation45 that opens the route to a novel class of sensors. Si NW label-free luminescent sensors have demonstrated high selectivity guaranteed by proper functionalization processes and high sensitivity able to surpass standard bulk approaches such as ELISA by several orders of magnitude,Citation46,Citation47 providing a robust and very appealing platform for real commercial transfer.
Our proposed Si NW luminescent sensing system can be functionalized with a specific antibody able to selectively bind the vesicles that present the respective antigen. In this work, we were able to isolate, concentrate, and quantify sEV CD81+ with a sensitivity higher than the actual nanostructured sensors, with a key working range, expressed as sEVs/mL (Ex/mL) concentration, which is found in most bio-fluid analyses. The high sensitivity allowed us to isolate sEV CD81+ and estimate their concentration in a very small volume of blastocoel fluid from a single embryo. Moreover, we demonstrated that it is possible to recover sEVs, and that the isolation, quantification, and detachment procedures do not cause nucleic acid degradation. We believe that our platform, being able to be functionalized with different antibodies, opens very interesting perspectives for the future application of liquid biopsy in personalized medicine and in preimplantation genetic analysis.
Results
Si NW Fabrication
The fabrication of circular Si NW cavities was carried out, obtaining a working area with an accurately determined size, and we performed the measurements on a well-defined functionalized area with a highly reproducible protocol.
Exposed Si circular cavities of 100-400 µm in diameter were obtained by a photolithographic process (see Supplementary Information, section 1). The formation of Si NWs is driven by the use of a percolative metal film deposited by an electron beam evaporator and, thanks to the photolithographic mask, the metal deposition was obtained only in the target area, ie, the designed circular spot. Thus, Si NWs were realized only inside these cavities, as reported in the experimental section. This approach also enables the fabrication of multi-probe arrays, considering that the fabricated circular cavities can serve as an embedded microfluidic platform for very precise sample confinement on the chip.
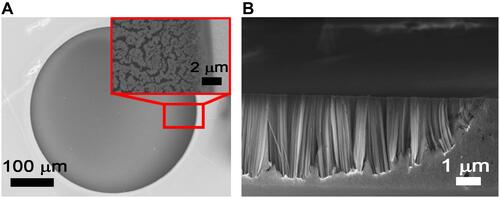
In and , the SEM images of the synthetized Si NWs in the circular cavities are shown, in plan view and in cross section, respectively. In the inset of a magnification of one of the borders is shown, which shows the Si NW morphology, highlighting the high uniformity and the defined development of these structures. The cross section shown in clearly shows the profile of the cavity border where it is possible to see that the Si NW growth on that region (about 2 µm wide) is affected by the photoresist mask wall-effect on solution diffusive processes. Outside this small region (about 2% of the cavity diameter), Si NWs show a narrowly distributed length of 3.3 µm.
Figure 1 (A) Plan view SEM image of the Si NW cavity designed. In the inset the border part attesting the good features of the Si NWs is reported. (B) cross section SEM image of the Si NWs showing the good quality also near the border.
Functionalization Procedure
An ad-hoc protocol of functionalization of the silicon nanowires was carried out to make the sensor highly selective for the detection of the CD81+ sEVs towards other vesicles. This protocol is based on the know-how previously developed by our group in the realization of Si NWs-based sensorsCitation46,Citation47 and it is shown in – (more details in the experimental section). Finally, the obtained sensing platform was tested with standard solutions at different concentrations of sEVs ().
Figure 2 Starting from a to d the schematic representation of the functionalization protocol is reported: (A) Si NW sample, (B) streptavidin (SA) and (C) biotinylated antiCD81 functionalization. (D) sEVs CD81+ sensing. Confocal microscopy analysis step by step of the functionalization by using different fluorophores is reported in e-h. (E) Si NW bare signal obtained at 490 nm. (F) SA signal obtained exciting the coupled Alexa488. (G) Anti-CD81 signal obtained exciting its linked fluorophore Alexa 647. (H) sEVs CD81+ capture demonstration by using exosome-NBD-PE coupled and exciting the NBD-PE. All the details on the excitation condition and measure are reported in the Suppl. Info.
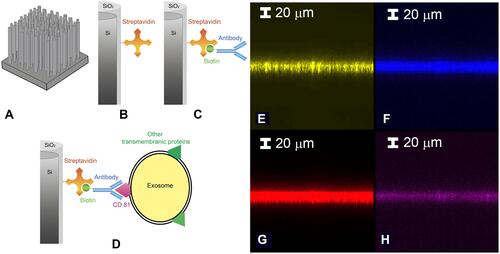
A confocal microscopy analysis was carried out to demonstrate the functionalization protocol efficacy and the ability of the Si NW sensor to capture target sEVs. In – the micrographs obtained by laser scanning confocal microscopy (LSCM) of the vertical sections (X-Z) of the Si NW layer are shown. The appropriate choice of the excitation and emission wavelengths (see Supplementary Information) discriminates the signal of just one type of marked molecule at a time. In this way, it is possible to analyze the correct functionalization of each step of the sequential binding of streptavidin, anti-CD81 and the capture of EVs.
In the signal obtained from the Si NWs is shown. The success of the functionalization is attested by the analysis shown in and showing the streptavidin and the biotinylated anti-CD81 signals, respectively. These signals coincide with the Si NW one demonstrating functionalization success.
EV Isolation
Anti-CD81 can selectively bind to the corresponding tetraspanin present on the surface of sEVs, thus anchoring the extracellular vesicles to the silicon NWs (as shown in ). The anchoring of the sEVs can also be probed by LSCM. For this purpose, the sEVs had been previously labelled with a phosphoethanolamine bearing the fluorophore NBD. shows the successful capture of the sEVs after the incubation of the sensor with the labelled sEVs, notwithstanding extensive washing.
After proving the effectiveness of the functionalization, a negative test was designed to demonstrate the selectivity of the Si NW platform.
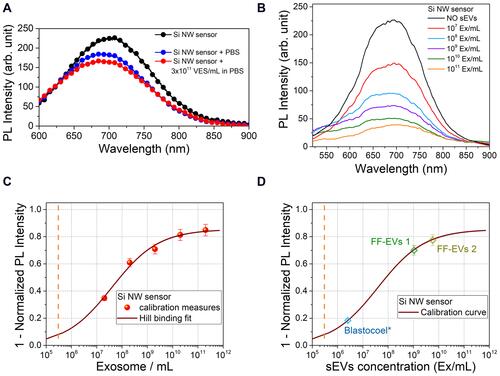
shows PL spectra, carried out at room temperature, of the as-synthetized Si NWs (black curve), as well as of the Si NWs after immersion in a PBS solution in presence or not of synthetic vesicles (VES, 100 nm diameter) used as an EV mimetic system. The figure shows that the presence of the PBS matrix causes a small quenching of the Si NW PL signal. However, a variation below 4% was detected in the presence of synthetic VES with a concentration of 3×10¹¹ VES/mL (red curve) demonstrating that the Si NW sensing platform does not respond to other types of vesicles, thus proving the high selectivity of the sensor.
Figure 3 (A) room temperature (RT) photoluminescence (PL) spectra of the Si NW platform (black) and after being tested with PBS with (red) and without (blue) non-specific vesicles (VES) with a concentration of 3×10¹¹ VES/mL. (B) RT PL spectra of the Si NW sensor tested with different sEVs concentration from 1011 to 107 Ex/mL. (C) Si NW sensor calibration curve obtained by the Hill’s binding model as 1- Normalized PL intensity (PL quenching) as a function of the sEvs concentration. The PL intensity is the Area of the Si NW PL Gaussian fit. (D) Concentration values of real follicular fluid sample from 2 older woman (FF-Evs 1, FF-Evs 2) and of a blastocoel* sample obtained by a 5µL blastocoel withdrawal diluted in 50 µL.
EV Quantification
The platform performance was tested with an sEV concentration range from 107 to 1011 sEVs/mL (Ex/mL) and the obtained PL spectra at room temperature are shown in . The signal of the sensor immersed in PBS without sEVs is shown in black and is considered the sensor reference signal. Increasing the concentration of the sEVs, a corresponding increase of the sensor PL quenching that is used as a sensing mechanism is clearly visible. Indeed, the calibration curve was obtained by plotting the quenching of the platform versus the concentration of the sEVs. The PL signals were obtained by fitting the Gaussian area of each spectrum and normalizing it to the area of the reference one: thus, the quenching value was obtained as the complementary part (the missing part) of the PL signal with respect to the reference one. In this way, the higher the sensor signal obtained, the higher the sEVs corresponding concentration. As shown in , this allowed us to fit the dose response curve with Hill’s binding model,Citation46,Citation48 commonly used to describe the performance of an antibody/antigen reaction. Further details on the model can be found within the Suppl. Information.
As shown in , a 35% Si NW PL quenching corresponds to a 107 Ex/mL concentration, while a further 26% PL quenching is observed reaching a 108 Ex/mL concentration. Between 108 and 1010 Ex/mL, the response of the sensor approaches a linear trend with a 10% variation for each increase of one order of magnitude of the sEVs concentration. Finally, from 1010 Ex/mL to 1011 Ex/mL, a small further quenching (an increase of just 4%) suggested that the sensor saturation was reached. The fitted calibration curve shows a LOD, estimated considering the concentration that corresponds at 2 times the average error on the PL response with respect to the minimum asymptotic value of the calibration curve, in the order of 2×10⁵ Ex/mL. This value surpasses the sEVs LOD obtained through bulk methods and nanostructures in the literature by at least 2 orders of magnitude. The adopted functionalization has already been successfully used for CRP analysis.Citation49 However, to prove the robustness of this result, all the reported PL measurements were performed on several sensors, always obtaining the same result within a few percentage points of relative error (as reported in the spectra in ).
Subsequently, the Si NW sensor was tested with some real samples, previously investigated with other standard approaches. In particular, the Si NW sensor was tested with sEVs purified from two follicular fluid (FF) samples (FF-EVs 1, FF-EVs 2) and with a sample of blastocoel fluid (BF) from a single embryo. Further details on these samples can be found in the Supplementary Information. The PL quenching obtained with these real samples was used to find the indirect concentration, thanks to the calibration curve obtained for the Si NW sensor. In , the measured PL quenching for FF and BF reported on the calibration curve shows the sEVs concentration measured by the Si NW sensor. In particular, for the FF-EVs 1 and FF-EVs 2 samples (for two samples of human FF), whose concentrations measured with the nanoparticle tracking analysis (NTA) were about 1–2×10¹¹ Ex/mL, concentrations of about 1 and 6×10⁹ Ex/mL were found, respectively. The difference between the values obtained through an immunoassay (as our Si NW sensor) and a non-selective method such as nanoparticle tracking analysis is quite common. Indeed, non-specific methods cannot distinguish sEVs among the other types of vesicles and thus the measured concentrations were higher than those obtained using a selective sensor as also observed comparing ELISA and NTA in our previous study.Citation17
Furthermore, our Si NW sensor was tested with one blastocoel fluid sample diluted in about 50 µL of H2O. The obtained result, indicated as blastocoel* in , shows a concentration of 2.6×10⁶ Ex/mL that corresponds to 1.6×10⁷ Ex/mL considering the added solvent (50 µL). The small amounts of volumes available for the measurement is a strong practical limit of the traditional approaches, whereas these samples are easily analyzable by this Si NW platform. In fact, a BF sample is commonly limited to a volume of 0.3–0.5nL (that are dissolved in a few microliters of H2O during sample withdrawal)Citation17 and thus the low sEV concentrations are not measurable in a sample from a single embryo through NTA or ELISA. The measurements are commonly carried out in a pool of several samples mixed together and to evaluate embryo competence in IVF cycles it is necessary to carry out the analysis on the individual embryo.Citation17 The measurements performed on a pool of three different samples for NTA and a pool of six samples for ELISA, indicate a concentration of 2.46×10⁹ Ex/mL by NTA and 3.3×10⁸ Ex/mL by ELISACitation17 by using anti-CD63. Moreover, in this case a strong difference (one order of magnitude) was found between selective and non-selective approaches.
EV Recovery and Molecular Analysis of the Cargo
Another challenge of strategic relevance is the selective isolation of sEVs for further studies. In fact, our sensor is able, after sEV quantification, to detach the selectively isolated sEVs, allowing a further analysis with other approaches (the protocol used for detaching EVs is reported in the Supplementary Material). To demonstrate this possibility, we investigated the sEVs selectively isolated from our Si NW platform and detached with a proper protocol by SEM analysis (bio-sample treatment in Supplementary Information). In a plan view SEM image obtained showing a distribution of sEVs is shown. We performed a statistical analysis on the SEM image of the detached sEVs finding a Gaussian distribution with an average size of 94 ± 32 nm and an imperfect agreement with the previous NTA measurements and typical for an sEV and exosome distribution.Citation17 As shown in the inset of , the morphology of the sEVs is preserved and is comparable before and after treatment.
Figure 4 (A) Plan view SEM image of a distribution of sEVs detached by the Si NW sensor after the selective isolation and quantification process following the protocol described in the Supp. Info. In the inset to a) a magnification of one of the detached sEV is shown. (B) MiR-212 detection, by TaqMan Real-Time RT-PCR, in FF-Evs isolated on Si NWs. A dual comparison has been performed: laser treatment (L) vs No laser treatment (NL) (light blue and orange bars); Qiazol storage (Q) vs PBS storage (P) (yellow and blue bars). No difference in miRNA concentration, reported as 2−Ct, has been found in relation to treatments and the storage protocols.
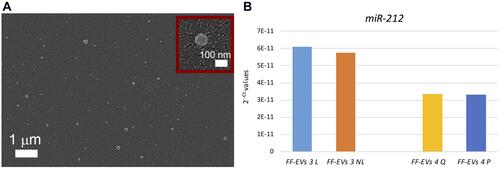
Finally, to demonstrate the possibility to perform molecular analysis on the EV cargo, we focused our attention on RNA molecules (miRNA and lncRNA) because they represent the most promising biomarkers. We verified that the optical analysis, by laser measurements, did not influence RNA quality and also that PBS or Qiazol can be used for the storage of NWs after EV capture (details and negative tests in the Supplementary Materials). shows the results of Real Time Polymerase Chain Reaction (RT-PCR) for miR-212 reported as 2−Ct values on two follicular fluid samples, indicated as FF-EVs 3 and 4.
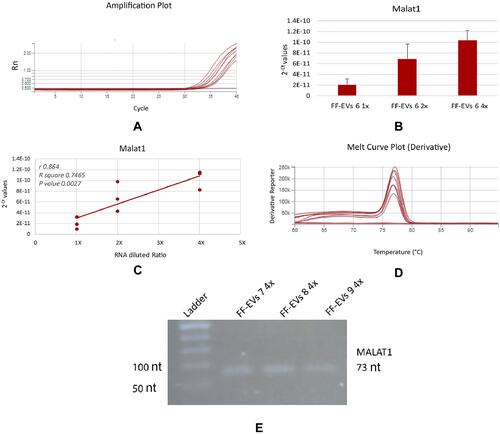
Finally, we demonstrated the integrity of RNA cargo inside the EVs isolated by our sensor, both for small RNAs (miRNA) and for long RNAs (lncRNA). We analyzed miR-132, miR-203 and MALAT1 in scalar dilutions of the same samples, by Real-Time RT-PCR. We found a significant correlation between the Ct values (represented as 2−Ct) and the three dilutions for both miRNAs and MALAT1 ( and ).
Figure 5 Detection of miR-132 (A and C) and miR-203 (B and D) in scalar dilutions of the same sample, assembled to three different Si NW platforms. TaqMan Real-Time RT-PCR amplification plots (A and B). For each reaction, technical triplicates have been performed and the means with Standard deviation of 2−Ct values have been reported (C and D). A significant linear relationship between RNA dilutions and 2−Ct values with r ranging from 0.9596 (E) and 0.9868 (F) and a P value <0.0001 was observed.
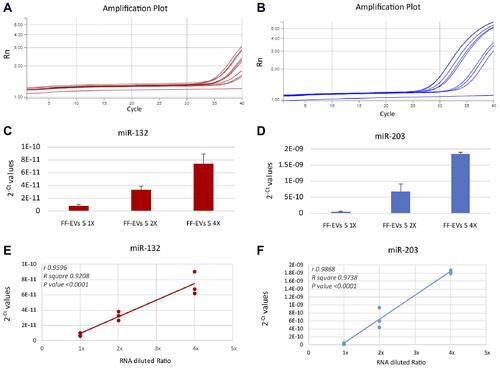
Figure 6 Detection of MALAT1 by SYBR Green Real-Time RT- PCR (A–D) and End Point RT-PCR (D). Three scalar dilutions of the same sample, assembled to three different Si NWs have been analyzed. Each dilution was analyzed with three replicates reactions for which the amplification plots (A) and the means with Standard deviation of 2−Ct values (B) have been reported. A significant linear relationship between RNA dilutions and 2−Ct values with (r) 0.864 and a P value of 0.0027 was observed. Melting curve analysis of Real-time RT-PCR products (D) and agarose gel electrophoresis of end point RT-PCR products on three different samples (E) reveal the absence of non-specific amplicons.
Discussion
The characterization and analysis of DNA and incRNAs enclosed inside sEVs and released from tumor cells into biological fluids is perhaps the most promising application of liquid biopsy. In fact, in a minimally invasive way, it is possible to obtain diagnostic, prognostic, and predictive biomarkers to use in precision medicine. Liquid biopsy can be applied not only in cancers but also in different pathologies such as neurodegenerative diseases and in preimplantation diagnosis.Citation10,Citation13,Citation14 Despite remarkable progress, the complexity and challenges of standard methods to accurately isolate, characterize, and quantify EVs represent limiting factors in the application of the procedure in clinical practice.Citation18–Citation20
In this paper, a Si-based platform realized with a low-cost industrially compatible process is reported for the first time as a novel selective platform. This sensor surpasses traditional approaches in the isolation, concentration, and quantification of sEVs. Indeed, this Si NW sensor shows a limit of detection of about 2×10⁵ Ex/mL and the possibility to carry out the measurement on very small volume samples, surpassing traditional approaches that require volumes of at least 100 µL and are, at the same time, far less sensitive. To the best of our knowledge this sensor surpasses the state of the art LOD of the other sensors reported in the literature of at least one order of magnitude.Citation34 Compared with standard immunoassays that present some of the best LODs such as ELISA (whose LOD is around 108 EX/mL) the advantage is of several orders of magnitude for sEV detection. Moreover, the operating range of this Si NW platform between 105 and 1011 sEVs/mL is perfectly tailored to work with real sEV concentrations in human bio-fluid samples.
We tested the sensitivity of our platform with blastocoel fluids (BF) representing a case in point where standard approaches usually fail. Indeed, to characterize BF sEVs by NTA at least three different samples have to be pooled and the obtained values are close to the LOD for both NTA tracking analysis and ELISA, making their measures complex and sometimes unreliable.Citation17 However, as shown in this paper, by using this novel Si NW platform we were able to isolate and quantify BF sEV CD81+ from a single sample, addressing the crucial demand for higher performance sensors (). This Si NW sensor can perfectly operate with these small volumes and concentrations that cannot be measured by other standard approaches such as dynamic light scattering, NTA, and ELISA. Moreover, by using a microliter dispenser and thanks to the photolithography process cavity-based approach, this sensor could be used with even smaller volumes.
Another remarkable point is the possibility to recover the isolated and quantified vesicles to directly carry out the molecular analysis of the cargo on the same aliquot. Furthermore, we demonstrated that the isolation and quantification steps preserve vesicle morphology and do not degrade nucleic acid cargo (–). In fact, in scalar dilutions of the same sample, loaded onto three different Si NW platforms, a significant correlation between nucleic acid concentration and the dilutions was found. We verified that not only the miRNAs, well-known to resist degradation, but also MALAT1, a long RNA molecule, can be properly analyzed after the isolation and quantification by our sensor ( and ).
In this work, CD81+ sEVs have been isolated but it could be possible to isolate other specific vesicle subpopulations by using different specific antibodies and to release them unmodified, even after the quantification process. Thus, this device offers the possibility to study only the content of the selected sEVs among the other EVs present in bio-fluids. The future perspectives of this novel platform are manifold, not all for the quantification but above all for the further study of macromolecules such as DNA or RNAs inside sEVs with a tremendous impact on both sEV research and precision medicine.
Experimental Method
Materials
Commercial 4” Si wafers were purchased from Siegert Wafer, whereas hydrofluoric acid (HF) and hydrogen peroxide were from Honeywell and Sigma Aldrich, respectively. Streptavidin and Phosphate Buffer Saline (PBS, 0.01 M phosphate buffer, 0.0027 M potassium chloride and 0.137 M sodium chloride, pH 7.4, at 25 °C) tablets were obtained from Sigma Aldrich, while the biotinylated anti-CD81 monoclonal antibody (specific for CD81 binding) was purchased from LifeSpan BioSciences. Exosomes were acquired from Hansa BioMed Life Sciences Ltd. Milli-Q water (18 MOhm × cm) was used in all steps of the synthesis and for the preparation of the aqueous solutions used for the functionalization.
Si NW Fabrication
The whole manufacturing procedure for the Si NW cavity fabrication is reported in the Supplementary Information. After a standard microelectronics-grade silicon cleaning with acetone and 2-propanol and Milli-Q water, followed by a hotplate de-hydration at 120°C for 600 sec, a negative resist was dispensed obtaining a layer with a final thickness of about 1.4 µm (AZ5214). The patterning of the photoresist was realized by a 365 nm optical lithography process in hard contact mode with a Karl Suss MA6 tool. The final circular patterns used for this activity had a diameter of about 100 µm. After the developing procedure, in order to increase the mask etching selectivity by the HF bath for the nanowire formation, a hard bake step at 150 °C for 10 min was performed on a hotplate.
Silicon nanowires were fabricated through a modified metal assisted chemical etching that involved the use of a thin discontinuous gold film.Citation45 A 2 nm gold layer was deposited by an Electron Beam Evaporator (Kenosystec equipment) at ultrahigh vacuum and at room temperature. The samples were then immersed in an aqueous solution of HF (2.5M) and H2O2 (0.25M). Gold acts as a catalyst and, in the presence of H2O2, as an oxidizing agent, driving the oxidation of the Si that is in contact with the metal layer. Hydrofluoric acid etches the silicon oxide driving the anisotropic etching of the Si just underneath this metal mask. Uncovered silicon regions remain unattached and form the Si NWs. As the last step, a gold etchant was used to completely remove the gold metal layer. All the chemical processes were carried out at room temperature and no gold contamination was detected inside the wires.
Functionalization Procedure
After the fabrication procedure, the Si NW arrays were cleaned by immersion in isopropanol (IPA) 1m, followed by 1min in Milli-Q water to remove the IPA residue, and finally dried by in a nitrogen flux. The functionalization protocolCitation50 was divided into 3 steps: i) Sample immersion in a streptavidin 10 µg/mL solution overnight (about 14 h); ii) Sample immersion in a biotinylated Anti-CD81 (Ab) 50 µg/mL solution for 4 h; iii) Immersion in the exosome solution overnight.
After each step, the sensing platform was rinsed in 10 mM phosphate buffer saline (PBS) three times to remove unconjugated molecules. Streptavidin was deliberately used as this protein strongly binds biotin. The dissociation constant for streptavidin-biotin binding is Kdiss= 10−15 M−1, allowing the efficient attachment of the biotinylated antibody for CD81, which is a transmembrane protein expressed on the phospholipidic membrane of sEVs. Thus, the use of the specific antibody guarantees the high selectivity required by this type of application. All the functionalization solutions and the exosome solutions used for the calibration were prepared using PBS.
The protocol adopted for the dye-binding used in the confocal microscopy experiment is reported in the Supplementary Information.
EV Isolation and Quantification
Follicular Fluid (FF) of preovulatory follicles was collected from women undergoing intracytoplasmic sperm injection (ICSI) cycles, recruited at the IVF Unit Cannizzaro Hospital, Catania (Italy), according to a previously published protocol.Citation51 EVs from FF samples were isolated by differential ultracentrifugation according to the protocol by Santonocito et al with minor modifications and resuspended in 1 mL PBS.Citation51,200 μL of EV suspension was loaded onto Si NWs for EV quantification.
To test the sensitivity of the Si NW array we quantified EVs also in BF samples from a single embryo. Expanded blastocysts on day 5 underwent blastocentesis and cryopreservation as previously described.Citation17 Around 0.3–0.5 nL of BF isolated from each blastocyst were transferred to a PCR tube with 5 μL of RNase-free water and stored at −80 °C until further processing. Because of the low quantity of samples, no procedure of EV purification was performed. Specifically, BF samples diluted in 50 μL PBS were loaded onto Si NWs for EV isolation and quantification.
Structural and Optical Measurements
The scanning electron microscope (SEM) images were acquired using a ZEISS Supra 25 microscope by an InLens detector with typically 5 KeV of extraction voltage.
In the case of the exosome images, a typical protocol for the analysis of biological samples was used (more detail in the Supplementary Material).Citation17 The solution containing the exosomes detached from the Si NW platform was drop-cast onto a glass support on the top of a SEM sample holder and was then dehydrated by several washing steps with aqueous solutions at increasing IPA percentages. Finally, as widely reported in the literature, the sample was decorated with gold through a previously calibrated sputtering procedure obtaining a uniform gold decoration. This step is essential to make the sample conductive as required by a standard SEM analysis.
Laser scanning confocal microscopy (LSCM) was carried out with a direct confocal microscope (Leica TSC SP8 TCS SMD FLCS, Leica Microsystem, Germany) by using a fully tunable supercontinuum white-light laser. To avoid perturbations associated with the use of an immersion objective, a low-resolution 20x dry objective was used. Therefore, the size of the analyzed structures is exaggerated. All data were subsequently processed with Leica LAS AF LITE (Leica Microsystems, Germany).
The photoluminescence signals were acquired using a HR800 spectrometer by Horiba Jobin-Yvon. The excitation was obtained through the 476.5 nm line of an Ar+ laser and focused through a 100X (NA=0.9) objective with a power of 100 µW onto the sample plane. The Spectrometer works in a backscattering configuration and the signal is then obtained by the same objective, spectrally decomposed by a 600 L/mm grating, and acquired through a Peltier cooled CCD at −70°C (Synapse).
EV Recovery and Molecular Analysis of the Cargo
To verify the possibility of recovering undamaged EVs after isolation and quantification by Si NWs, the platform with sEVs from BF was transferred into a new 1.5 mL Eppendorf tube containing PBS 1x (diluted 1:5 in RNase-free water) and heated to 60 °C for 60 sec and then removed.Citation52 EV elution was then transferred at −20 °C and processed for SEM analysis.
To verify the best way to store and later analyze the vesicle content demonstrating that the laser treatment does not affect RNA integrity and amplification, we assayed miR-212 in different samples. Specifically, Si NWs with or without laser exposure and differently stored, with either 200 μL of PBS or Qiazol Lysis Reagent, were processed for RNA purification and miRNA amplification (described below). Moreover, we evaluated the quality of isolated RNA cargo by assessing three EV preparations at different concentrations. Specifically, we tested two miRNAs (miR-132 and miR-203) and one lncRNA (MALAT1) by Real-Time RT-PCR in scalar dilutions of two single samples. Each dilution was analyzed with three technical replicate reactions. The schemes and description of the protocols are reported in the Supplementary Information.
Total RNA was extracted from FF-EV samples, still fixed on the NW platform, by using the miRNeasy mini kit (Qiagen, GmbH, Hilden, Germany), according to the manufacturer’s instructions, and finally eluted in a 30 μL total volume of RNase-free water. Due to the limited quantities of sample and according to previous papers, no quantification or quality control was carried out at this stage.Citation17
4.5 μL of total RNA was used for miRNA-specific reverse transcription (RT) to obtain miRNA-specific cDNAs. 5μL of the cDNA total volume was analyzed with qRT-PCR using TaqMan MicroRNA Assays (Applied Biosystems). All qRT-PCR reactions were performed in 20 μL, containing 10 μL of TaqMan Universal PCR Master Mix (Applied Biosystems), 1 μL of miRNA-specific TaqMan MicroRNA Assay, 5 μL of RT product and 4 μL of nuclease-free water. We assayed three miRNAs (miR-212, miR-132 and miR-203), previously detected in FF.Citation51 For each reaction, the following amplification profile was applied: 95 °C for 10 min for the first cycle; 95 °C for 15 sec and 60 °C for 1 m for 40 cycles.
For the analysis of longer RNA molecules, the lncRNA Metastasis Associated Lung Adenocarcinoma Transcript 1 (MALAT1) was selected by querying the public database ExoCarta (http://www.exocarta.org/) and literature data retrieval for genes expressed within the exosomes of FF. Primers for the MALAT1 lncRNA sequence were designed using Primer Blast software (Primer sequences are shown in Supplementary Material). Three different qRT-PCR reactions per sample were performed in a single step using 5 μL of total RNA and Power SYBR® Green RNA-to-Ct™ 1-StepKit (Applied Biosystems) according to the manufacturer’s protocol. The reaction was performed in the 7900 HT Fast Real-Time PCR System (Applied Biosystems) according to the following protocol: 48°C for 30 m for RT reaction, 95°C for 10 min for the first cycle, followed by 40 cycles of amplification (95°C for 15 seconds and 60°C for 1 m). Finally, 95°C for 15 sec and 60°C for 15 sec for melting curve analysis.
Simultaneously, complementary cDNA was synthesized from 5 μL of total RNA from three different FF-EV samples using SuperScript II Reverse Transcriptase (Invitrogen S.R.L.) and random hexamer primers (Roche Molecular Diagnostics) according to standard protocols. We performed 3 different PCR reactions by using Platinum Taq polymerase (Invitrogen).
For statistical analysis, Pearson’s Correlation coefficient (r) and P-value were calculated using GraphPad Prism 6. Expression data are shown as mean 2−Ct (threshold cycle) values ± SD (Standard deviation). The correlation between RNA inputs (1x, 2x and 4x) and each data point representing 2−Ct values were determined for miR-132, miR-203 and MALAT1.
Synthetic Vesicles Preparation
Synthetic vesicles were made of Soybean lecithin and were prepared according to the protocol reported in.Citation53 Unilamellar vesicles with a diameter of 100 nm were obtained. Their concentration was estimated according to this work.
Acknowledgment
We acknowledge the project ADAS + ARS01_00459. The authors would like to thank the Scientific Bureau of the University of Catania for language support and Fondi di ateneo 2020–2022, University of Catania, Open Access line, and Project Piaceri-University of Catania.
Disclosure
The authors report no conflicts of interest in this work.
References
- Chen X, Ba Y, Ma L, et al. Characterization of microRNAs in serum: a novel class of biomarkers for diagnosis of cancer and other diseases. Cell Res. 2008;18(10):997–1006. doi:10.1038/cr.2008.282
- Morrow DA, Braunwald E. Future of biomarkers in acute coronary syndromes: moving toward a multimarker strategy. Circulation. 2003;108(3):250–252. doi:10.1161/01.CIR.0000078080.37974.D2
- Jhala N, Jhala D, Vickers SM, et al. Biomarkers in diagnosis of pancreatic carcinoma in fine-needle aspirates. Am J Clin Pathol. 2006;126(4):572–579. doi:10.1309/CEV30BE088CBDQD9
- Fremont RD, Koyama T, Calfee CS, et al. Acute lung injury in patients with traumatic injuries: utility of a panel of biomarkers for diagnosis and pathogenesis. J Trauma Inj Infect Crit Care. 2010;68(5):1121–1127. doi:10.1097/TA.0b013e3181c40728
- Schuetz P, Aujesky D, Mueller C, Mueller B. Biomarker-guided personalised emergency medicine for all - Hope for another hype? Swiss Med Wkly. 2015;145(0708). doi:10.4414/smw.2015.14079
- Aalberts M, van Dissel-emiliani FM, van Adrichem NP, et al. Identification of distinct populations of prostasomes that differentially express prostate stem cell antigen, Annexin A1, and GLIPR2 in Humans1. Biol Reprod. 2012;86(3). doi:10.1095/biolreprod.111.095760
- Kowal J, Arras G, Colombo M, et al. Proteomic comparison defines novel markers to characterize heterogeneous populations of extracellular vesicle subtypes. Proc Natl Acad Sci U S A. 2016;113(8):E968–E977. doi:10.1073/pnas.1521230113
- Bobrie A, Colombo M, Krumeich S, Raposo G, Théry C. Diverse subpopulations of vesicles secreted by different intracellular mechanisms are present in exosome preparations obtained by differential ultracentrifugation. J Extracell Vesicles. 2012;1(1):18397. doi:10.3402/jev.v1i0.18397
- Willms E, Johansson HJ, Mäger I, et al. Cells release subpopulations of exosomes with distinct molecular and biological properties. Sci Rep. 2016;6(1):1–12. doi:10.1038/srep22519
- Boriachek K, Islam MN, Möller A, et al. Biological functions and current advances in isolation and detection strategies for exosome nanovesicles. Small. 2018;14(6):1702153. doi:10.1002/smll.201702153
- Valadi H, Ekström K, Bossios A, Sjöstrand M, Lee JJ, Lötvall JO. Exosome-mediated transfer of mRNAs and microRNAs is a novel mechanism of genetic exchange between cells. Nat Cell Biol. 2007;9(6):654–659. doi:10.1038/ncb1596
- György B, Szabó TG, Pásztói M, et al. Membrane vesicles, current state-of-the-art: emerging role of extracellular vesicles. Cell Mol Life Sci. 2011;68(16):2667–2688. doi:10.1007/s00018-011-0689-3
- D’Anca M, Fenoglio C, Serpente M, et al. Exosome determinants of physiological aging and age-related neurodegenerative diseases. Front Aging Neurosci. 2019;11:232. doi:10.3389/fnagi.2019.00232
- Huang T, Deng CX. Current progresses of exosomes as cancer diagnostic and prognostic biomarkers. Int J Biol Sci. 2019;15(1):1–11. doi:10.7150/ijbs.27796
- Aragona CO, Imbalzano E, Mamone F, et al. Endothelial progenitor cells for diagnosis and prognosis in cardiovascular disease. Stem Cells Int. 2015;2016:8043792. doi:10.1155/2016/8043792
- Da Silva MN, Sicchieri LB, Rodrigues De Oliveira Silva F, Andrade MF, Courrol LC. Liquid biopsy of atherosclerosis using protoporphyrin IX as a biomarker. Analyst. 2014;139(6):1383–1388. doi:10.1039/c3an01945d
- Battaglia R, Palini S, Vento ME, et al. Identification of extracellular vesicles and characterization of miRNA expression profiles in human blastocoel fluid. Sci Rep. 2019;9(1):84. doi:10.1038/s41598-018-36452-7
- Russell AE, Sneider A, Witwer KW, et al. Biological membranes in EV biogenesis, stability, uptake, and cargo transfer: an ISEV position paper arising from the ISEV membranes and EVs workshop. J Extracell Vesicles. 2019;8(1):1684862. doi:10.1080/20013078.2019.1684862
- Mateescu B, Kowal EJK, van Balkom BWM, et al. Obstacles and opportunities in the functional analysis of extracellular vesicle RNA - An ISEV position paper. J Extracell Vesicles. 2017;6(1). doi:10.1080/20013078.2017.1286095
- Ludwig N, Whiteside TL, Reichert TE. Challenges in exosome isolation and analysis in health and disease. Int J Mol Sci. 2019;20(19):4684. doi:10.3390/ijms20194684
- Piotrowska M, Ciura K, Zalewska M, et al. Capillary zone electrophoresis of bacterial extracellular vesicles: a proof of concept. J Chromatogr A. 2020:1621. doi:10.1016/j.chroma.2020.461047.
- Morani M, Mai TD, Krupova Z, et al. Electrokinetic characterization of extracellular vesicles with capillary electrophoresis: a new tool for their identification and quantification. Anal Chim Acta. 2020;1128:42–51. doi:10.1016/j.aca.2020.06.073
- El OO, Salim H, Pero-Gascon R, Benavente F. A simple method for the analysis of extracellular vesicles enriched for exosomes from human serum by capillary electrophoresis with ultraviolet diode array detection. J Chromatogr A. 2021;1635:461752. doi:10.1016/j.chroma.2020.461752
- Zhang H, Lyden D. Asymmetric-flow field-flow fractionation technology for exomere and small extracellular vesicle separation and characterization. Nat Protoc. 2019;14(4):1027–1053. doi:10.1038/s41596-019-0126-x
- Shao H, Chung J, Balaj L, et al. Protein typing of circulating microvesicles allows real-time monitoring of glioblastoma therapy. Nat Med. 2012;18(12):1835–1840. doi:10.1038/nm.2994
- Yoon H, Jang J. Conducting-polymer nanomaterials for high-performance sensor applications: issues and challenges. Adv Funct Mater. 2009;19(10):1567–1576. doi:10.1002/adfm.200801141
- Xu K, Huang J, Ye Z, Ying Y, Li Y. Recent development of nano-materials used in DNA biosensors. Sensors (Basel). 2009;9(7):5534–5557. doi:10.3390/s90705534
- Lo Faro MJ, D’andrea C, Leonardi AA, Morganti D, Irrera A, Fazio B. Fractal silver dendrites as 3D SERS platform for highly sensitive detection of biomolecules in hydration conditions. Nanomaterials. 2019;9(11). doi:10.3390/nano9111630
- Im H, Shao H, Park Y Il, et al. Label-free detection and molecular profiling of exosomes with a nano-plasmonic sensor. Nat Biotechnol. 2014;32(5):490–495. doi:10.1038/nbt.2886
- Grasso L, Wyss R, Weidenauer L, et al. Molecular screening of cancer-derived exosomes by surface plasmon resonance spectroscopy. Anal Bioanal Chem. 2015;407(18):5425–5432. doi:10.1007/s00216-015-8711-5
- Zhu L, Wang K, Cui J, et al. Label-free quantitative detection of tumor-derived exosomes through surface plasmon resonance imaging. Anal Chem. 2014;86(17):8857–8864. doi:10.1021/ac5023056
- Sina AAI, Vaidyanathan R, Dey S, Carrascosa LG, Shiddiky MJA, Trau M. Real time and label free profiling of clinically relevant exosomes. Sci Rep. 2016;6(1):1–9. doi:10.1038/srep30460
- Rupert DLM, Lässer C, Eldh M, et al. Determination of exosome concentration in solution using surface plasmon resonance spectroscopy. Anal Chem. 2014;86(12):5929–5936. doi:10.1021/ac500931f
- Im H, Lee K, Weissleder R, Lee H, Castro CM. Novel nanosensing technologies for exosome detection and profiling. Lab Chip. 2017;17(17):2892–2898. doi:10.1039/c7lc00247e
- Irrera A, Artoni P, Saija R, et al. Size-scaling in optical trapping of silicon nanowires. Nano Lett. 2011;11(11):4879–4884. doi:10.1021/nl202733j
- Cao L, Fan P, Vasudev AP, et al. Semiconductor nanowire optical antenna solar absorbers. Nano Lett. 2010;10(2):439–445. doi:10.1021/nl9036627
- Javey A, Nam S, Friedman RS, Yan H, Lieber CM. Layer-by-layer assembly of nanowires for three-dimensional, multifunctional electronics. Nano Lett. 2007;7(3):773–777. doi:10.1021/nl063056l
- Cui Y, Zhong Z, Wang D, Wang WU, Lieber CM. High performance silicon nanowire field effect transistors. Nano Lett. 2003;3(2):149–152. doi:10.1021/nl025875l
- Wu H, Cui Y. Designing nanostructured Si anodes for high energy lithium ion batteries. Nano Today. 2012;7(5):414–429. doi:10.1016/J.NANTOD.2012.08.004
- Donato MGMG, Brzobohatý O, Simpson SHSH, et al. Optical trapping, optical binding, and rotational dynamics of silicon nanowires in counter-propagating beams. Nano Lett. 2019;19(1):342–352. doi:10.1021/acs.nanolett.8b03978
- Bunimovich YL, Shin YS, Yeo WS, Amori M, Kwong G, Heath JR. Quantitative real-time measurements of DNA hybridization with alkylated nonoxidized silicon nanowires in electrolyte solution. J Am Chem Soc. 2006;128(50):16323–16331. doi:10.1021/ja065923u
- Kwon SM, Kang GB, Kim YT, Kim Y-H, Ju B-K. In-situ detection of C-reactive protein using silicon nanowire field effect transistor. J Nanosci Nanotechnol. 2011;11(2):1511–1514. doi:10.1166/jnn.2011.3417.
- Irrera A, Magazzù A, Artoni P, et al. Photonic torque microscopy of the nonconservative force field for optically trapped silicon nanowires. Nano Lett. 2016;16(7):4181–4188. doi:10.1021/acs.nanolett.6b01059
- Fazio B, Artoni P, Iatì MA, et al. Strongly enhanced light trapping in a two-dimensional silicon nanowire random fractal array. Light Sci Appl. 2016;5(4):e16062–e16062. doi:10.1038/lsa.2016.62
- Fazio B, Irrera A, Pirotta S, et al. Coherent backscattering of Raman light. Nat Photonics. 2017;11(3):170–176. doi:10.1038/nphoton.2016.278
- Irrera A, Leonardi AA, Di Franco C, et al. New generation of ultrasensitive label-free optical si nanowire-based biosensors. ACS Photonics. 2018;5(2):471–479. doi:10.1021/acsphotonics.7b00983
- Leonardi AA, Lo Faro MJ, Petralia S, et al. Ultrasensitive Label- and PCR-Free genome detection based on cooperative hybridization of silicon nanowires optical biosensors. ACS Sensors. 2018;3(9):1690–1697. doi:10.1021/acssensors.8b00422
- Gesztelyi R, Zsuga J, Kemeny-Beke A, Varga B, Juhasz B, Tosaki A. The Hill equation and the origin of quantitative pharmacology. Arch Hist Exact Sci. 2012;66(4):427–438. doi:10.1007/s00407-012-0098-5
- Leonardi AA, Lo Faro MJ, Irrera A. Biosensing platforms based on silicon nanostructures: a critical review. Anal Chim Acta. 2021;338393. doi:10.1016/j.aca.2021.338393
- Leonardi AA, Lo Faro MJ, Di Franco C, et al. Silicon nanowire luminescent sensor for cardiovascular risk in saliva. J Mater Sci Mater Electron. 2020;31(1):10–17. doi:10.1007/s10854-018-0417-y
- Santonocito M, Vento M, Guglielmino MR, et al. Molecular characterization of exosomes and their microRNA cargo in human follicular fluid: bioinformatic analysis reveals that exosomal microRNAs control pathways involved in follicular maturation. Fertil Steril. 2014;102(6):1751–1761.e1. doi:10.1016/j.fertnstert.2014.08.005
- Holmberg A, Blomstergren A, Nord O, Lukacs M, Lundeberg J, Uhlén M. The biotin-streptavidin interaction can be reversibly broken using water at elevated temperatures. Electrophoresis. 2005;26(3):501–510. doi:10.1002/elps.200410070
- Mallardi A, Nuzziello N, Liguori M, Avolio C, Palazzo G. Counting of peripheral extracellular vesicles in Multiple Sclerosis patients by an improved nanoplasmonic assay and dynamic light scattering. Colloids Surfaces B Biointerfaces. 2018;168:134–142. doi:10.1016/j.colsurfb.2018.02.006